

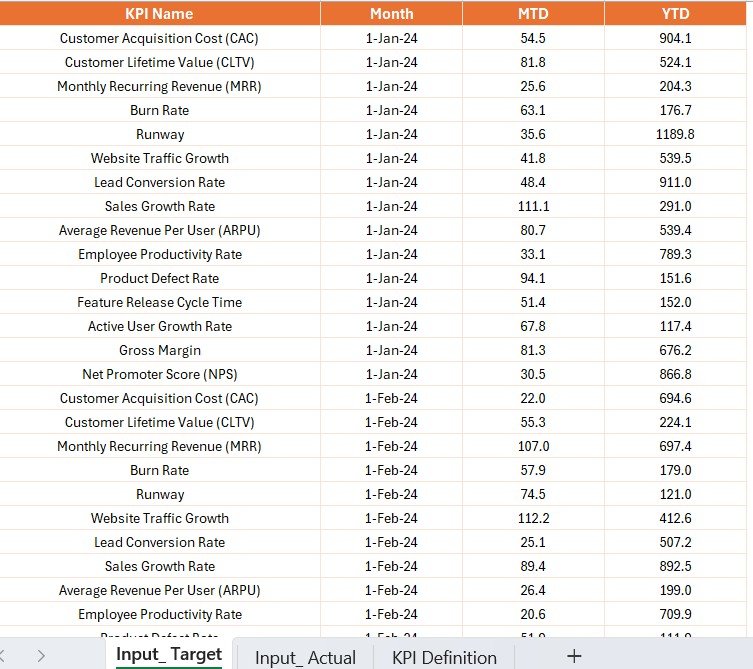
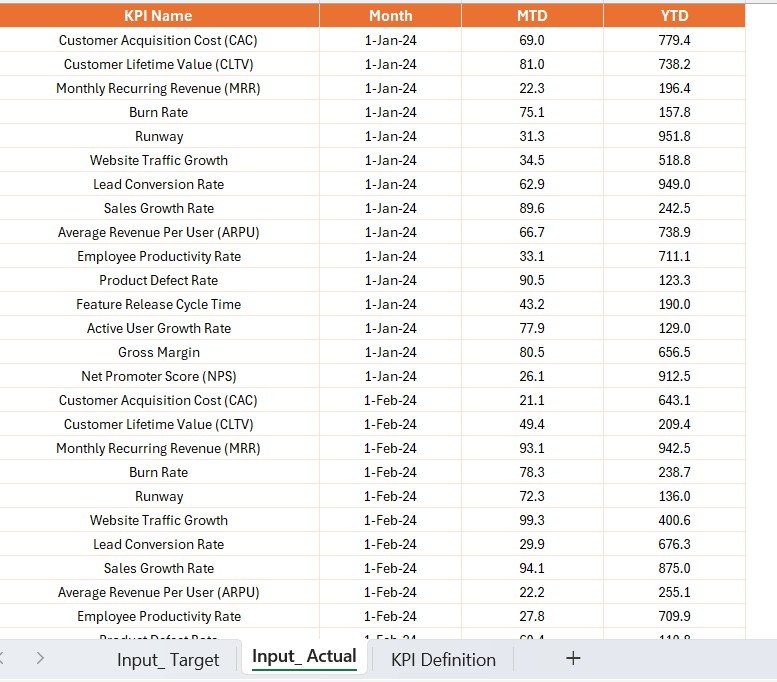
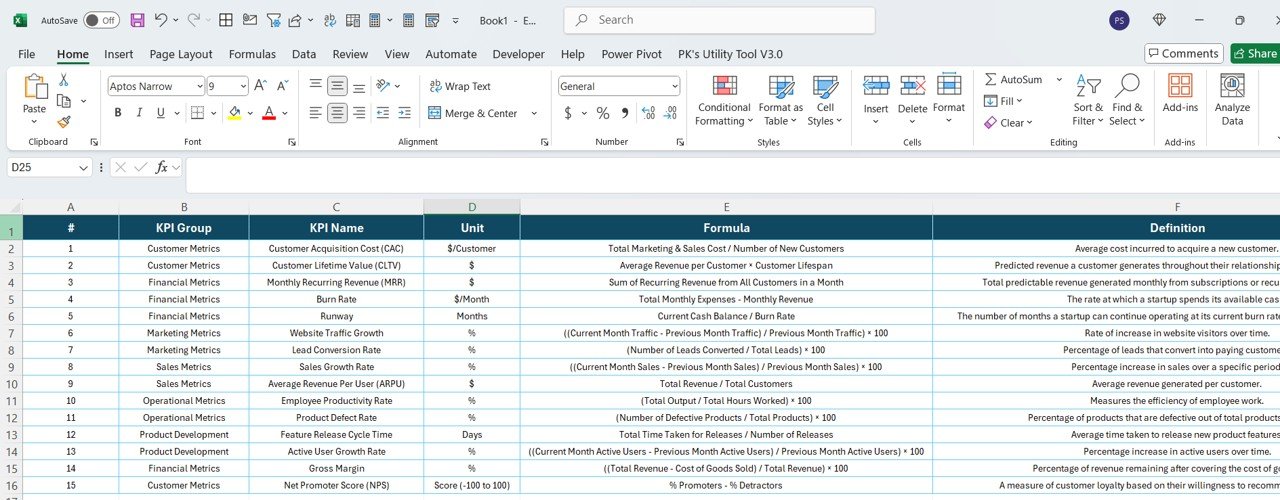

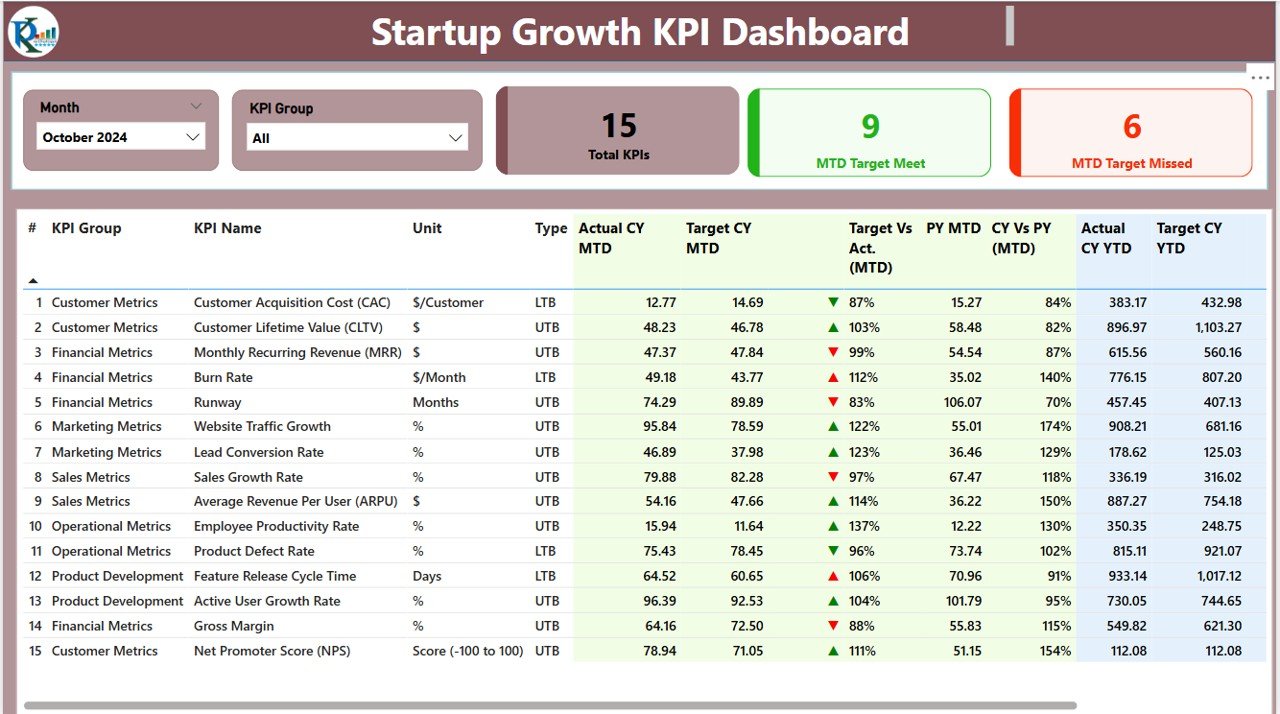
The Startup Growth KPI Dashboard in Power BI is an essential tool for entrepreneurs, investors, and startup managers looking to track and analyze the key performance indicators (KPIs) that drive their business growth. This Power BI dashboard provides real-time insights into your startup’s performance, helping you monitor critical metrics such as revenue growth, customer acquisition, market penetration, and product performance.
Designed to help you visualize your data clearly, this dynamic and interactive dashboard offers a comprehensive view of your startup’s health, performance trends, and areas for improvement. With customizable KPIs, you can adapt the dashboard to suit your unique business needs and make data-driven decisions to propel your startup forward.
Key Features of the Startup Growth KPI Dashboard in Power BI
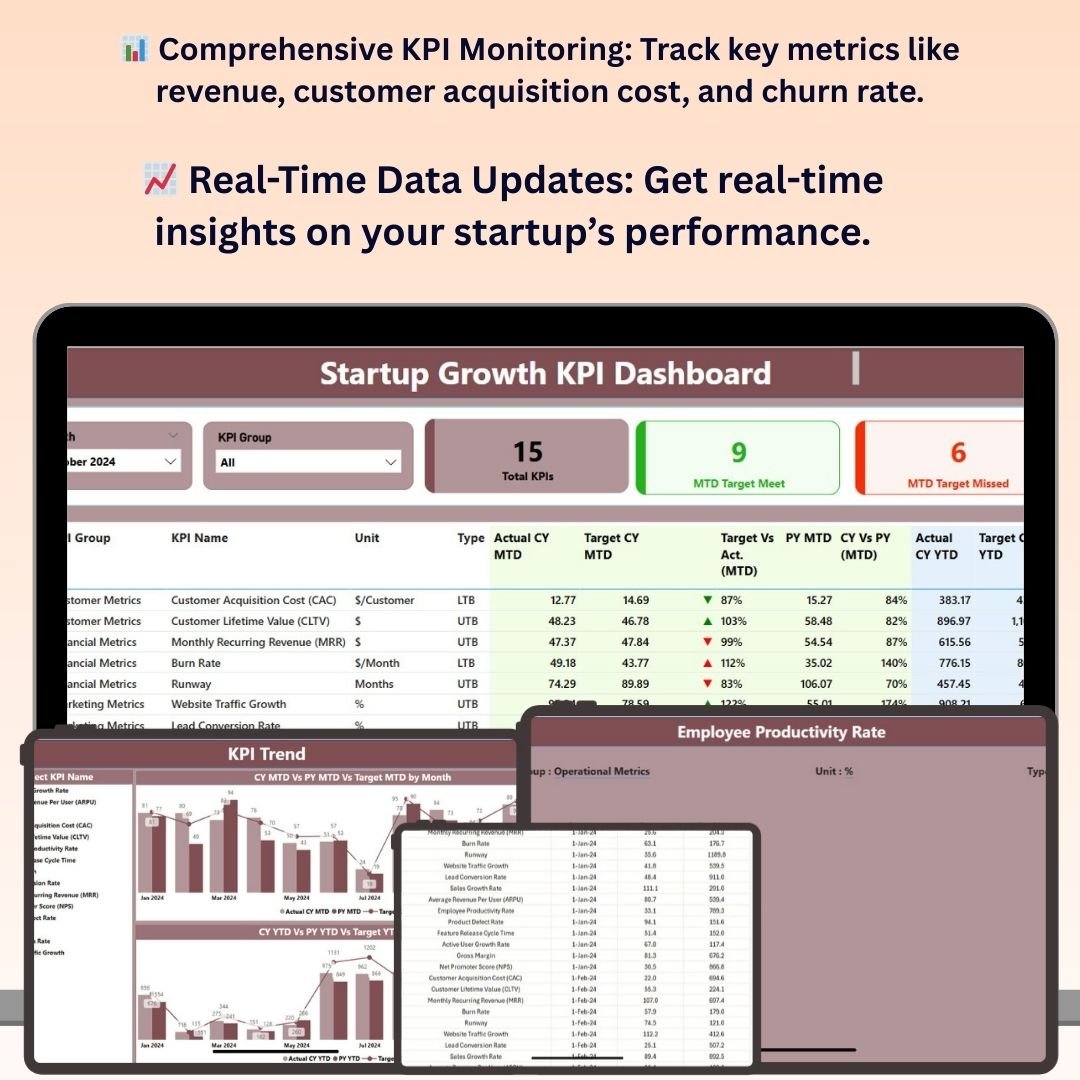
📊 Comprehensive KPI Monitoring
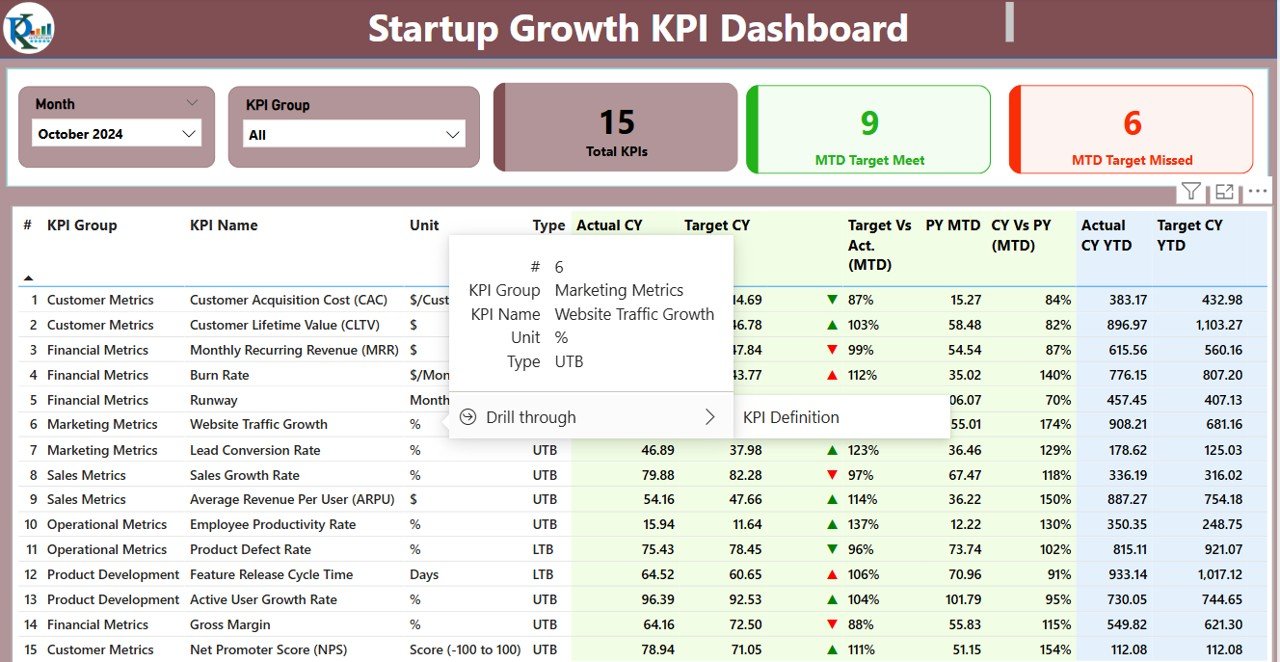
Track a wide range of key metrics that are vital for your startup’s growth, including revenue growth, customer acquisition cost (CAC), lifetime value (LTV), churn rate, and product adoption rate. Get a holistic view of your startup’s performance in one place.
📈 Real-Time Data Updates
Integrate your startup’s data with the dashboard for real-time updates. Whether you’re tracking sales, customer activity, or website traffic, you’ll have access to up-to-date data that helps you make informed decisions.
🧑💼 Customer Acquisition & Retention Metrics
Track your customer acquisition cost (CAC) and lifetime value (LTV) alongside retention metrics. These KPIs are essential for understanding how efficiently you’re growing your customer base and ensuring long-term success.
💡 Revenue Growth Analysis
Monitor your startup’s revenue growth and identify trends in sales performance. Understand the factors that are driving or hindering your growth and take corrective actions where needed.
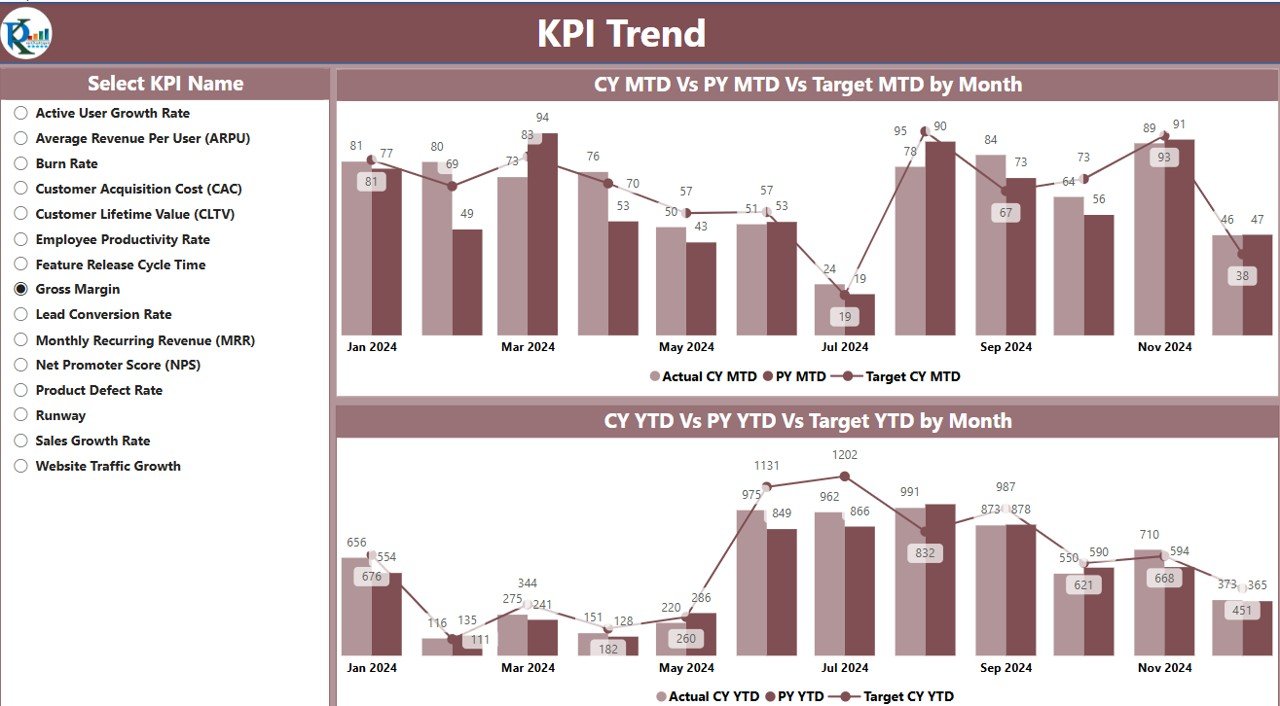
📅 Time-Based Analysis
Evaluate the performance of your startup over various time frames, such as weekly, monthly, quarterly, or yearly. This allows you to identify trends, seasonal patterns, and long-term growth strategies.
⚙️ Customizable & Scalable Dashboard
Customize the dashboard to track the KPIs that are most relevant to your startup’s growth strategy. Whether you’re a tech startup, SaaS company, or e-commerce business, this dashboard can scale to meet your unique needs.
Why You’ll Love the Startup Growth KPI Dashboard in Power BI
✅ Centralized Data & Insights
Get a clear and comprehensive overview of your startup’s key metrics in one interactive dashboard. Say goodbye to fragmented data and inefficient reporting.
✅ Data-Driven Decision Making
Use real-time data to make smarter business decisions. This dashboard provides actionable insights that allow you to optimize your growth strategies and performance.
✅ Track Revenue Growth & Customer Acquisition
Monitor revenue trends, customer acquisition costs, and lifetime value to ensure your business model is sustainable and profitable.
✅ Measure Business Performance Across Multiple Metrics
From product adoption to customer retention, track a variety of performance indicators to ensure your startup is heading in the right direction.
✅ Easy to Use & Customize
With its user-friendly interface and customizable KPIs, this dashboard can easily adapt to your startup’s unique needs and growth stages.
What’s Inside the Startup Growth KPI Dashboard in Power BI?
- Revenue Growth Tracking: Monitor the growth of your revenue over time and analyze key trends.
- Customer Acquisition & Retention Metrics: Track your customer acquisition cost, lifetime value, and retention rate.
- Churn Rate & Product Adoption Metrics: Measure churn rate and track how well your product is being adopted by users.
- Time-Based Performance Analysis: Evaluate startup performance over different time periods to identify growth trends.
- Customizable KPIs: Tailor the dashboard to fit the unique needs of your startup.
How to Use the Startup Growth KPI Dashboard in Power BI
1️⃣ Download the Dashboard Template: Get the Startup Growth KPI Dashboard for Power BI instantly.
2️⃣ Integrate Your Data Sources: Link your sales, customer, and website data to the dashboard.
3️⃣ Track Key Metrics: Monitor KPIs such as revenue, customer acquisition cost, and lifetime value.
4️⃣ Analyze Time-Based Trends: Evaluate performance over time to spot trends and make necessary adjustments.
5️⃣ Make Data-Driven Decisions: Use the insights from the dashboard to inform your startup’s growth strategy and take action.
Who Can Benefit from the Startup Growth KPI Dashboard in Power BI?
🔹 Entrepreneurs & Startup Founders
🔹 Business Analysts & Data Scientists
🔹 Product Managers & Marketing Teams
🔹 Investors & Venture Capitalists
🔹 SaaS Companies & E-commerce Startups
🔹 Business Consultants & Advisors
The Startup Growth KPI Dashboard in Power BI empowers you to make data-driven decisions and accelerate your startup’s growth. Monitor your startup’s performance across key metrics, optimize customer acquisition strategies, and drive sustainable business growth.
Click here to read the Detailed blog post
Visit our YouTube channel to learn step-by-step video tutorials
Youtube.com/@PKAnExcelExpert
Compatibility and Requirements
- Built for Power BI Desktop, which is free. You can download it from Microsoft: Get Power BI Desktop.
- Open the file in Power BI Desktop to use its charts and visuals with your own data.
Frequently Asked Questions
What does the Startup Growth KPI Dashboard track?
It tracks revenue growth, customer acquisition cost, customer lifetime value, retention rate, churn rate and product adoption.
Which data sources can I use?
You link your sales, customer and website data to the dashboard.
Can I review growth over time?
Yes. You can compare performance across time periods to spot growth trends.
Is there an Excel or Google Sheets version?
Yes. The Startup Growth KPI Dashboard in Excel and the Google Sheets edition track the same KPIs.
Related Startup and Growth Templates
- Startup Growth KPI Dashboard in Excel: the same dashboard in Excel
- Startup Growth KPI Dashboard in Google Sheets: the same dashboard in Google Sheets
- Startup Growth KPI Scorecard in Excel: a startup growth scorecard in Excel
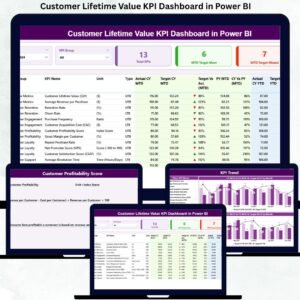
- Customer Lifetime Value KPI Dashboard in Power BI: customer lifetime value KPIs in Power BI
- Power BI Dashboard Mega Collection: 15 Power BI dashboards in one download
Browse all Power BI KPI dashboards or the Power BI dashboards.















Reviews
There are no reviews yet.