

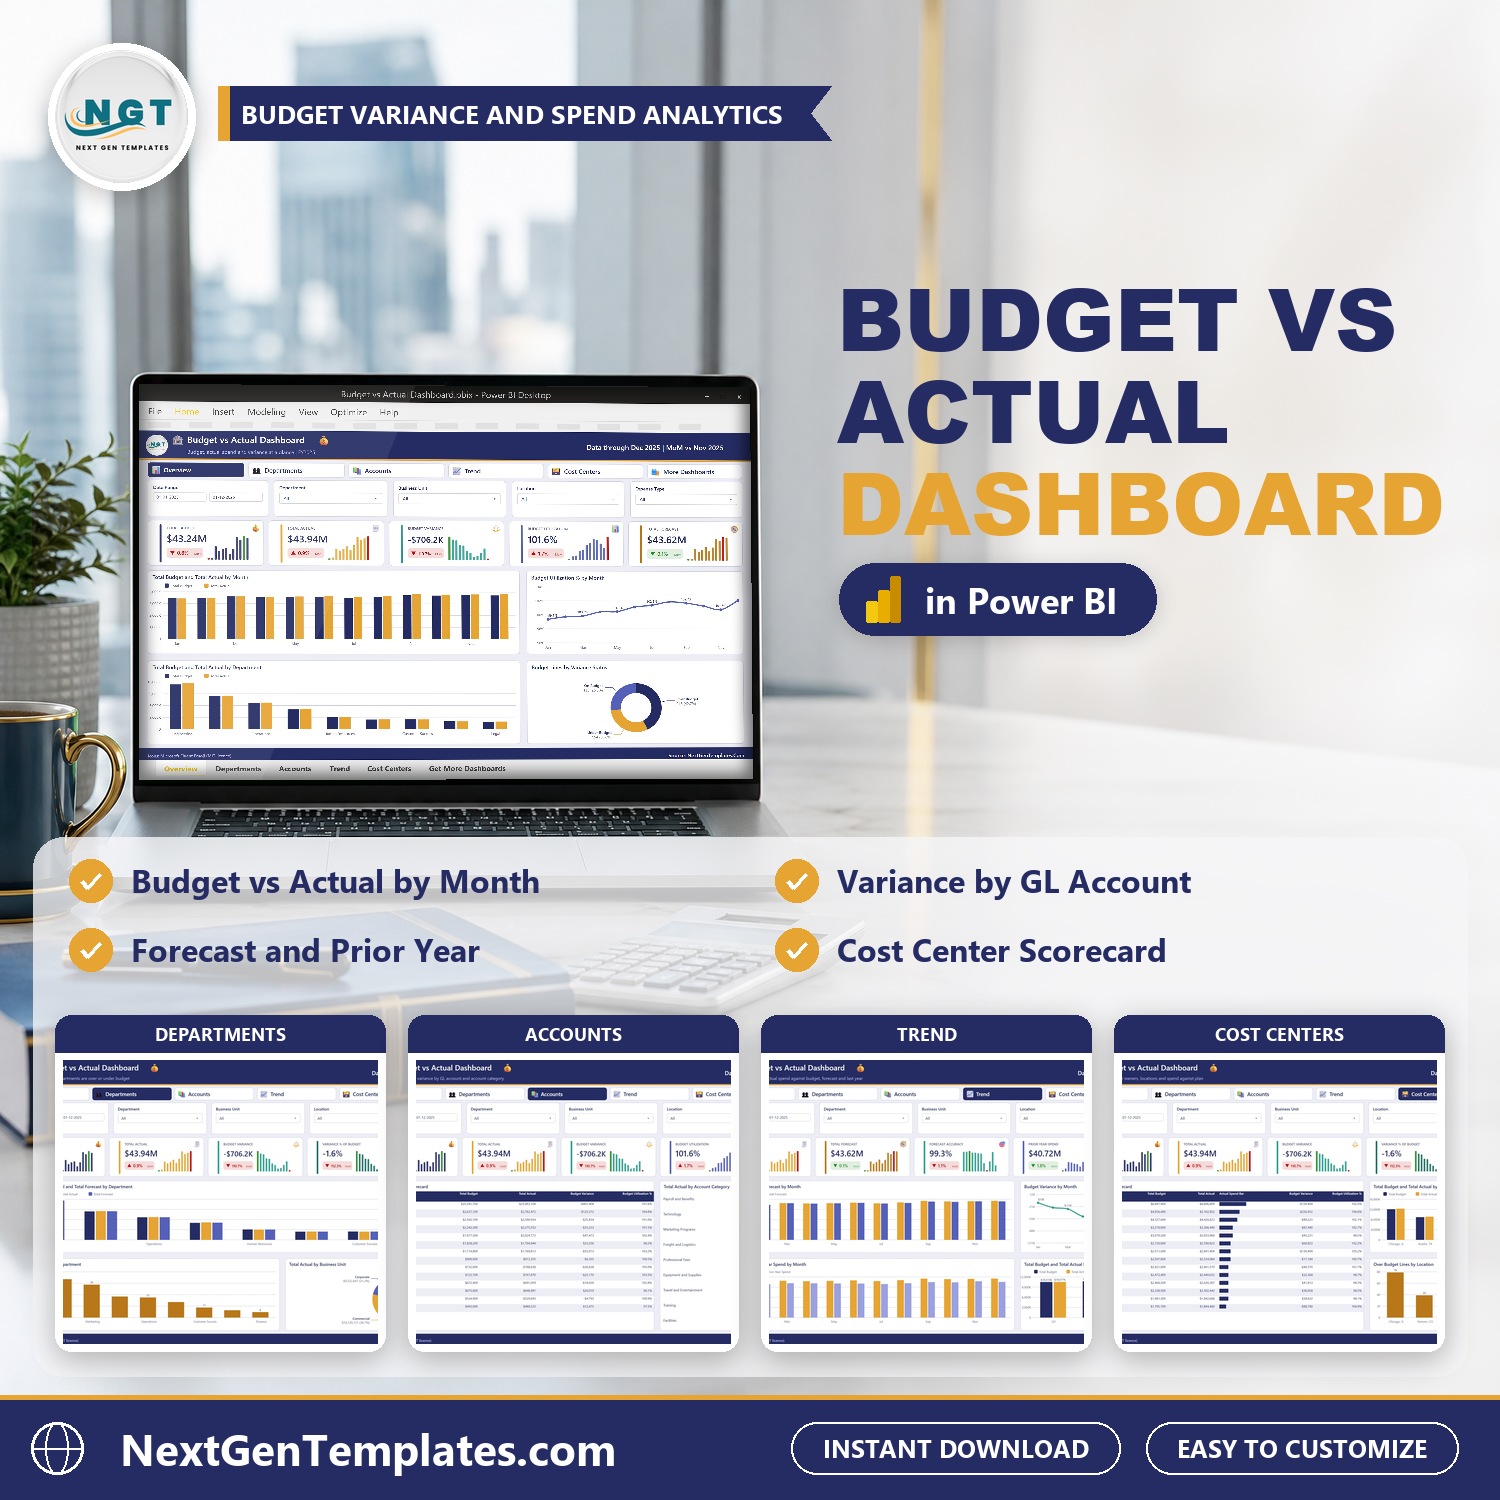
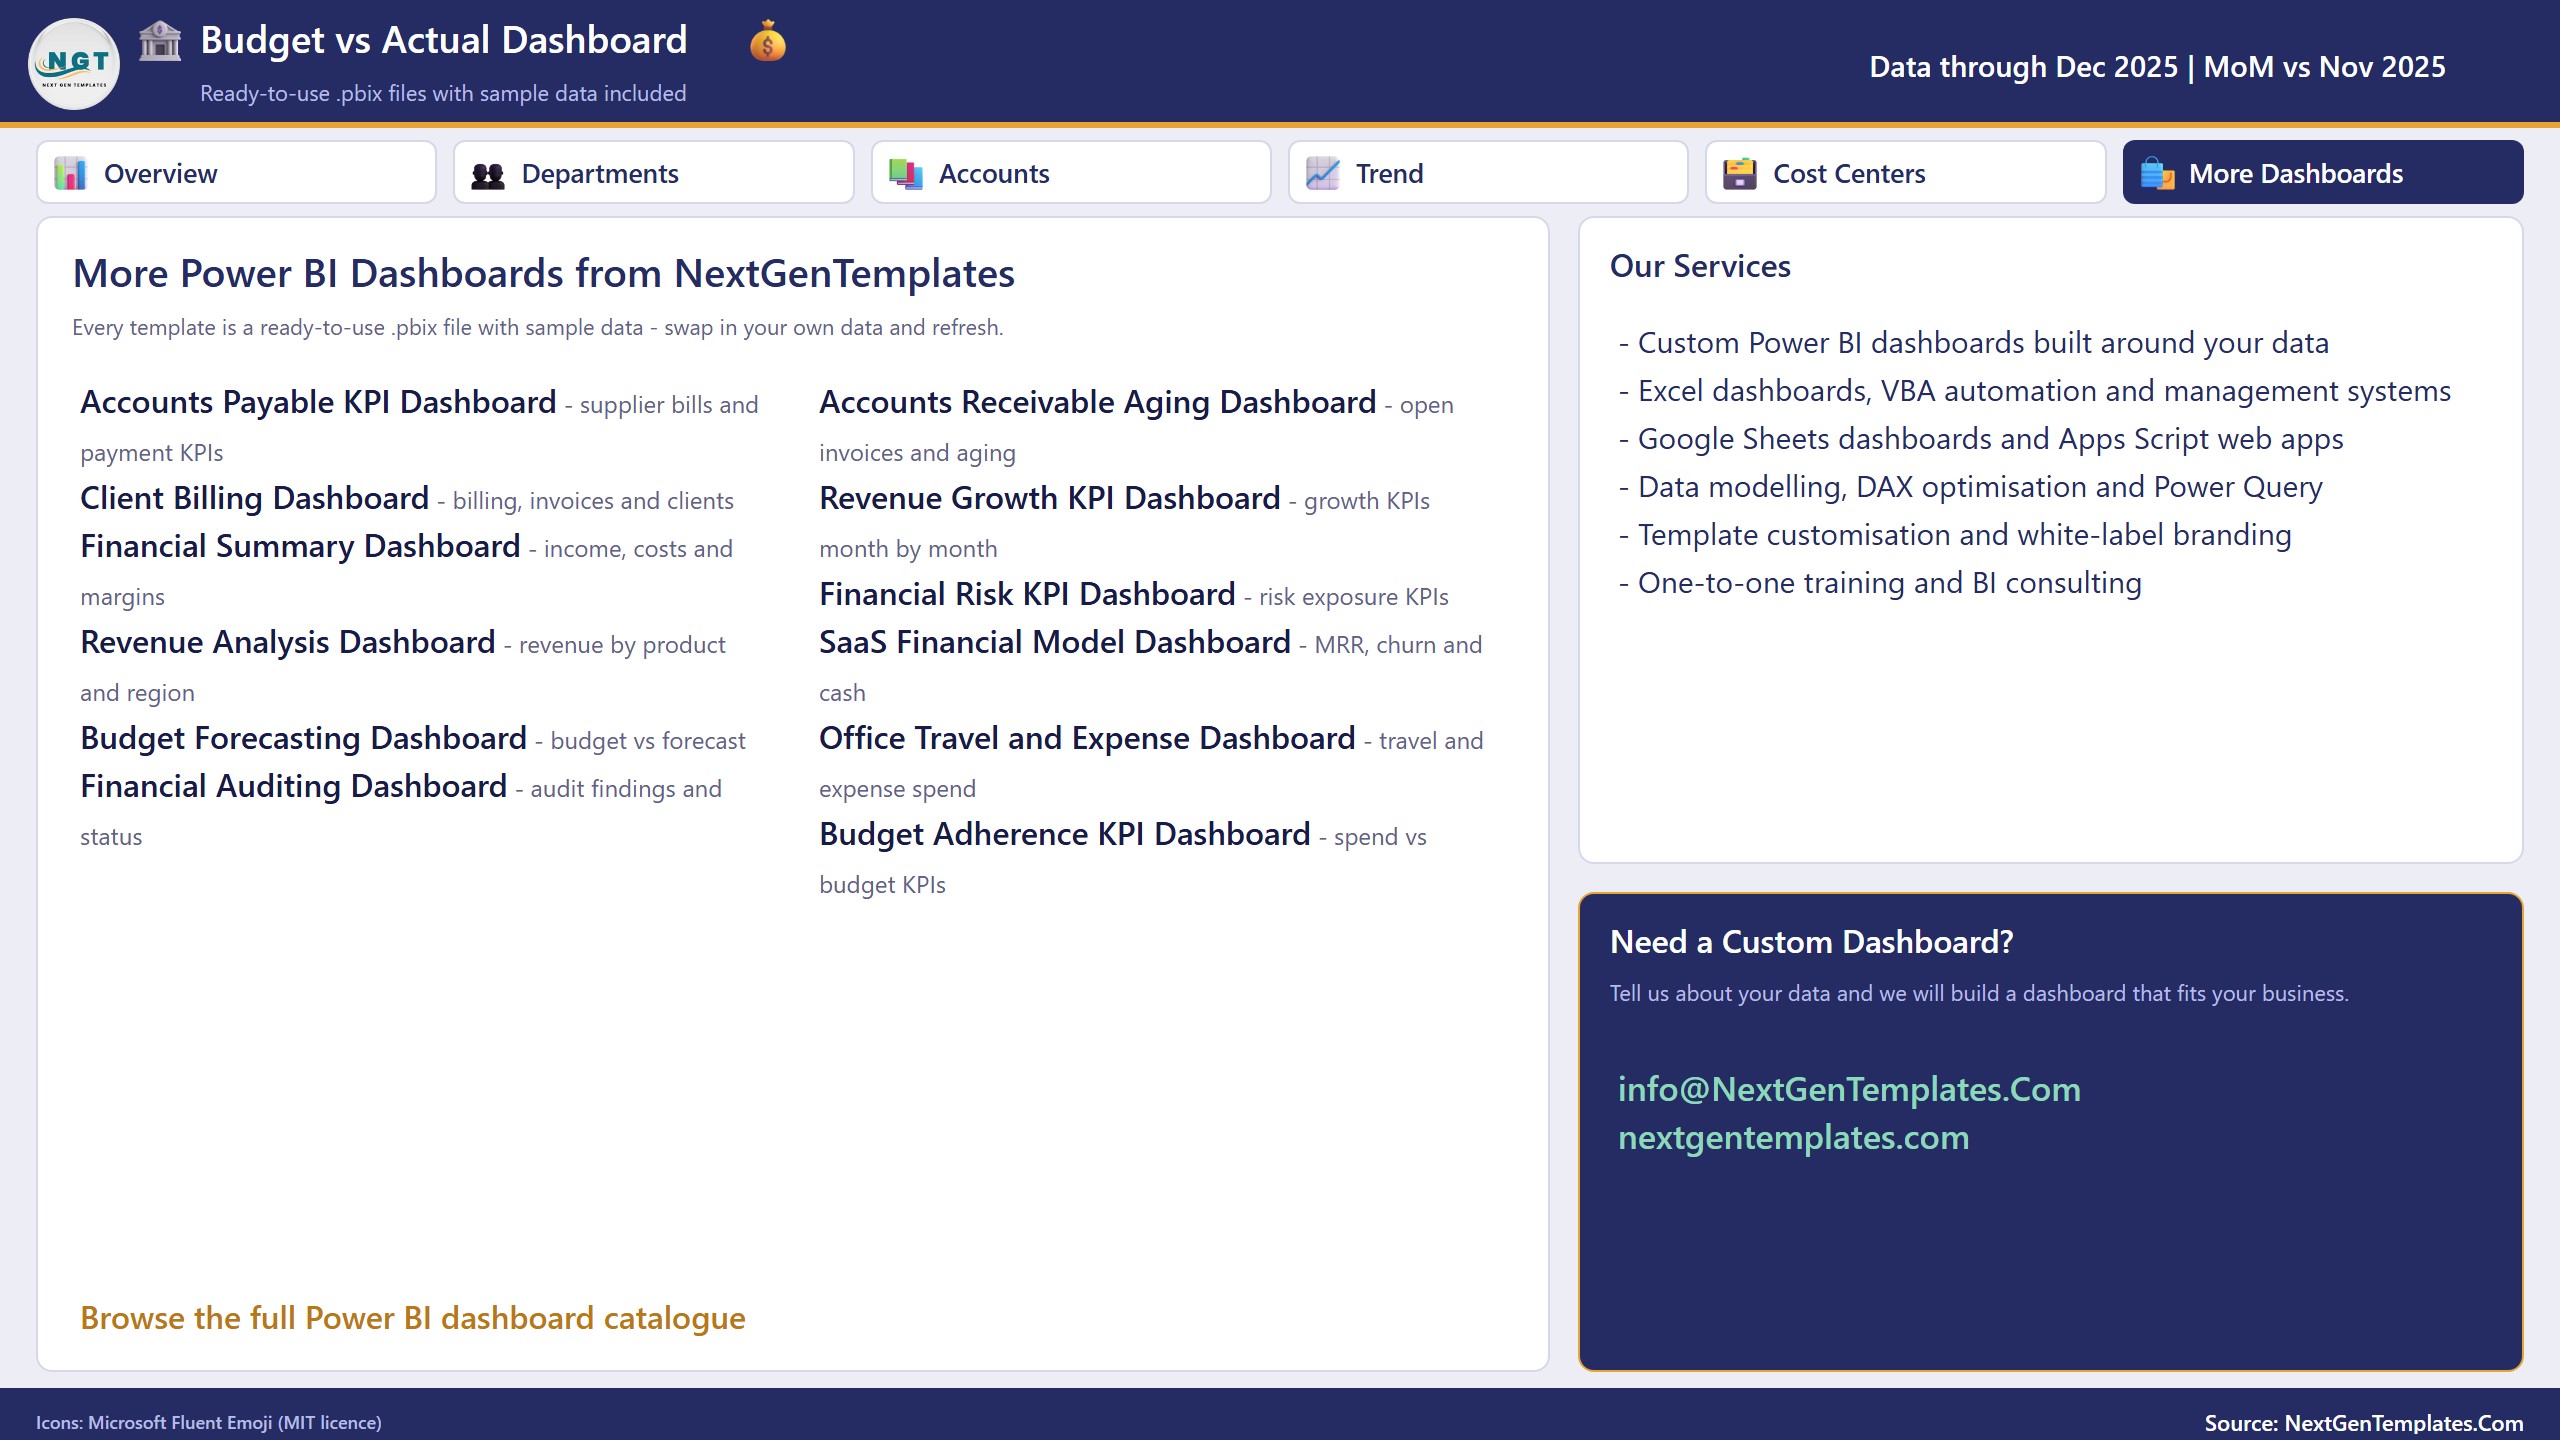

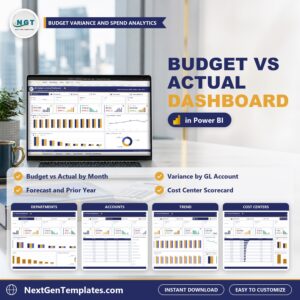
See where you are over or under budget. The Budget vs Actual Dashboard in Power BI puts your budget and your real spend side by side by department, cost center, GL account and location. Add your budget lines to the Excel data file, click Refresh in Power BI, and every card and chart updates.
Watch the Budget vs Actual Dashboard in Power BI walkthrough
Good to know: this is an add-data-and-refresh template, not a live connector to your accounting software. It needs Power BI Desktop (free). The sample data is fictional.
What You Get
- A Power BI .pbix file with Overview, Departments, Accounts, Trend and Cost Centers pages
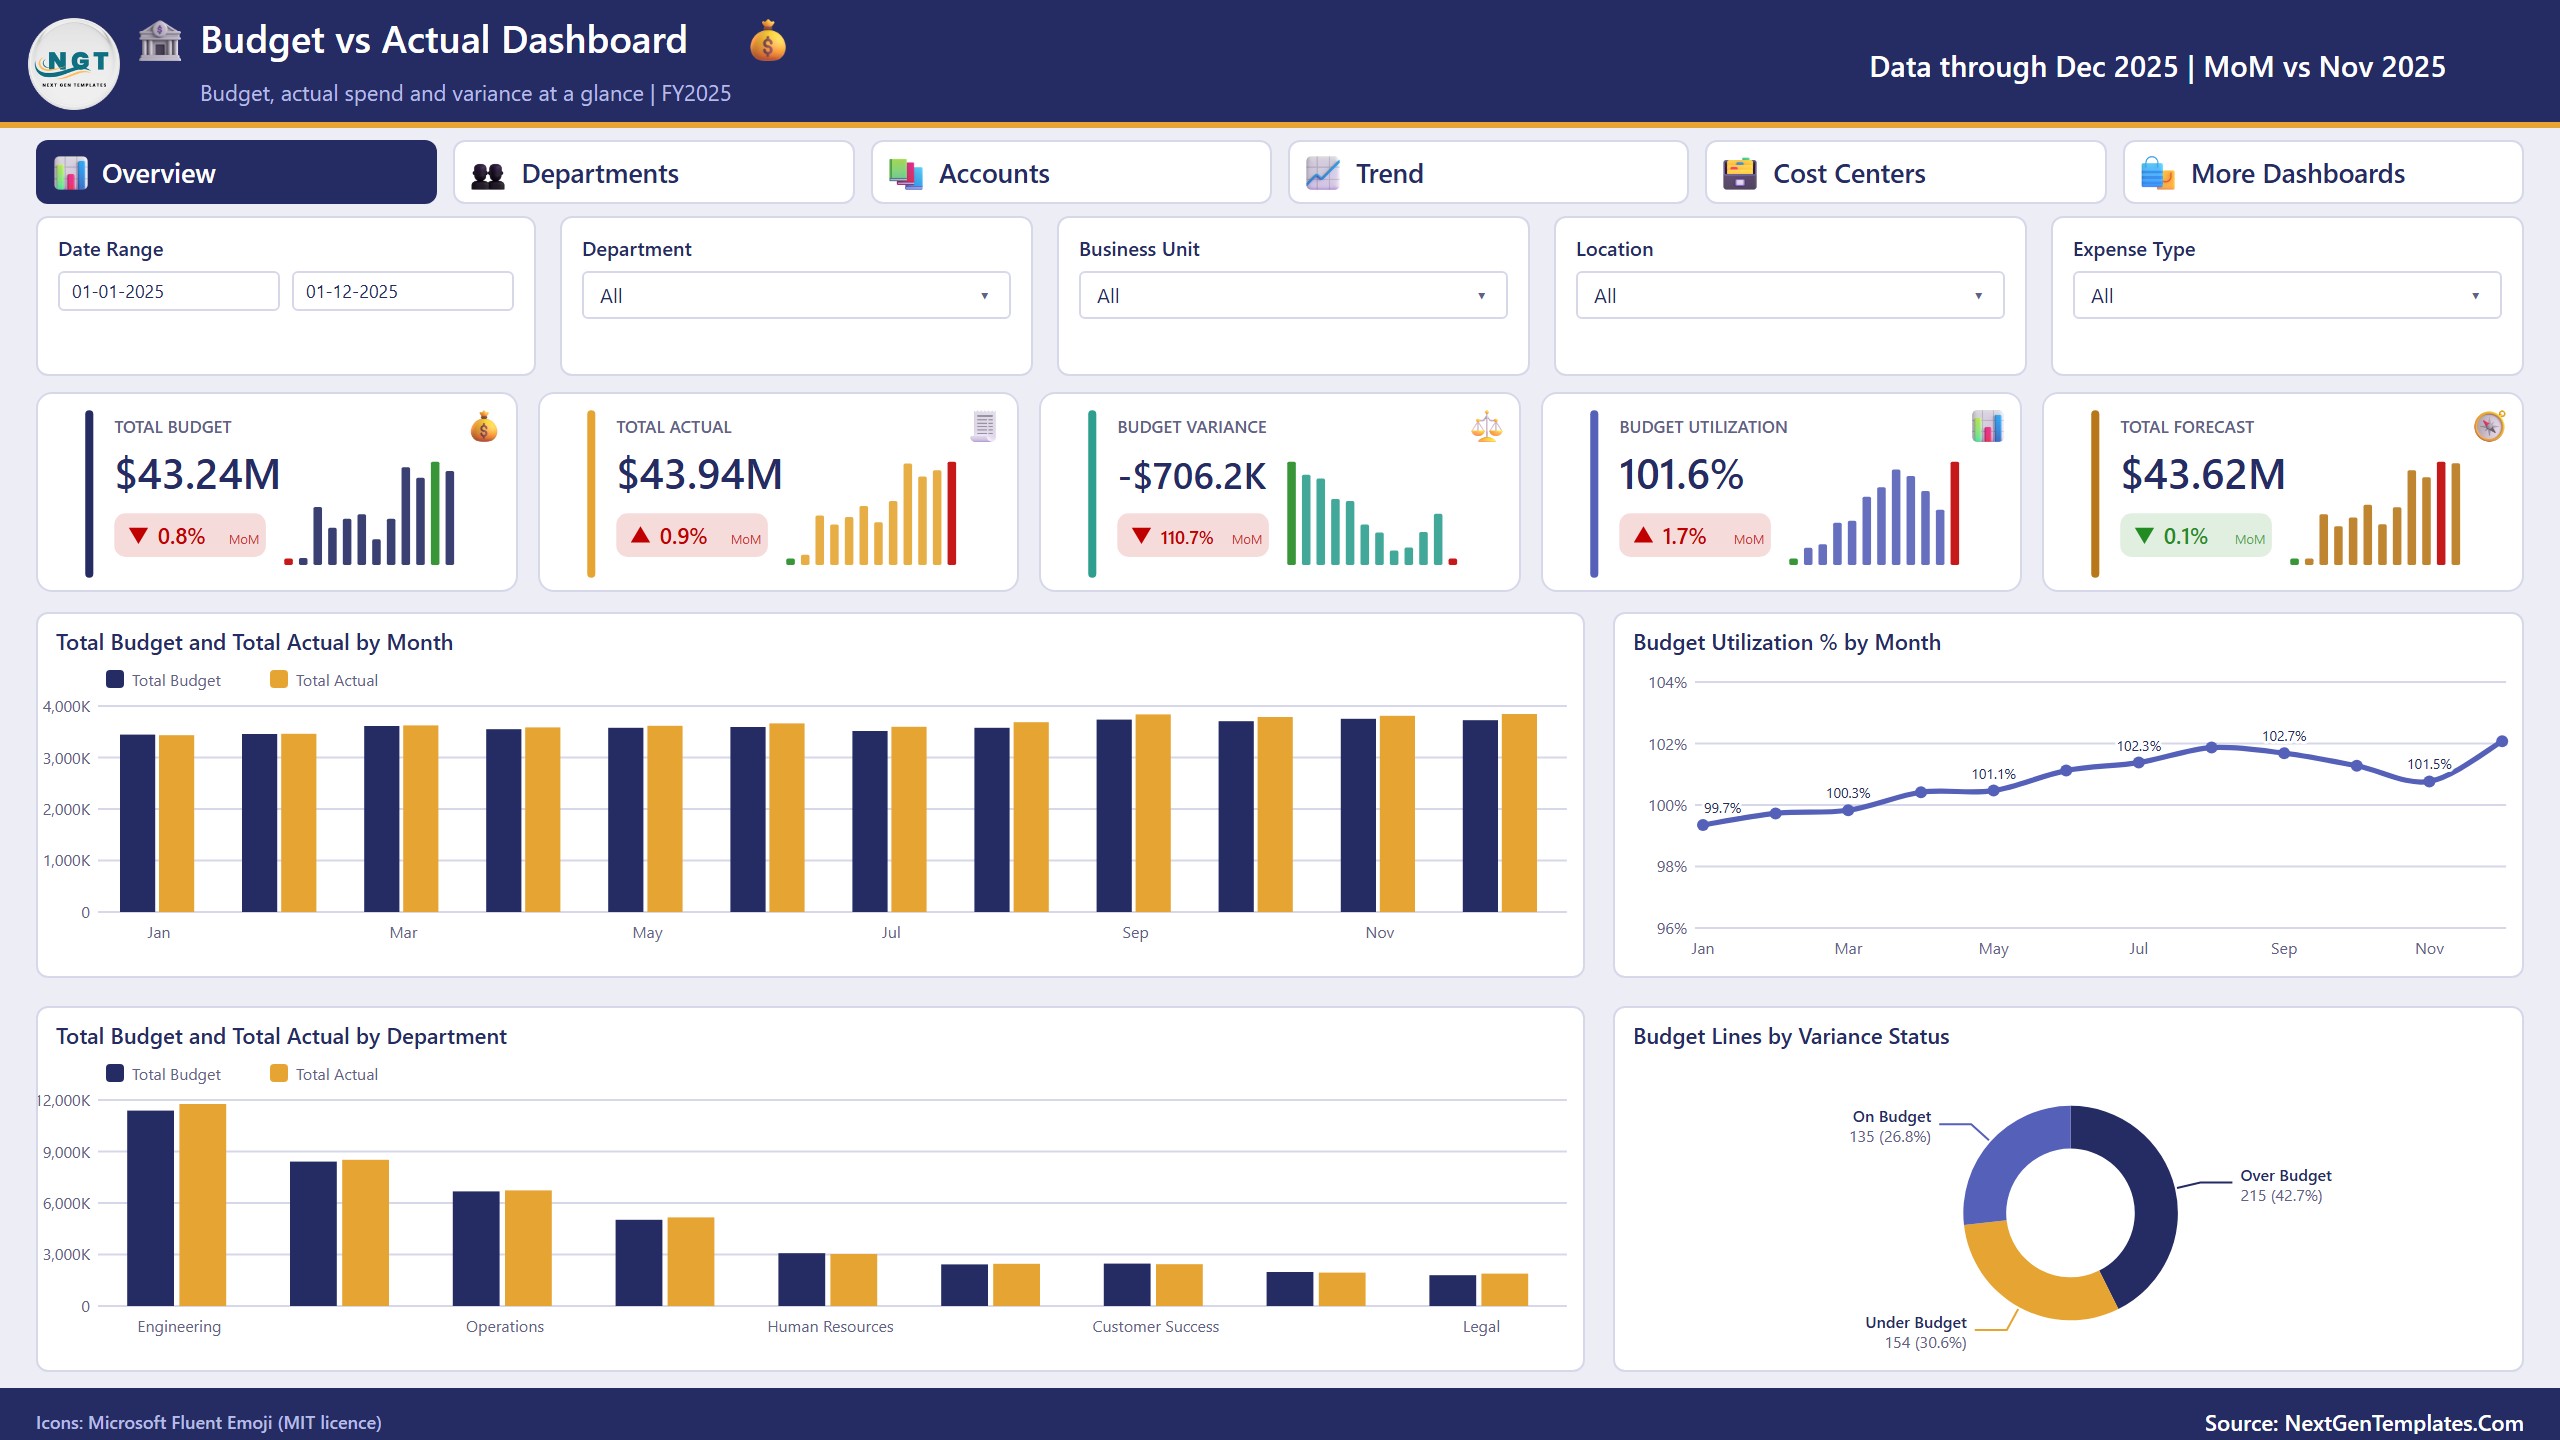
- Cards for Total Budget, Total Actual, Budget Variance, Budget Utilization and Total Forecast, with month-over-month change
- A GL account variance scorecard and a cost center budget scorecard
- Right-click drill-through to a Details page with every budget line behind a number
- 5 synced filters on every page: date range, department, business unit, location and a page-specific filter
- An Excel data file with 504 sample budget lines, plus a user manual (PDF)
Key Features
Overview Page
Total Budget, Total Actual, Budget Variance, Budget Utilization and Total Forecast cards with month-over-month change and trend columns, budget vs actual by month, utilization by month, budget vs actual by department and budget lines by variance status.
Departments Page
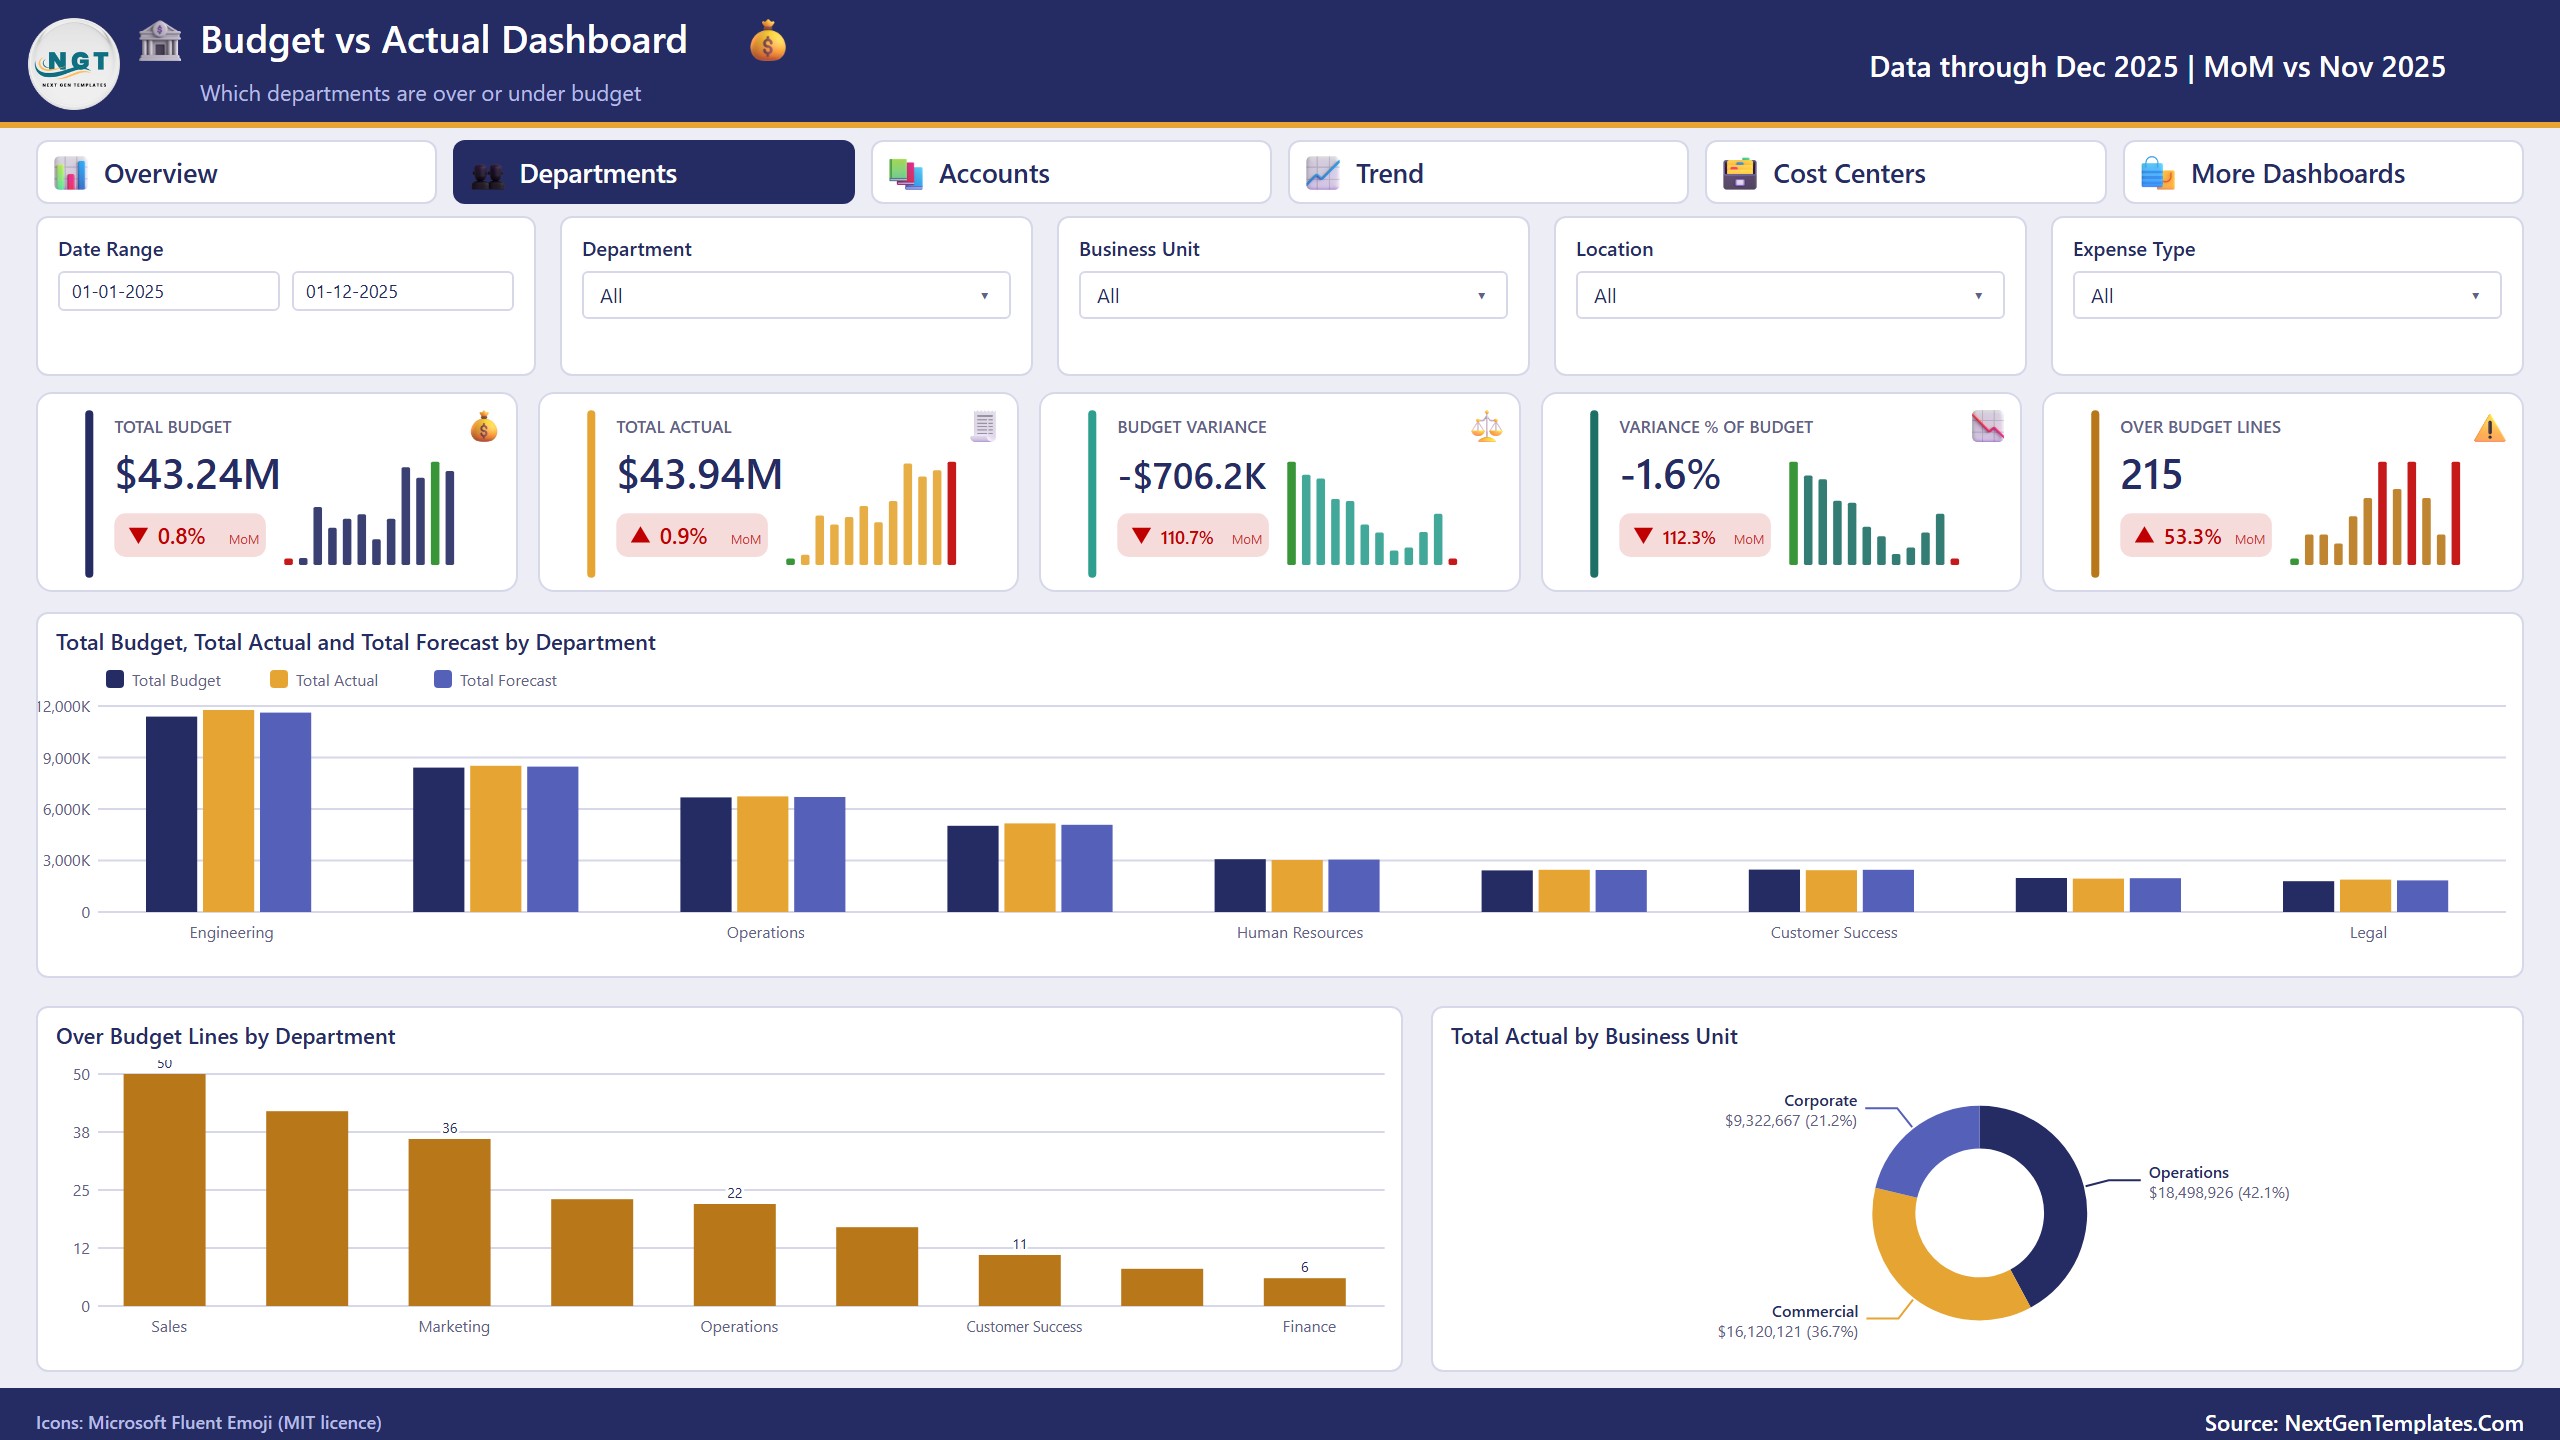
Budget, actual and forecast by department, over budget lines by department and actual spend by business unit.
Accounts Page
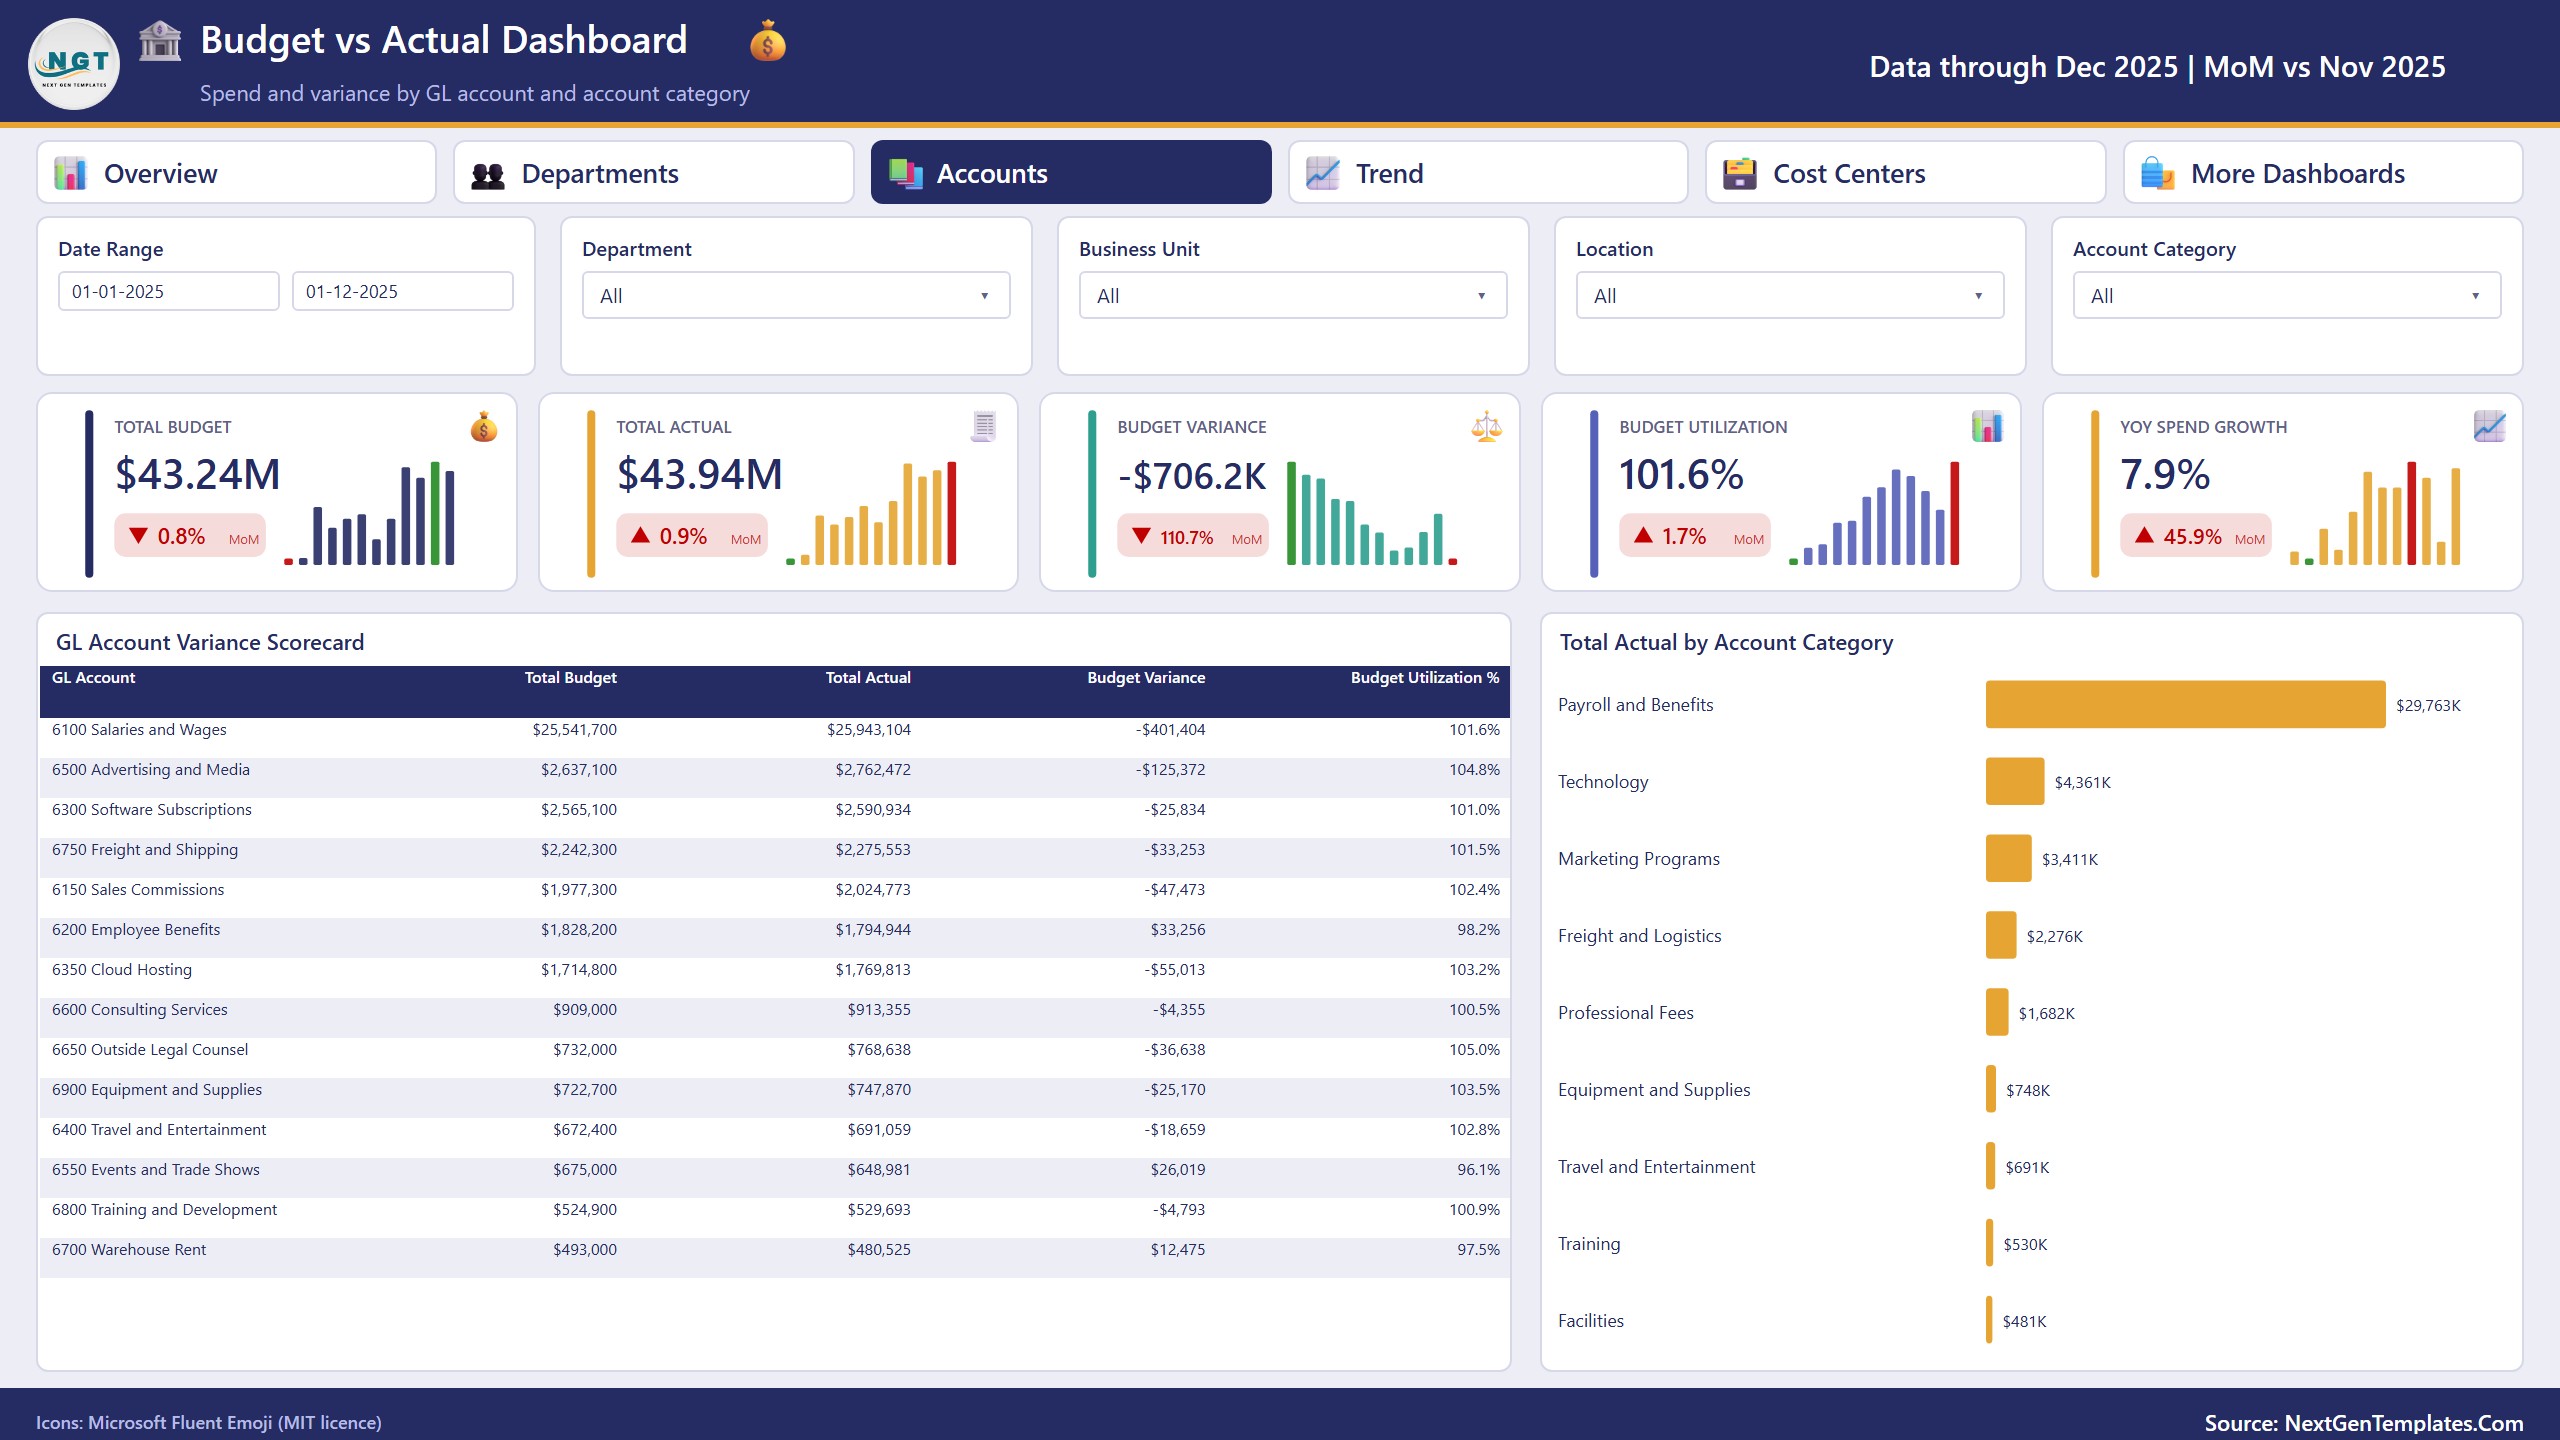
A GL account variance scorecard and actual spend by account category.
Trend Page
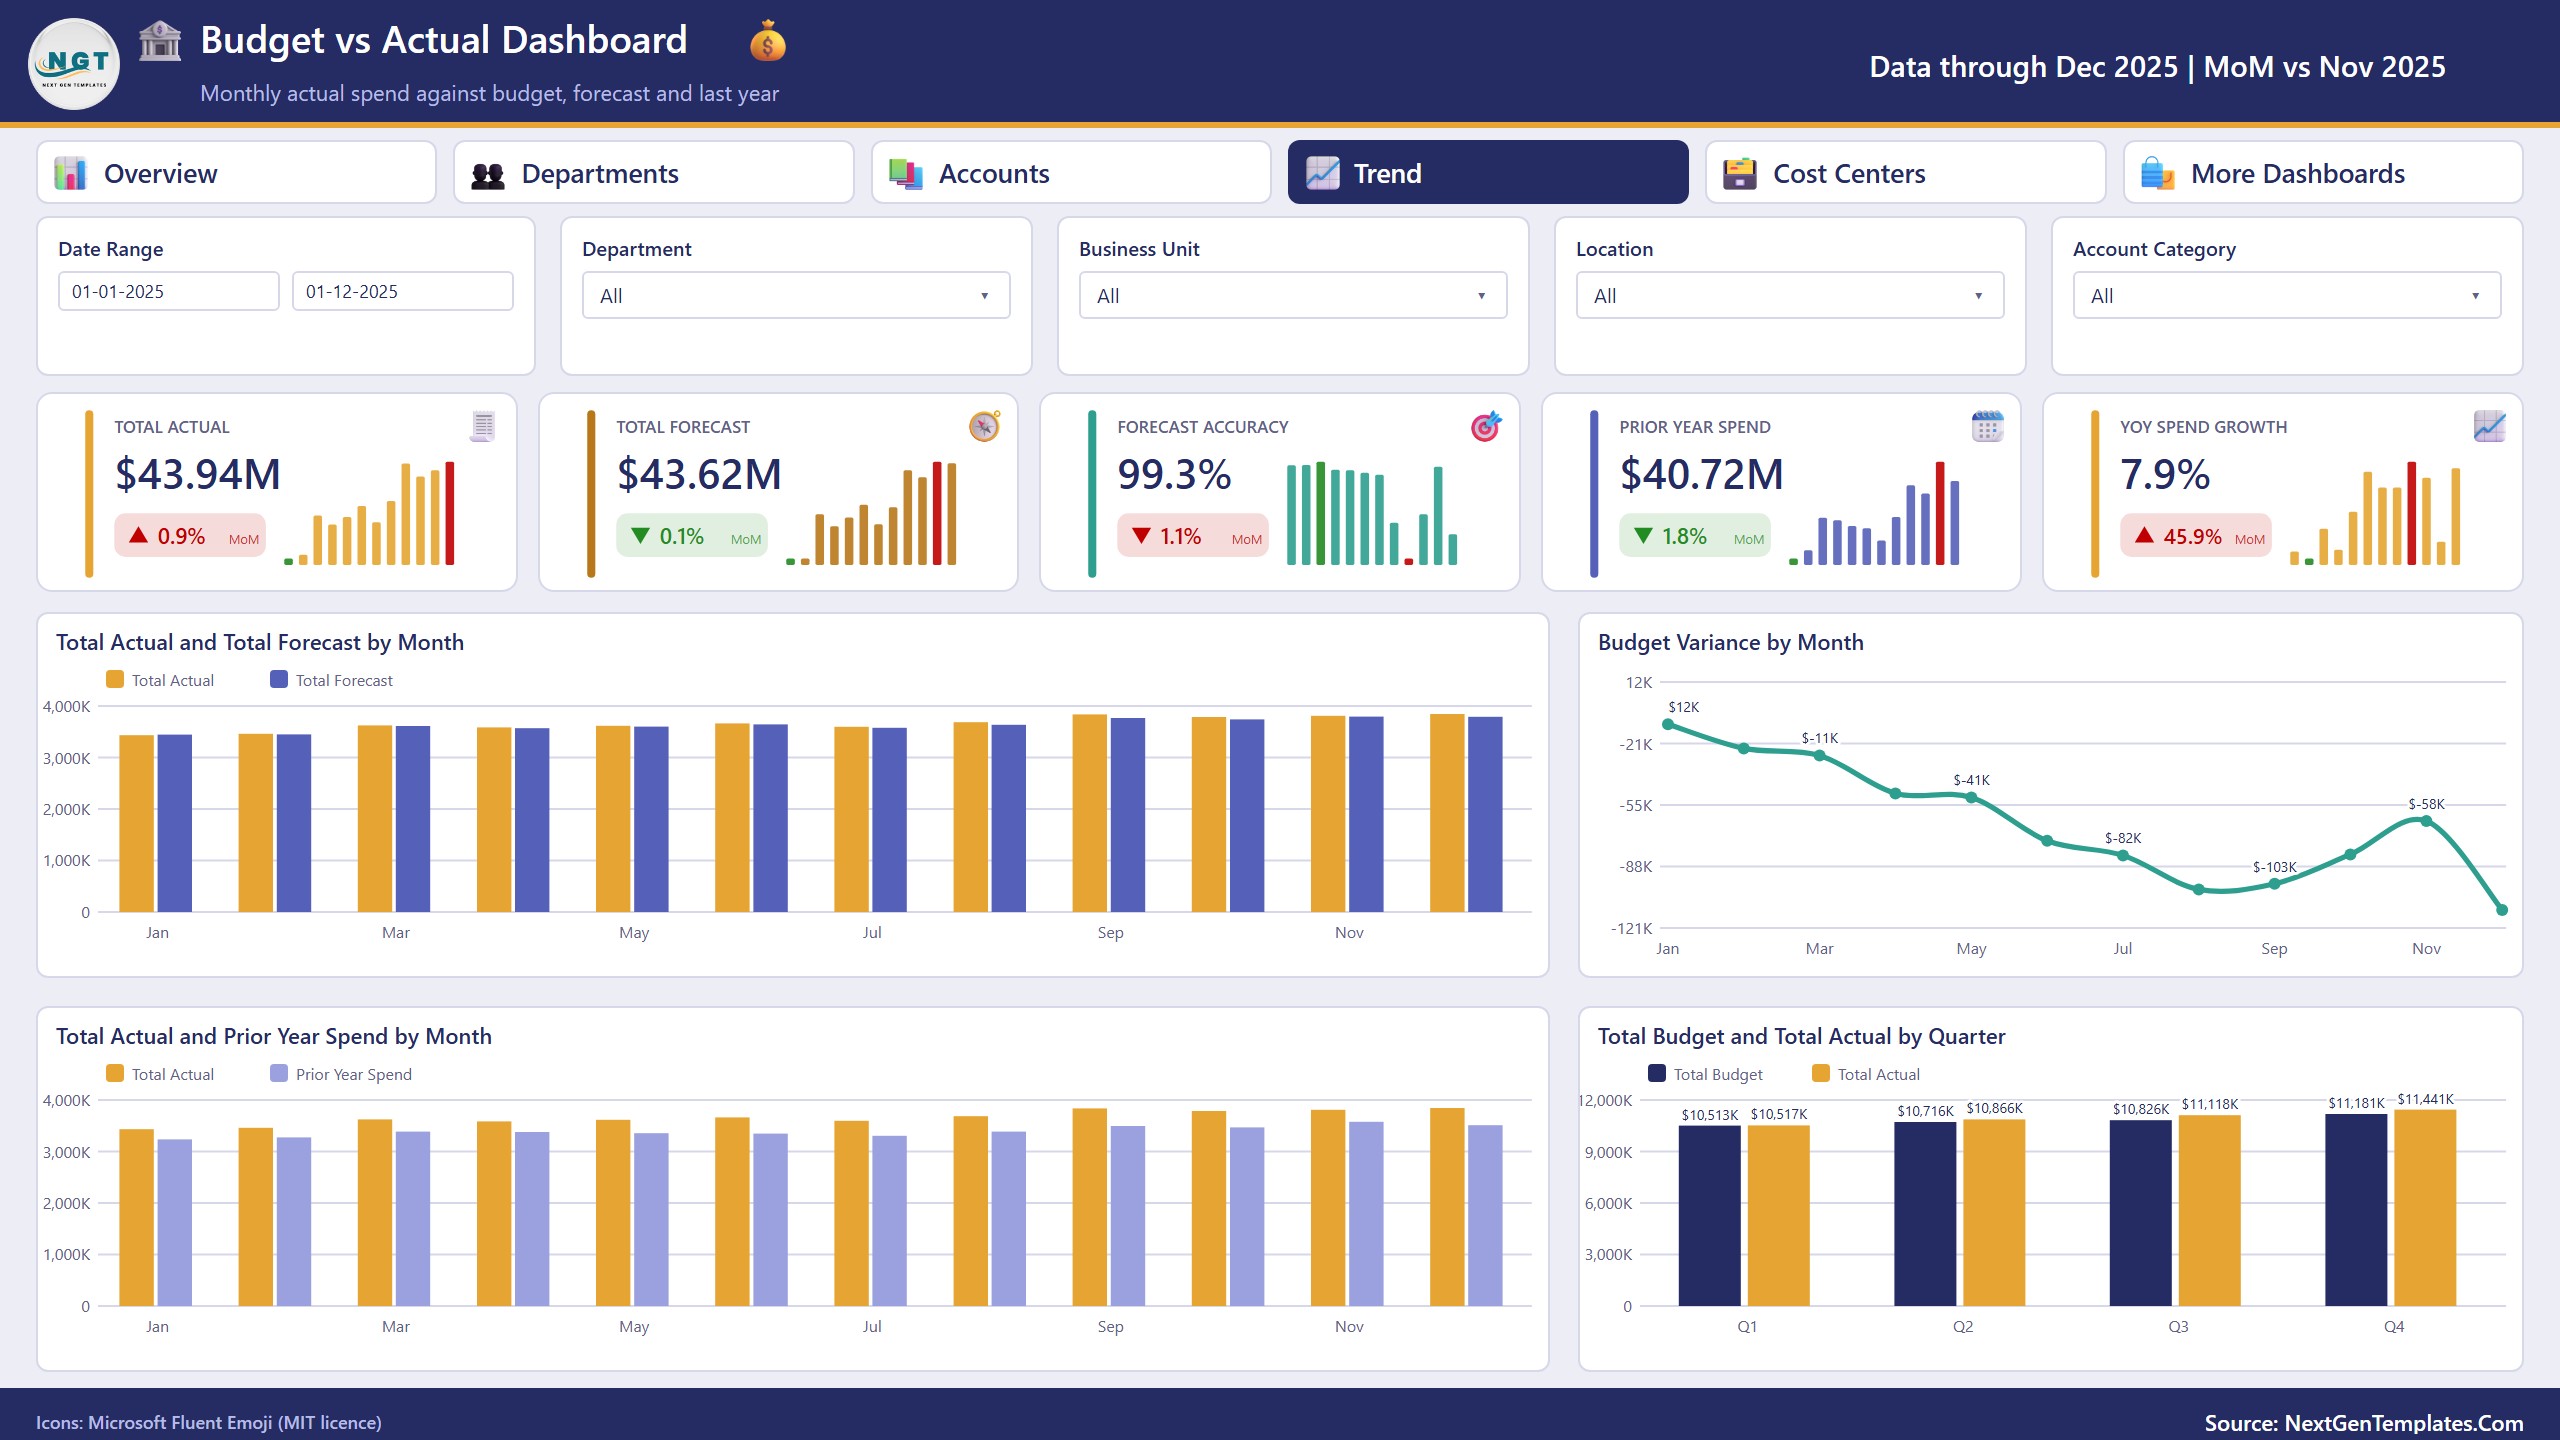
Actual vs forecast, budget variance by month, actual vs prior year and budget vs actual by quarter.
Cost Centers Page
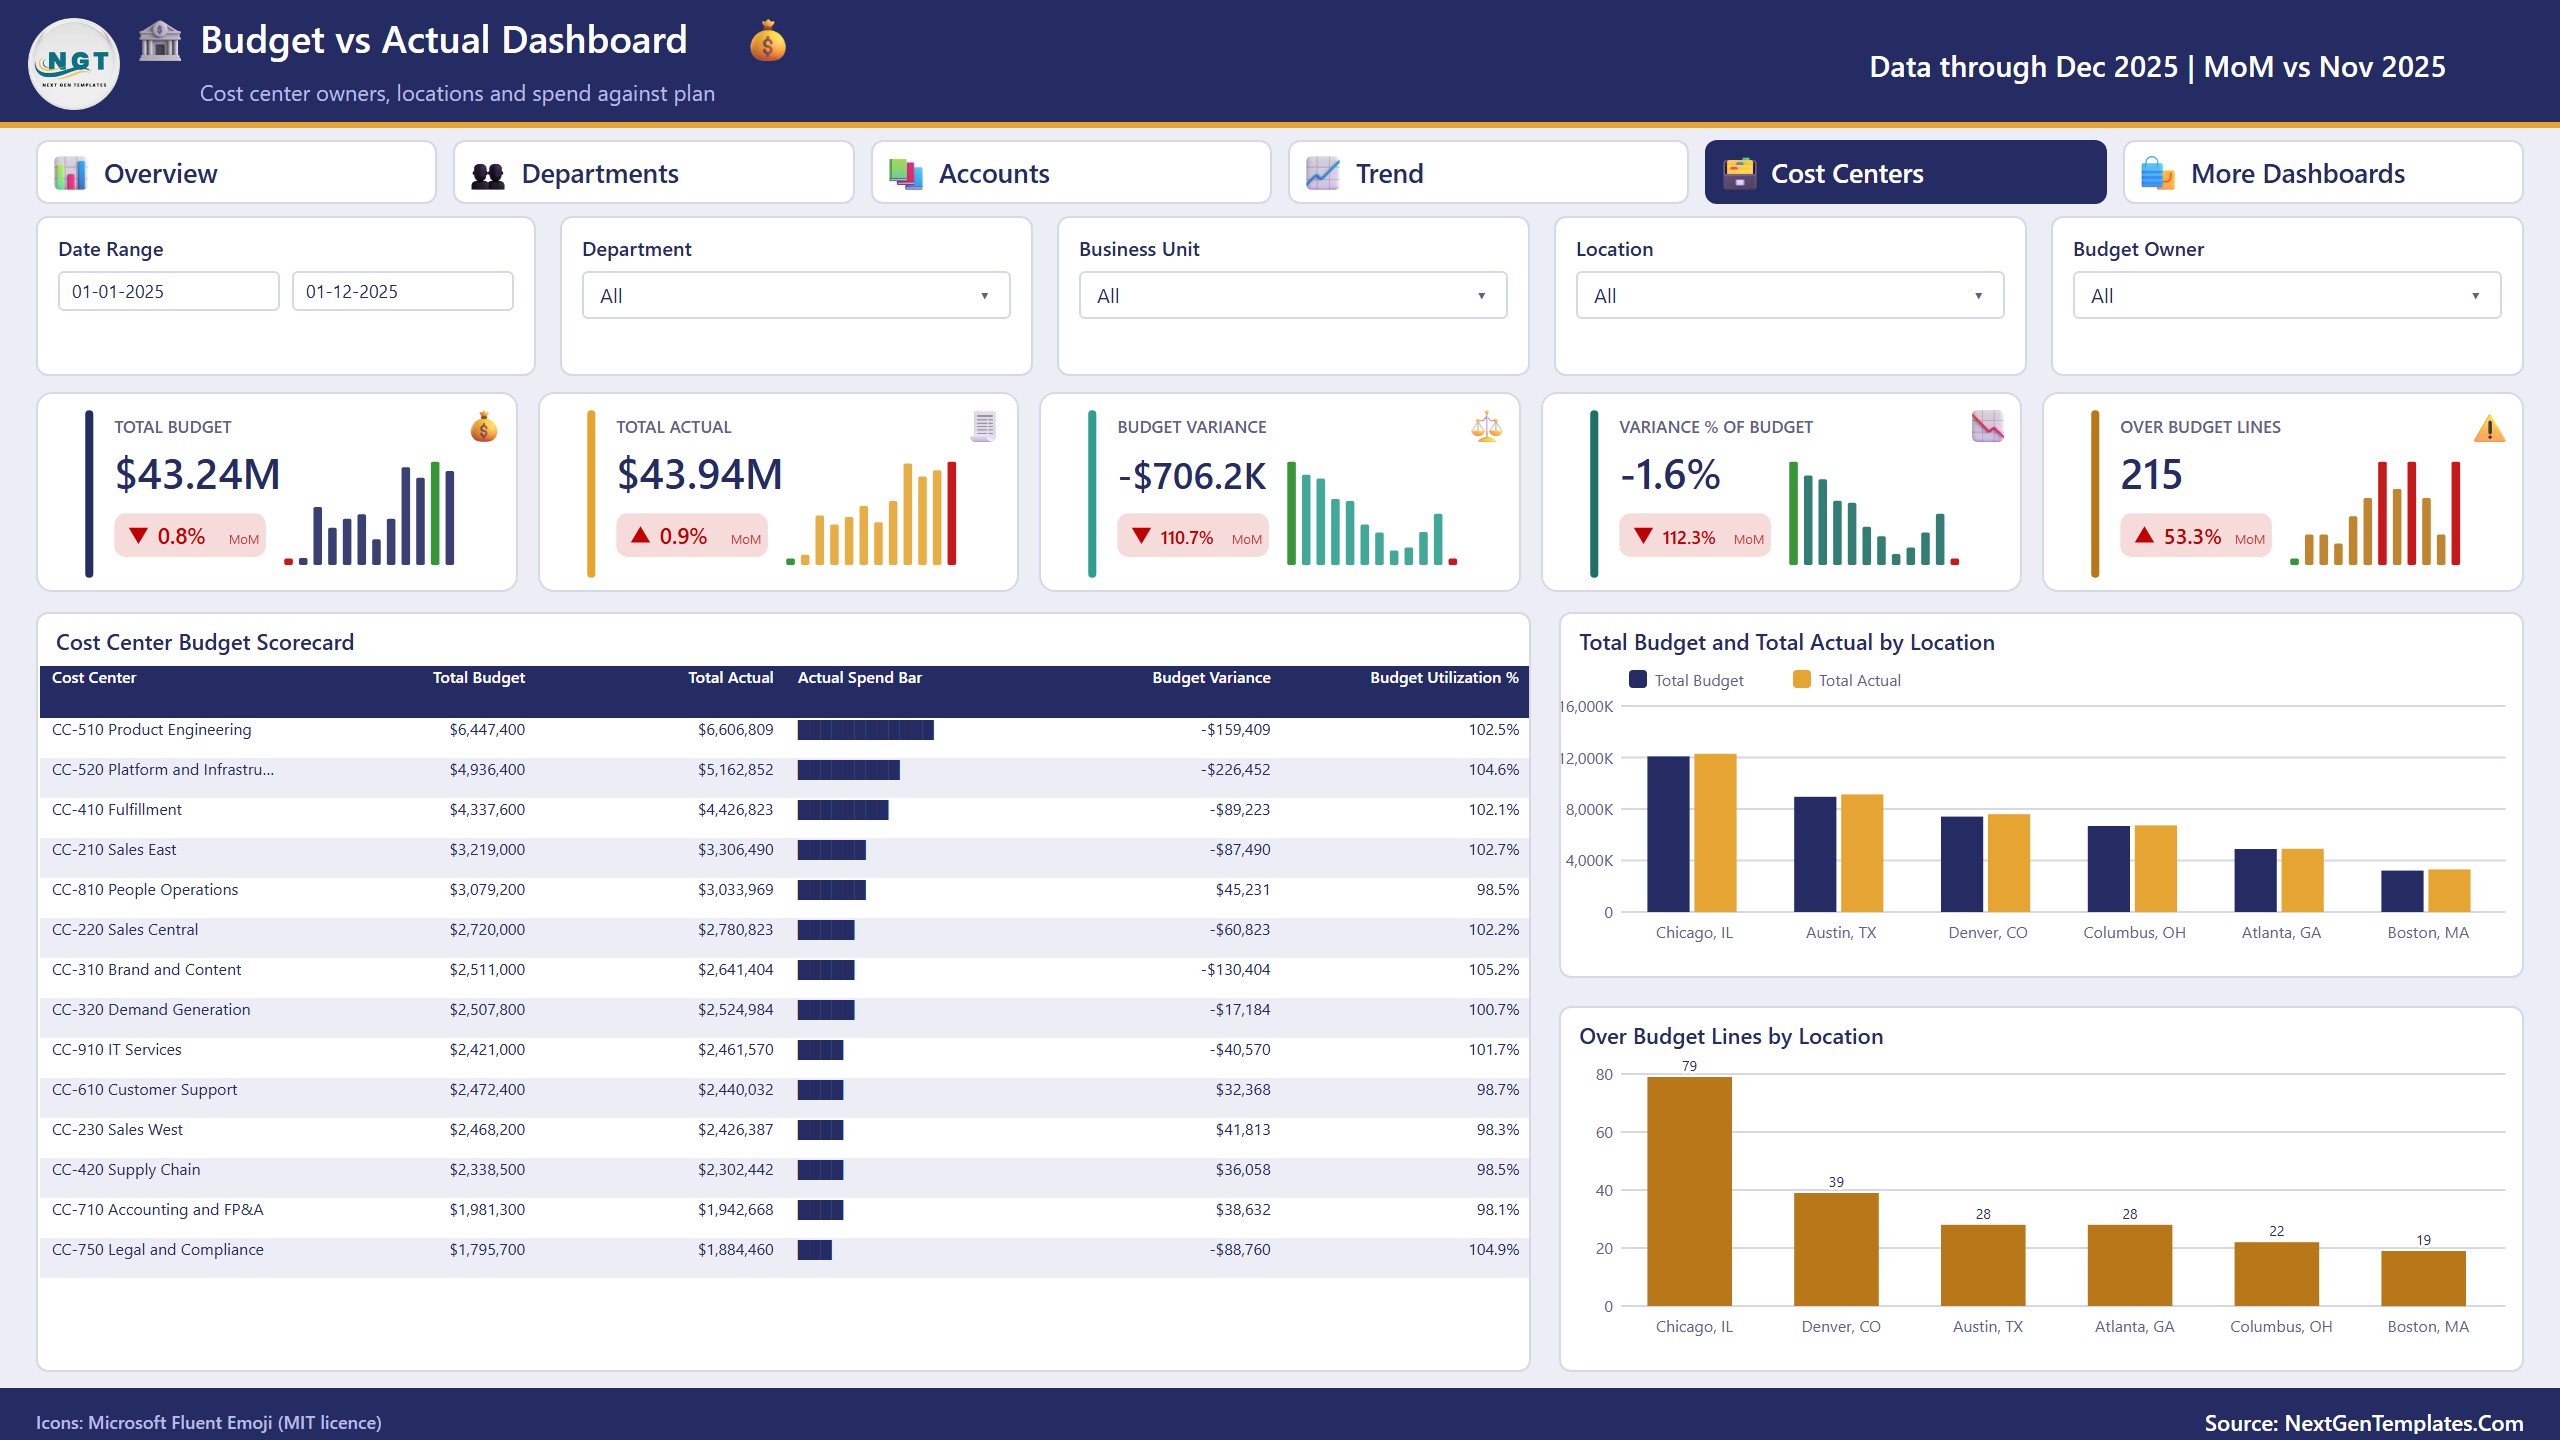
A cost center budget scorecard, budget vs actual by location and over budget lines by location.
Who Is It For?
Finance managers, FP&A analysts, controllers, department heads and business owners who run a monthly budget review. It also suits accountants who report budget variance for clients.
How to Use
- Download the ZIP and unzip it. It holds the .pbix file, the Excel data file and the user manual.
- Add your budget lines to the Excel data file.
- Open the .pbix file in Power BI Desktop and click Refresh.
- Use the five filters to focus on a department, business unit or location.
- Right-click any number and choose Drill through to see the budget lines behind it.
Comparison
| Feature | This dashboard | Plain budget sheet |
|---|---|---|
| Variance and utilization % | Cards and charts | Manual formulas |
| Budget vs actual by department, account and location | Charts and filters | Build yourself |
| Actual vs forecast and prior year | Trend page | Build yourself |
| Drill-through to budget lines | Right-click | Scroll and search |
| Live link to accounting software | No | No |
Frequently Asked Questions
Does it connect to my accounting software?
No. It is an add-data-and-refresh template. Add your budget lines to the Excel data file that comes in the ZIP, click Refresh in Power BI, and every card and chart updates. There is no live link to QuickBooks, Xero, SAP or any other system.
Do I need Power BI Pro?
No. Open the .pbix file in Power BI Desktop, which is free. Publishing to the Power BI service is optional and is your choice.
What does one budget line hold?
Each of the 504 sample rows holds a period, department, business unit, location, GL account, cost center, expense type, budget, actual and forecast amount. Replace them with your own lines.
How does the drill-through work?
Right-click a department, account or month in a visual and choose Drill through to open the Details page with every budget line behind that number.
What does Budget Utilization show?
Actual spend divided by budget for whatever is in view. A value over 100% means you spent more than planned.
Is the sample data real?
No. The 504 budget lines in the Excel file are fictional. Replace them with your own and click Refresh.
Can I keep real financial data in it?
Yes, but a Power BI file is only as private as where you store and share it. Keep your copy somewhere access-controlled and share it with named people only.
Get the Dashboard
Download the Budget vs Actual Dashboard in Power BI and run your budget review on one screen. To track what customers owe, see the Accounts Receivable Aging Dashboard in Power BI. Prefer a workbook? Try the Budget vs Actual Dashboard in Excel, or browse all Power BI templates.









Reviews
There are no reviews yet.