

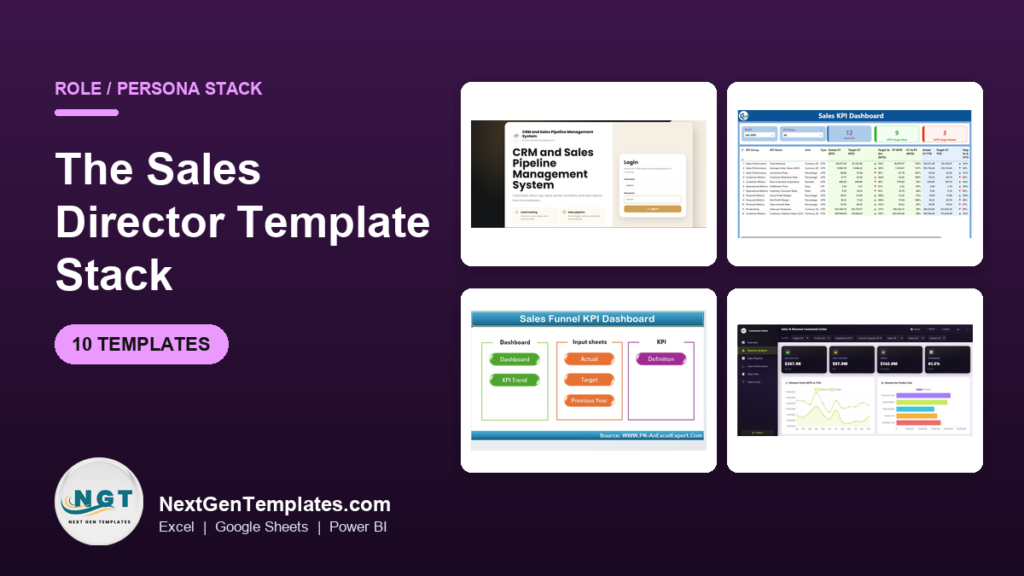
A sales director dashboard template stack needs four jobs covered: plan, track, report and present. The Sales and Revenue Command Center Dashboard in HTML ($12.99) is the best single starting point, and nine other Excel, Google Sheets and Power BI templates, priced from $6.99 to $39.99, fill the gaps.
Last updated: October 2026
Key takeaways
- The Sales and Revenue Command Center Dashboard in HTML costs $12.99 and gives a sales director 5 pages and 5 KPI cards (Total Revenue, Total Deals, Win Rate, Pipeline Value, Attainment).
- The full 10-template stack costs $155.90 one-time, which is less than a single month of per-seat pricing for many sales SaaS tools with several users.
- The CRM and Sales Pipeline Management System Web App ($39.99) is the most expensive item and the only one with 28 connected screens, 16 reports and an audit log.
- The cheapest tools are the Sales Performance Management Dashboard in Google Sheets and the Sales Commission Template, both $6.99.
- A 30-day rollout is realistic: plan in week 1, track in week 2, report in week 3, present in week 4.
 Launch offer
From your first Pivot Table to the Data Model, DAX, Power Query and a one-page KPI dashboard. 11h 51m of video by PK, with practice files, quizzes and a capstone.
Sales director dashboard templates compared
| Template | Format | Best For | Price |
|---|---|---|---|
| 1. Sales and Revenue Command Center Dashboard (Best overall) | HTML | Weekly leadership view | $12.99 |
| 2. CRM and Sales Pipeline Management System Web App (Best value for depth) | Web app (Google Sheets and Apps Script) | Replacing a CRM | $39.99 |
| 3. Sales Funnel KPI Dashboard | Excel | Funnel conversion | $14.99 |
| 4. Sales Tracking Dashboard | Excel (macro-enabled) | Net sales by rep and region | $17.99 |
| 5. Channel Sales KPI Dashboard | Excel | Channel and partner sales | $14.99 |
| 6. Sales Performance Management Dashboard | Google Sheets | Target vs actual by rep | $6.99 |
| 7. Sales KPI Dashboard | Power BI | Win rate and pipeline health | $11.99 |
| 8. Sales KPI Dashboard | Google Sheets | Regional comparison | $12.99 |
| 9. Sales and Marketing Resource Allocation KPI Dashboard | Excel | Budget and headcount planning | $14.99 |
| 10. Sales Commission Template with Bonus Amount | Google Sheets | Commission and bonus payouts | $6.99 |
How we picked these
We searched the NextGenTemplates sales catalog for templates a sales director would open every week, not a rep or a marketer. Each one had to be a paid, finished tool with a clear sales job: planning, tracking, reporting or presenting.
We excluded free files, generic finance templates and anything where sales was a side feature. We also made sure the stack covers Excel, Google Sheets, Power BI and HTML so you can pick the format your team already uses. No bundle covers this exact role, so the stack is built from single templates.
What is the best sales director dashboard template stack for 2026?
The stack below is grouped by the four jobs a director does: plan the number, track the pipeline, report to the team and present to the board. Start with the first entry, then add only the jobs you do not already cover.
1. Sales and Revenue Command Center Dashboard in HTML: best overall
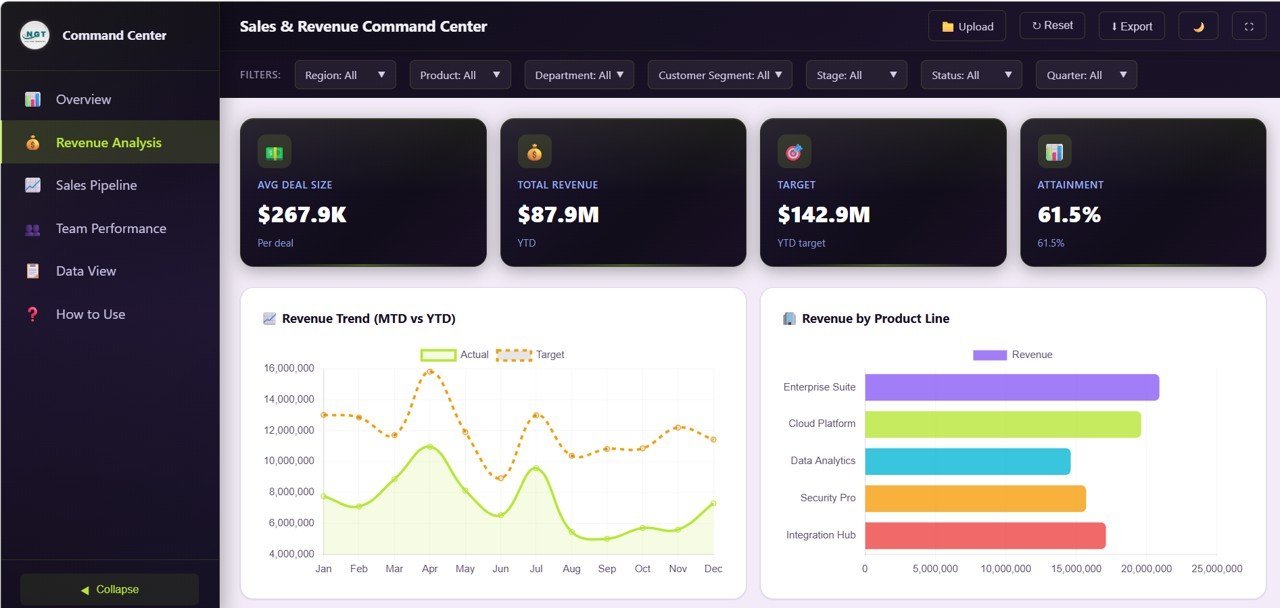
Group: present. This browser-based dashboard is written for sales directors, revenue operations managers and VPs of sales. Open the HTML file in a modern browser and there is nothing to install.
Who it is for: directors who need one screen for the Monday leadership meeting.
- 5 interactive pages: Overview, Revenue Analysis, Sales Pipeline, Team Performance and Data View
- 5 KPI cards: Total Revenue, Total Deals, Win Rate, Pipeline Value, Attainment
- Revenue trend MTD vs YTD, revenue by product line, average deal size by quarter
- Pipeline by stage, pipeline by close month, top deals by value
Use cases: check attainment before a forecast call; compare revenue by region in the Overview; sort top deals by value to decide which three get executive sponsorship; use the Data View to validate a number someone challenges.
Price: $12.99. Get the Sales and Revenue Command Center Dashboard in HTML.
Best for: the one dashboard a director opens first, at the lowest cost per page.
2. CRM and Sales Pipeline Management System Web App: best value for depth
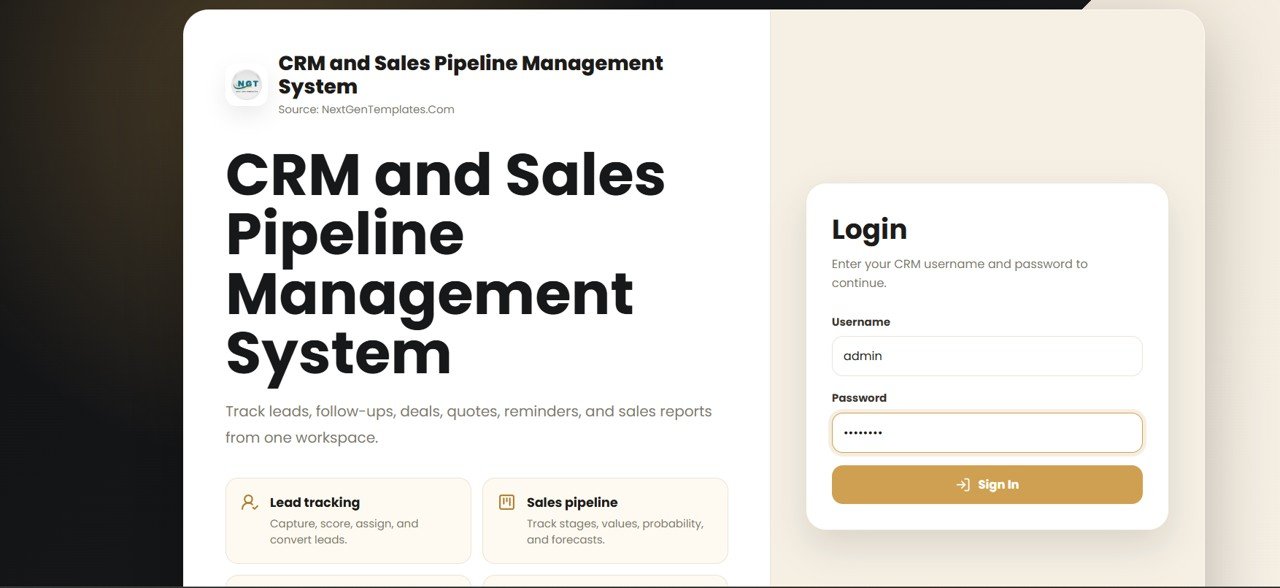
Group: track. Version 2.0 has 28 connected screens, 28 linked tables, 16 reports and a dashboard of 12 live KPI tiles. It runs on Google Sheets and Google Apps Script, so the data stays in your own Google Drive.
Who it is for: directors of small and mid-size teams who want a CRM they own instead of renting seats.
- Leads, Contacts, Accounts, Deals, a Pipeline Board, Quotes, Campaigns and Sales Targets
- A change log on every row showing who changed what, with old and new values
- A Deal History flow chart with days spent in each stage
- A seven-role permission map and an Audit Log
Use cases: open a stalled deal and see how many days it sat in each stage; use the audit log when a rep disputes a record edit; set sales targets per rep; pull one of the 16 reports for a board pack.
Price: $39.99, one-time, no per-user fees. Get the CRM and sales pipeline management web app.
Best for: teams ready to drop a per-seat CRM for something they control.
3. Sales Funnel KPI Dashboard in Excel

Group: track. It follows leads, opportunities and conversions across every funnel stage, and shows conversion rates so the bottleneck is visible.
Who it is for: sales managers and directors who own both lead volume and close rates.
- Lead generation, qualification, opportunity stages and closed deals
- Stage-by-stage conversion rates
- Lead quality and opportunity analysis
- Customizable KPIs such as win rate, average deal size and sales cycle time
Use cases: the formula is stage conversion = deals reaching next stage / deals in current stage. If 400 leads become 120 qualified (30%) and 24 close (20% of qualified), the weak spot is qualification, not closing. Review it monthly with marketing.
Price: $14.99. Get the Sales Funnel KPI Dashboard in Excel.
Best for: finding which funnel stage leaks the most.
4. Sales Tracking Dashboard in Excel
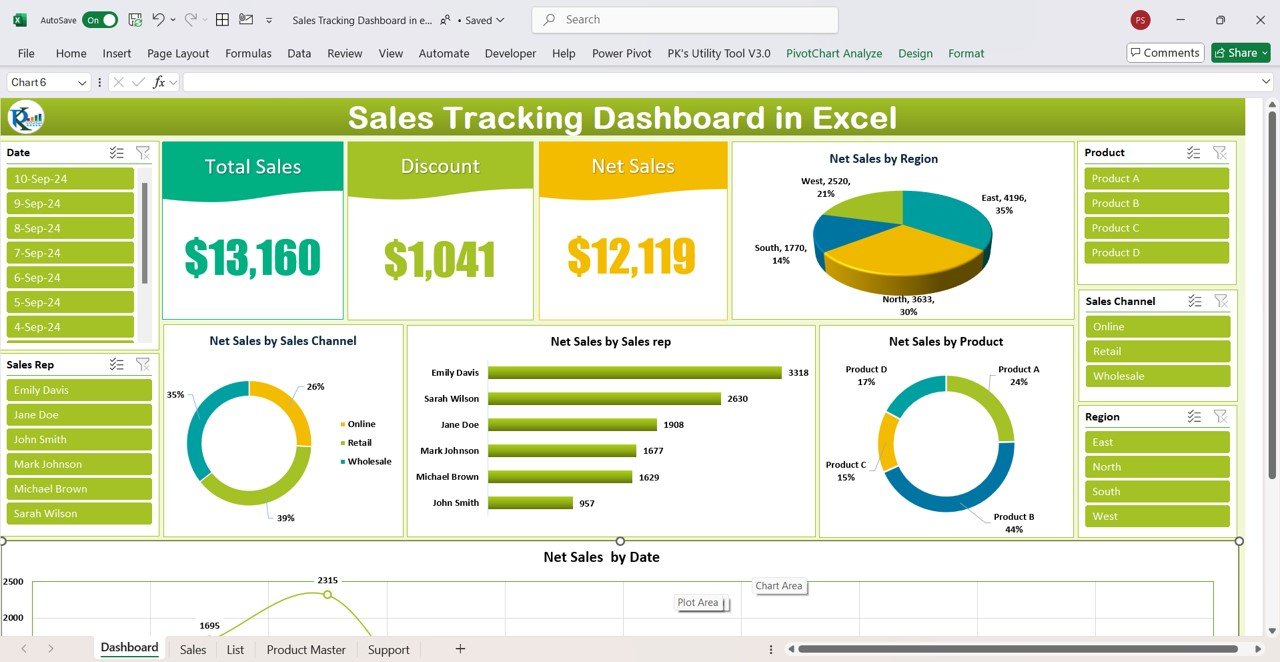
Group: track. A macro-enabled (VBA) workbook that tracks total sales, discounts and net sales by region, product, channel (online, retail, wholesale) and sales rep.
Who it is for: directors whose sales data lives in Excel and who want entry forms instead of loose rows.
- Forms to add, update or delete sales records
- Slicers for region, product and rep
- Built-in pivot tables
- Charts for net sales and trends over time
Use cases: net sales = total sales minus discounts, so a rep who closes $100,000 with $12,000 in discounts shows $88,000. Use it to spot discount-heavy reps, compare online against wholesale, and settle rep rankings with one slicer click.
Price: $17.99. Get the Sales Tracking Dashboard in Excel.
Best for: tracking discounts against net sales by rep.
5. Channel Sales KPI Dashboard in Excel
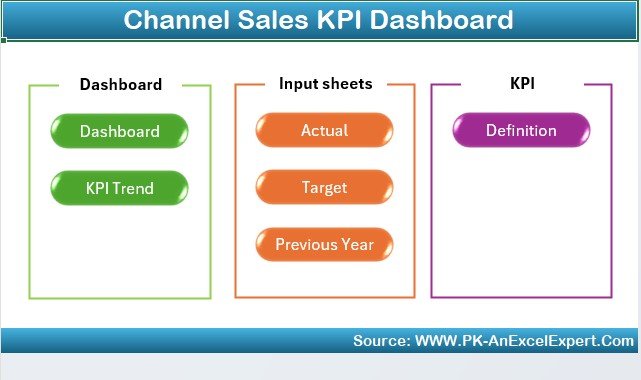
Group: plan. It compares revenue, sales volume and targets across channels such as online, retail and wholesale, and it suits distributors and partners.
Who it is for: directors who sell through more than one route to market.
- Revenue and volume by channel
- Actual vs target per channel
- Comparison across periods and regions
- Reports for internal or external presentations
Use cases: with a $2 million annual target split 50% online, 30% retail, 20% wholesale, the dashboard shows which channel is behind at mid-year so you can move budget. Share a channel view with a distributor at quarterly review.
Price: $14.99. Get the Channel Sales KPI Dashboard in Excel.
Best for: setting and tracking targets per channel.
6. Sales Performance Management Dashboard in Google Sheets
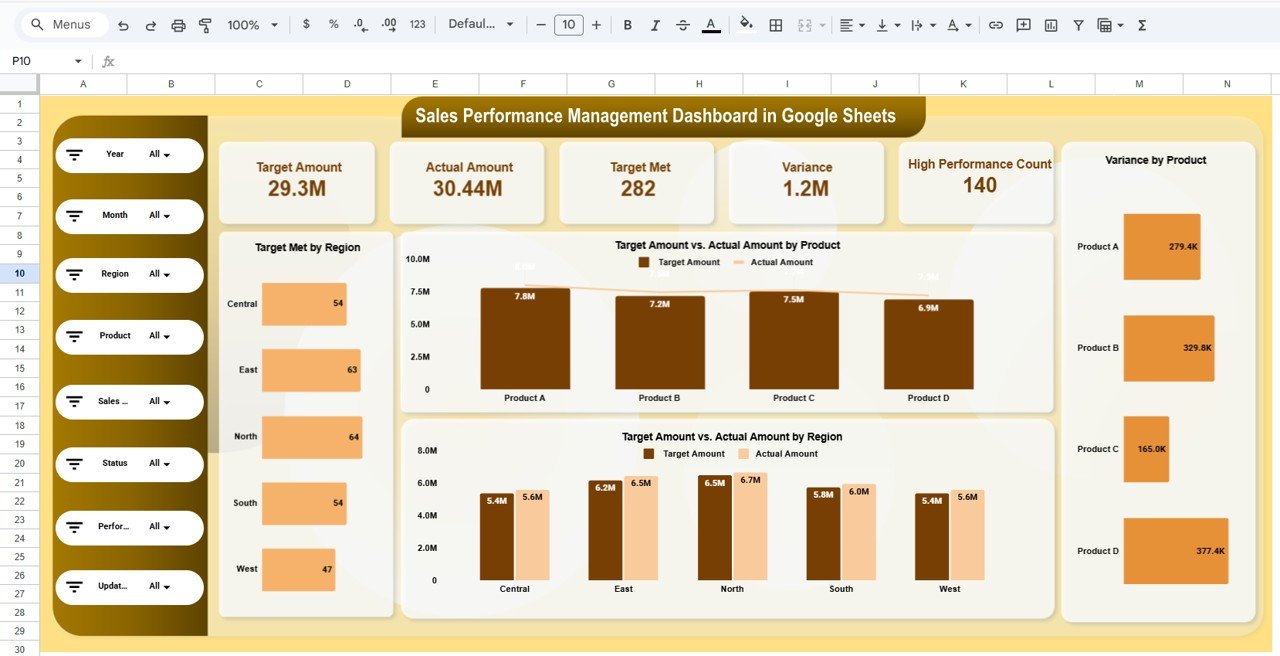
Group: report. It tracks targets, actuals and achievement status in one Google Sheets file, with KPI cards, charts, performance flags and slicers.
Who it is for: directors who run reviews with a shared, live file.
- Target vs actual with variance and Achieved / Not Achieved flags
- Product, region and sales rep analysis
- Monthly and yearly trends
- Detailed record search to validate transactions
Use cases: attainment = actual / target, so $85,000 against $100,000 is 85%. Flag every rep under 90% before the review, then check product mix to see why. The cheapest dashboard in this list at $6.99.
Price: $6.99. Get the Sales Performance Management Dashboard in Google Sheets.
Best for: rep accountability on a tight budget.
7. Sales KPI Dashboard in Power BI

Group: report. It covers revenue, win rates, lead conversion, average deal size and pipeline health in an interactive Power BI report.
Who it is for: directors in organisations that already use Power BI.
- Revenue, win rate and conversion KPIs
- Pipeline and opportunity analysis
- Average deal size
- Customizable KPIs
Use cases: win rate = deals won / deals closed (won plus lost). If you closed 50 deals and won 18, that is 36%. Track it by quarter and slice by team in the interactive report.
Price: $11.99. Get the Sales KPI Dashboard in Power BI.
Best for: Power BI shops that want a sales model ready to load.
8. Sales KPI Dashboard in Google Sheets

Group: report. It monitors total sales, average deal size and conversion rates, with regional and team analysis and target tracking.
Who it is for: directors of distributed teams who want one shared sheet.
- Total sales, average deal size, conversion rates
- Regional and team performance
- Target vs actual with visual indicators
- Trend charts and customizable metrics
Use cases: average deal size = revenue / deals won, so $240,000 over 30 deals is $8,000. Compare it across regions to see where reps discount or sell small. Share the link with regional leads instead of emailing files.
Price: $12.99. Get the Sales KPI Dashboard in Google Sheets.
Best for: regional comparisons in a shared Sheet.
9. Sales and Marketing Resource Allocation KPI Dashboard in Excel
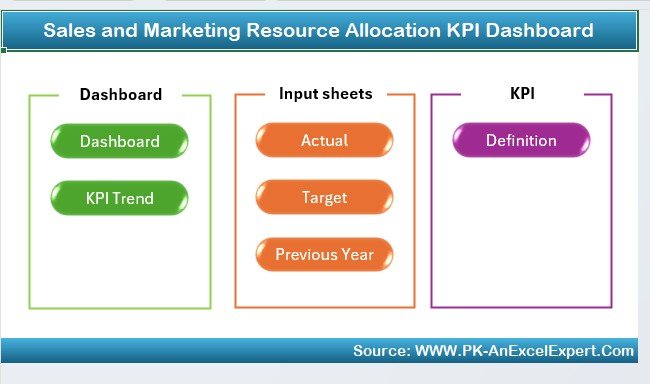
Group: plan. It tracks budget, time and manpower across sales and marketing campaigns, plus team output such as lead generation and conversions.
Who it is for: directors who share a budget with marketing and must justify headcount.
- Resource allocation across campaigns
- Budget and spend monitoring
- Team performance metrics
- Time-based utilisation trends
Use cases: divide spend by deals won for cost per deal. If a $30,000 campaign closes 10 deals, that is $3,000 each. Compare against deal size before approving next quarter’s budget.
Price: $14.99. Get the Sales and Marketing Resource Allocation KPI Dashboard in Excel.
Best for: planning budget and capacity before the year starts.
10. Sales Commission Template with Bonus Amount in Google Sheet

Group: plan. Enter sales and the template calculates commissions and bonuses against rates, tiers and bonus criteria you set.
Who it is for: sales managers, HR and finance teams running a simple plan.
- Commission and bonus calculation
- Customizable rates, tiers and bonus criteria
- Charts for sales and team performance
- Real-time updates as sales are entered
Use cases: cost of sales = commission paid / revenue. A 6% blended rate on $500,000 costs $30,000. Model a new tier before announcing it, then check what it would have paid last quarter.
Price: $6.99. Get the Sales Commission Template with Bonus Amount in Google Sheet.
Best for: transparent payouts without a dedicated commission platform.
Which SaaS tools can a sales director cancel?
| Tool you may pay for | What it does | Template that covers the reporting part | Honest limit |
|---|---|---|---|
| Salesforce | CRM and reporting | CRM and Sales Pipeline Management System Web App ($39.99) | No enterprise integrations marketplace |
| HubSpot | CRM and sales hub | CRM web app, Sales Funnel KPI Dashboard ($14.99) | No marketing automation |
| Clari | Forecasting and pipeline inspection | Command Center Dashboard ($12.99), Sales KPI Dashboard in Power BI ($11.99) | No AI forecasting, you review the numbers yourself |
| Gong | Call recording and conversation analysis | None | Keep it if call coaching matters |
| Xactly | Incentive compensation | Sales Commission Template ($6.99) | Fine for simple plans, not complex multi-tier crediting |
For a deeper look at this, see our Salesforce alternatives in Excel and Sheets and the CRM KPI dashboard guide.
How do I roll out a sales director dashboard stack in 30 days?
| Week | Job | Templates | Output |
|---|---|---|---|
| 1 | Plan | Channel Sales KPI Dashboard, Resource Allocation Dashboard, Sales Commission Template | Targets by channel, budget, commission tiers |
| 2 | Track | CRM web app, Sales Funnel KPI Dashboard, Sales Tracking Dashboard | Pipeline and sales records loaded |
| 3 | Report | Sales Performance Management (Sheets), Sales KPI (Sheets or Power BI) | Rep scorecards and weekly report |
| 4 | Present | Sales and Revenue Command Center Dashboard | First leadership meeting run from one screen |
Do not start with all ten. Pick one template per job, load three months of real data, and add more only when a question goes unanswered. The 15 sales KPIs to track in 2026 list helps you choose which metrics to load first.
How to choose between them
- One screen for leadership: start with the Command Center Dashboard in HTML ($12.99).
- You have no CRM: pick the CRM web app ($39.99).
- Your team lives in Google Sheets: pick the Sales Performance Management ($6.99) or Sales KPI ($12.99) dashboard.
- Your company standardised on Power BI: pick the Sales KPI Dashboard in Power BI ($11.99). Microsoft’s own Power BI documentation covers refresh and sharing.
- Your problem is conversion: pick the Sales Funnel KPI Dashboard ($14.99). Your problem is payouts: pick the commission template ($6.99).
More comparisons: best sales dashboard templates for 2026, 12 sales pipeline metrics to track and a lead tracker to pipeline dashboard stack.
Start with the dashboard directors open first. The Sales and Revenue Command Center Dashboard in HTML is $12.99, one-time. Get the sales director dashboard template.
When a template is NOT the right answer
Buy software when your team has more than a few dozen reps who need native mobile apps, email sync and deep integrations. A Google Sheets or Excel file will not match that.
Keep Gong if call recording and coaching drive your results; no template here replaces it. Keep a dedicated platform like Xactly if your compensation plan has complex crediting, splits and multi-level overlays. Keep Clari-style forecasting if you need AI-weighted forecasts rather than numbers you review yourself.
Templates also do not fix bad data. If reps do not log deals, every dashboard will be wrong. Agree who owns data entry before you load anything.
Frequently asked questions
What should a sales director dashboard include?
It should show revenue, win rate, pipeline value, quota attainment and team performance on one screen. The Sales and Revenue Command Center Dashboard in HTML ($12.99) has five KPI cards covering Total Revenue, Total Deals, Win Rate, Pipeline Value and Attainment, plus pages for pipeline and team performance.
Is there a sales director dashboard template in Excel?
Yes. The Sales Funnel KPI Dashboard in Excel ($14.99) tracks conversion by funnel stage, and the Sales Tracking Dashboard in Excel ($17.99) tracks net sales by region, product, channel and rep. Both use Excel only, with no subscription or per-user fees.
Can Google Sheets work as a sales dashboard?
Yes. The Sales Performance Management Dashboard in Google Sheets ($6.99) and the Sales KPI Dashboard in Google Sheets ($12.99) both track targets against actuals with charts. Because they run in Google Sheets, several managers can open the same live file at once.
Is there a Power BI sales dashboard template?
Yes. The Sales KPI Dashboard in Power BI costs $11.99. It tracks revenue, win rates, lead conversion, average deal size and pipeline health, and you can customize the KPIs to match your sales process.
Can I replace Salesforce with a template?
For small and mid-size teams, partly. The CRM and Sales Pipeline Management System Web App ($39.99) offers 28 screens, a pipeline board and 16 reports with no per-user fees. It does not include the integration marketplace of an enterprise CRM, so check your needs first.
How do I calculate sales win rate?
Win rate equals deals won divided by deals closed, where closed means won plus lost, expressed as a percentage. For example, 18 wins out of 50 closed deals is 36%. The Sales KPI Dashboard in Power BI ($11.99) tracks this metric for you.
How do I track sales commissions in a spreadsheet?
List each rep’s sales, apply a commission rate or tier, then add any bonus for hitting a target. The Sales Commission Template with Bonus Amount in Google Sheet ($6.99) does these calculations automatically and lets you customize rates, tiers and bonus criteria.
How much does the full sales director stack cost?
All ten templates together cost $155.90 as one-time purchases. Most directors will not need all ten. Starting with the Command Center Dashboard ($12.99) plus one tracking template, such as the Sales Funnel KPI Dashboard ($14.99), costs $27.98.
Get more sales templates
Build your stack one job at a time. The CRM and Sales Pipeline Management System Web App ($39.99) is the deepest tool in the list, and the Sales and Revenue Command Center Dashboard in HTML ($12.99) is the fastest to start. See the CRM web app. Walkthroughs are on the NextGenTemplates YouTube channel. Related reading: Pipedrive alternatives in Excel and Sheets, CRM dashboards for your sales workflow, sales BI dashboards and e-commerce sales dashboards.