

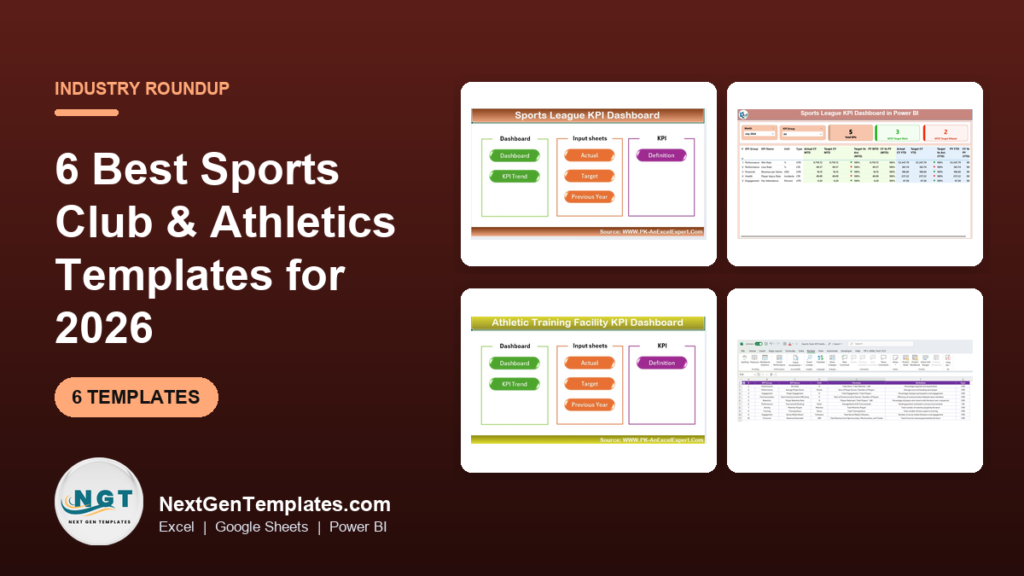
The best sports club management template for most clubs is the Sports & Recreation KPI Dashboard in Excel ($14.99). It tracks member retention, facility utilization and revenue with MTD and YTD views. Leagues should pick the Sports League KPI Dashboard ($11.99 to $14.99, three formats). Training centres should pick the Athletic Training Facility dashboard.
Last updated: October 2026
Key takeaways
- The Sports & Recreation KPI Dashboard in Excel ($14.99) is the best overall pick for clubs, academies and recreation centres because it tracks revenue, member retention and facility utilization.
- The Sports League KPI Dashboard comes in three formats: Excel ($14.99), Google Sheets ($14.99) and Power BI ($11.99, the cheapest here).
- The Athletic Training Facility KPI Dashboard in Excel ($14.99) covers training hours, injury rates and facility usage.
- The Esports Team KPI Dashboard in Excel ($14.99) covers player stats, match results, revenue and sponsorships for competitive gaming teams.
- Buying all six templates costs $86.94, but most clubs need only one or two. Pick by your main question: members, matches, athletes or sponsors.
 Launch offer
SUMIFS, XLOOKUP, FILTER, LAMBDA and checking AI-written formulas, with real business projects. 11h 47m of video by PK, with practice files, quizzes and a capstone.
Which sports club management templates compare best?
| Template | Format | Best For | Price |
|---|---|---|---|
| Sports & Recreation KPI Dashboard (Best overall) | Excel | Clubs, gyms, academies, recreation departments | $14.99 |
| Sports League KPI Dashboard | Excel | League organizers, coaches, team managers | $14.99 |
| Sports League KPI Dashboard | Google Sheets | Volunteer committees sharing data online | $14.99 |
| Sports League KPI Dashboard (Best value) | Power BI | Analysts who want drill-through and slicers | $11.99 |
| Athletic Training Facility KPI Dashboard | Excel | Athletic trainers, sports clinics, training centres | $14.99 |
| Esports Team KPI Dashboard | Excel | Esports managers, coaches and analysts | $14.99 |
How we picked these
We searched the Next Gen Templates catalog of roughly 6,900 products for sports, athletics, league, club and training templates. We kept paid templates that track performance and operations for a sports organisation, and that are available in at least one format a club can open without extra software.
We left out loosely related dashboards, including a transportation and logistics dashboard that surfaced in the first search. We also did not include any free templates. All six picks are KPI dashboards, so none of them is a booking system or a payment platform. The section on limits covers that.
The 6 best sports club management templates for 2026
1. Sports & Recreation KPI Dashboard in Excel: best overall
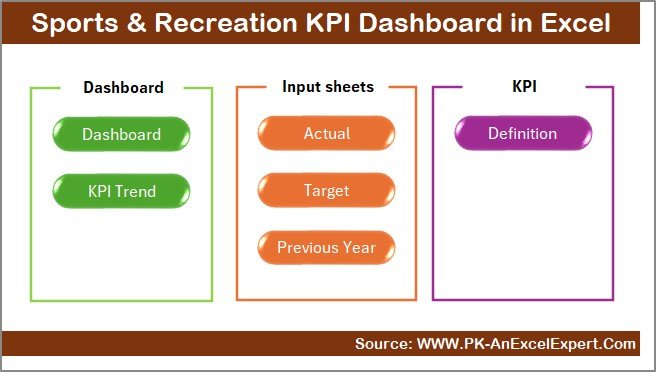
Why it is #1: a club runs on members, facilities and revenue, and this is the only template here built around those three. It suits the person who runs the whole club, not a single team.
What it is: an Excel dashboard for fitness centres, clubs, academies and recreation departments. It compares Actual, Target and Previous Year figures for the month and the year to date.
Who it is for: club managers, administrators and recreation department staff who do not want macros or add-ins.
- 7 structured sheets: Summary, Dashboard, Trend, Input, Target, Previous Year and KPI Definition.
- Change the reporting month in cell D3 and every visual updates.
- KPIs such as Revenue, Member Retention, Facility Utilization and Profit Margin.
- Colour-coded arrows show growth or decline.
- Works on Windows and Mac, with no coding.
Use cases:
- Retention check: if 200 members start the season and 18 leave, retention is (200 – 18) / 200 = 91%. Set a target of 93% and the arrows show the gap each month.
- Facility utilization: divide booked hours by available hours. If a hall is booked 120 of 160 hours, utilization is 75%.
- Board reporting: send the Summary sheet with year-to-date revenue against last year.
- Profit margin: (revenue – costs) / revenue, tracked monthly instead of at year end.
Price: $14.99. Get the Sports & Recreation KPI Dashboard in Excel.
Best for: a multi-activity club that needs one operational view of members, facilities and money.
2. Sports League KPI Dashboard in Excel: best for match and standings data
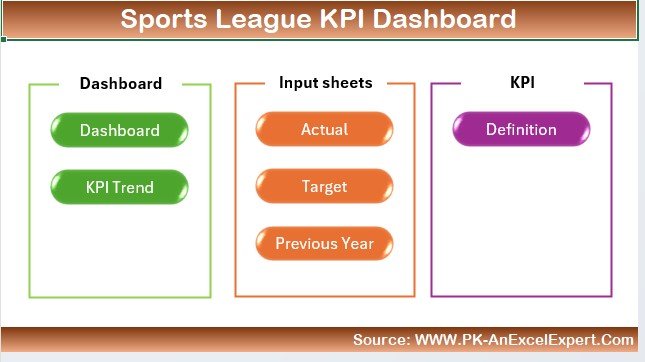
What it is: an Excel dashboard for sports managers, team coaches and league organizers. It follows player statistics, team rankings and match results.
Who it is for: anyone running a local league or a single team who wants win-loss records and standings in one place.
- Player stats such as goals, assists and penalties.
- Team win-loss ratios and points scored.
- League standings that update from game results, viewable by day, week or month.
- Match results with final scores, home versus away performance and margin of victory.
- Customizable KPIs, so you can adapt it to your league.
Use cases:
- Win percentage: a team that wins 14 of 20 games has a 70% win rate. Compare that with the league average each month.
- Home versus away: if a side takes 9 wins from 10 home games and 5 from 10 away, the split points to a travel problem.
- Margin of victory: track the average winning margin to see whether results are close or lopsided.
- Player development: compare assists per player across the season to decide who needs minutes.
Price: $14.99. Get the Sports League KPI Dashboard in Excel.
Best for: a league or team that cares mostly about results and rankings.
3. Sports League KPI Dashboard in Google Sheets: best for shared committees
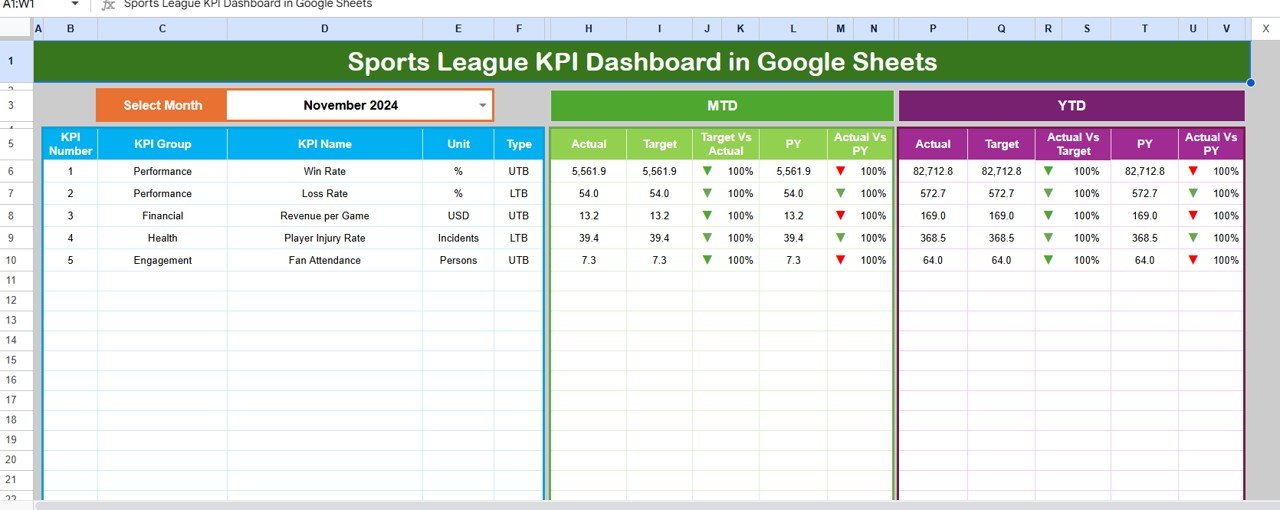
What it is: a cloud-based version for league managers, analysts, coaches and sports administrators. It goes beyond match data to include player stats, ticket sales, revenue and fan engagement.
Who it is for: volunteer boards and committees where several people update the numbers from different places.
- All-in-one dashboard covering player stats, ticket sales and revenue.
- Dynamic month selector that updates MTD and YTD values with performance arrows.
- KPI trend charts for Actual versus Target versus Previous Year.
- Six worksheet tabs, fully editable for KPI names, formulas and visuals.
- Real-time collaboration, accessible from anywhere.
Use cases:
- Ticket revenue: if a season target is $12,000 and YTD sales are $7,800, the dashboard shows 65% of target reached.
- Shared updates: the treasurer enters revenue while the coach enters player stats in the same file.
- Sponsor reporting: share a view-only copy with a sponsor to show engagement trends.
- Goal monitoring: align monthly KPIs with season targets.
Price: $14.99. Get the Sports League KPI Dashboard in Google Sheets. For more shareable options, see our Google Sheets templates for teams.
Best for: a volunteer-run league that wants everyone editing one live file.
4. Sports League KPI Dashboard in Power BI: best value
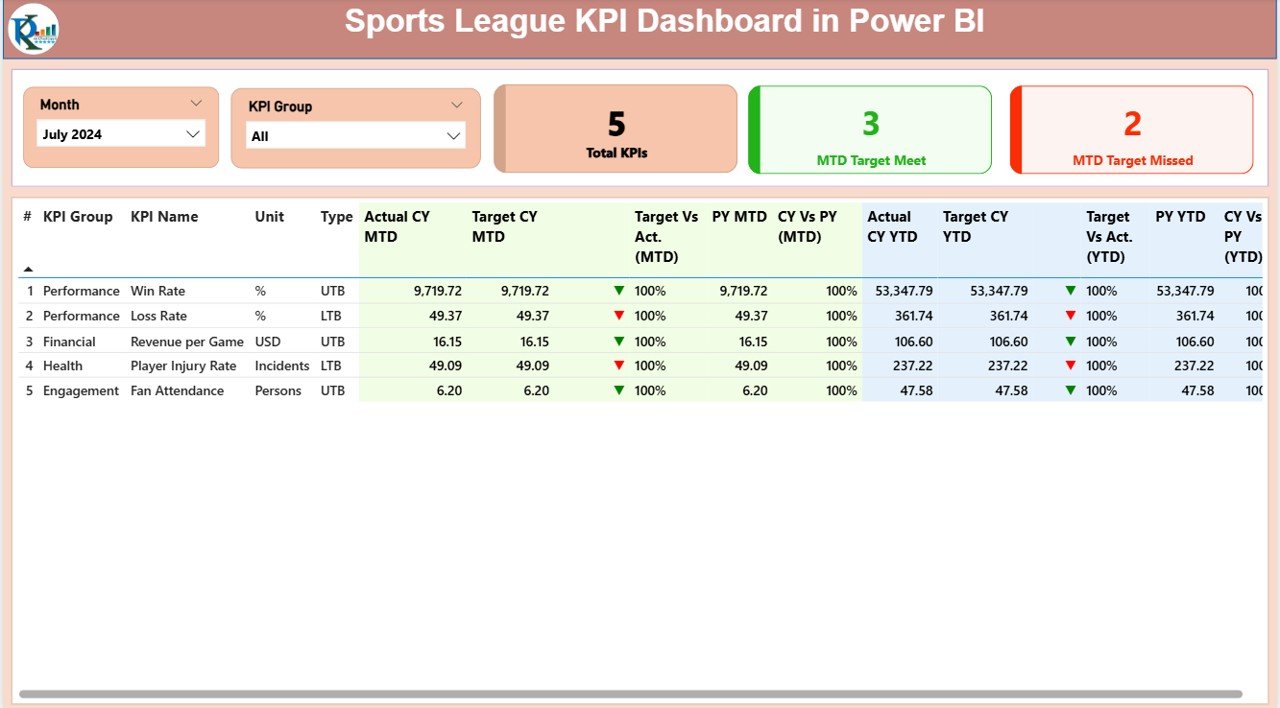
What it is: a Power BI dashboard that pairs Excel data entry with interactive visuals. It has three pages: Summary, KPI Trend and KPI Definition.
Who it is for: analysts, franchise managers and tournament organizers who already use Power BI or want slicers and drill-through.
- Month and KPI Group slicers for instant filtering.
- Performance cards showing KPIs tracked, met and missed.
- MTD and YTD tables with Actual, Target and Previous Year, plus green up and red down indicators.
- Trend charts to spot seasonal patterns.
- Drill-through to see how each KPI is defined and calculated.
- Data updates through structured Actual, Target and KPI Definition sheets in Excel.
Use cases:
- Scorecards: if 18 KPIs are tracked and 11 are met, the card shows 7 missed and you filter to those.
- Standard definitions: the drill-through settles arguments about how a metric is calculated.
- Multi-team reporting: one set of standardized metrics across several teams.
- Seasonality: the trend page shows which months dip.
Price: $11.99, the lowest in this list. Get the Sports League KPI Dashboard in Power BI.
Best for: the lowest price with the most interactive filtering, if you have Power BI.
5. Athletic Training Facility KPI Dashboard in Excel: best for training centres

What it is: an Excel dashboard for sports organisations, athletic trainers and fitness facilities. It joins athlete performance with how the facility is used.
Who it is for: managers of a gym, sports clinic or athletic training centre.
- Individual and group athlete performance, including training frequency and skill progress.
- Training hours monitoring to watch workload and avoid overtraining.
- Injury rate and recovery tracking.
- Facility and equipment usage monitoring.
- Time-based analysis of trends, with a customizable layout.
Use cases:
- Workload: if an athlete moves from 10 to 15 weekly training hours, that is a 50% jump worth reviewing.
- Injury rate: 3 injuries across 60 athletes is a 5% rate. Track it by month.
- Equipment: compare usage hours of each equipment type to decide what to replace.
- Training plans: use progress data to adjust plans per athlete.
Price: $14.99. Get the Athletic Training Facility KPI Dashboard in Excel.
Best for: training facilities that care about athlete load, injuries and equipment.
6. Esports Team KPI Dashboard in Excel: best for competitive gaming

What it is: an Excel dashboard for esports team managers, coaches and analysts. It covers player performance, match results, revenue and goals.
Who it is for: a competitive gaming team or esports organization that treats players like athletes.
- Player stats such as kills, assists, deaths, win rate and ranking.
- Revenue from sponsorships, tournaments and merchandise.
- Match results and win/loss ratios across tournaments.
- Goals and milestones for players and the team.
- Team dynamics and collaboration metrics.
Use cases:
- Win rate: 24 wins from 40 matches is 60%. Track it per tournament.
- Kill/death ratio: kills divided by deaths, per player, to compare contribution.
- Revenue mix: if sponsors supply $6,000 of $10,000 monthly income, you depend on them for 60%.
- Milestones: set a target ranking per player for the season.
Price: $14.99. Get the Esports Team KPI Dashboard in Excel.
Best for: esports teams with sponsors and a tournament schedule.
How do I choose between these sports club templates?
| If your main question is… | Pick | Price |
|---|---|---|
| Are members staying and are facilities full? | Sports & Recreation KPI Dashboard (Excel) | $14.99 |
| Who is winning and how do standings look? | Sports League KPI Dashboard (Excel) | $14.99 |
| Can several volunteers edit it at once? | Sports League KPI Dashboard (Google Sheets) | $14.99 |
| Can I filter and drill into KPI definitions? | Sports League KPI Dashboard (Power BI) | $11.99 |
| Are athletes overloaded or injured? | Athletic Training Facility KPI Dashboard (Excel) | $14.99 |
| Are sponsors and tournaments paying off? | Esports Team KPI Dashboard (Excel) | $14.99 |
A short decision path: start with who updates the file. If it is one administrator, use Excel. If it is a committee in different homes, use Google Sheets. If a data person builds reports for a board, use Power BI.
Then decide what you are measuring. Money and members point to the Sports & Recreation dashboard. Results point to the league dashboard. Athlete health points to the training facility dashboard.
Bundle maths: the three league formats cost $14.99 + $14.99 + $11.99 = $41.97. You rarely need all three. A club with a treasurer on Excel and a coach on Google Sheets might buy the Sports & Recreation dashboard and the Sports League Google Sheets dashboard for $29.98 and keep one file per job. All six come to $86.94.
Do KPI dashboards replace sports club software like TeamSnap or SportsEngine?
No. A KPI dashboard shows you how the club is performing. It does not take payments or send reminders to parents. Tools such as TeamSnap, SportsEngine and similar apps handle scheduling, registration and messaging, and their pricing changes, so check each vendor’s pricing page before you compare.
The templates here fit a different job. They give you a one-off purchase at $11.99 to $14.99 that you own as a file and can edit. If you only need to track results, retention and revenue, a template is usually enough. If you already run registrations in an app, a dashboard can sit beside it and take the numbers you export.
If you are weighing spreadsheet tools against subscription project tools for the admin side, our guides to Asana alternatives in Excel and Sheets, ClickUp alternatives and Smartsheet alternatives cover the trade-offs. Clubs that also care about member loyalty may like the customer management and service templates post. If your club runs transport for away games, the fleet management dashboard roundup may help.
When is a template NOT the right answer?
Buy software instead in these cases:
- You need online registration and payments. None of these six templates collects fees or signs up players. Use a dedicated club platform.
- You need automatic scheduling and parent messaging. A spreadsheet cannot send reminders.
- You have no one to enter data. A dashboard is only as good as its Input sheet. If nobody updates it monthly, it will go stale.
- You need a medical record system. The Athletic Training Facility dashboard tracks injury rates, not individual health records or compliance.
- You manage thousands of members. At that size, a database-backed system will be easier to maintain than a workbook.
There is also a practical limit: these are KPI dashboards, not full club management systems. If you only need a roster and a fixture list, a simple spreadsheet from scratch costs nothing. The templates earn their price when you want targets, previous-year comparison and trend charts without building the formulas yourself. For a deeper look at Power BI itself before buying, see Microsoft’s Power BI site.
Frequently asked questions
What is the best sports club management template?
For most clubs, the Sports & Recreation KPI Dashboard in Excel at $14.99. It tracks revenue, member retention, facility utilization and profit margin across 7 sheets. Leagues that care about match results should choose the Sports League KPI Dashboard instead, which starts at $11.99 in Power BI.
Is there a sports club management template in Google Sheets?
Yes. The Sports League KPI Dashboard in Google Sheets costs $14.99. It has six worksheet tabs, a month selector for MTD and YTD values, and trend charts for Actual versus Target versus Previous Year. Several people can edit it in real time from anywhere.
Can I use these templates for a small amateur club?
Yes. The Sports League dashboard descriptions mention local leagues as well as professional teams, and the Sports & Recreation dashboard suits clubs and academies. You can edit the KPIs, so a small club can track only the five or six numbers it actually needs.
Which format should I choose: Excel, Google Sheets or Power BI?
Choose Excel if one person maintains the file, Google Sheets if a committee edits together, and Power BI if you want slicers and drill-through. The Sports League dashboard costs $14.99 in Excel, $14.99 in Google Sheets and $11.99 in Power BI.
What KPIs should a sports club track?
Start with member retention, facility utilization, revenue and profit margin, which the Sports & Recreation dashboard includes. Add win-loss ratios and standings if you run teams, and training hours and injury rates if you run athletes. Keep the list short enough to update monthly.
Do these templates need macros or add-ins?
The Sports & Recreation KPI Dashboard in Excel is described as completely Excel-based, with no add-ins, macros or installations, and it works on Windows and Mac. The Power BI version needs Power BI, and the Google Sheets version runs in your browser.
Can I customize the KPIs and formulas?
Yes. The Sports League dashboards describe customizable KPIs, and the Google Sheets version lets you edit KPI names, formulas and visuals. The Sports & Recreation dashboard lets you define your own formulas and metrics, with a KPI Definition sheet to keep them documented.
Is there a template for an esports team?
Yes. The Esports Team KPI Dashboard in Excel costs $14.99. It tracks kills, assists, deaths, win rate and ranking, plus revenue from sponsorships, tournaments and merchandise. It also includes goal and milestone tracking for players and the whole team.
Get more sports club and athletics templates
Start with the best overall pick: the Sports & Recreation KPI Dashboard in Excel for $14.99, or the Sports League KPI Dashboard in Power BI for $11.99 if you want the lowest price.
Watch walkthroughs of our dashboards on the Next Gen Templates YouTube channel.
Running club administration alongside a school or training program? See our roundups of K-12 school administration templates and e-learning and EdTech dashboard templates for the same actual-vs-target reporting approach applied to students and online courses.