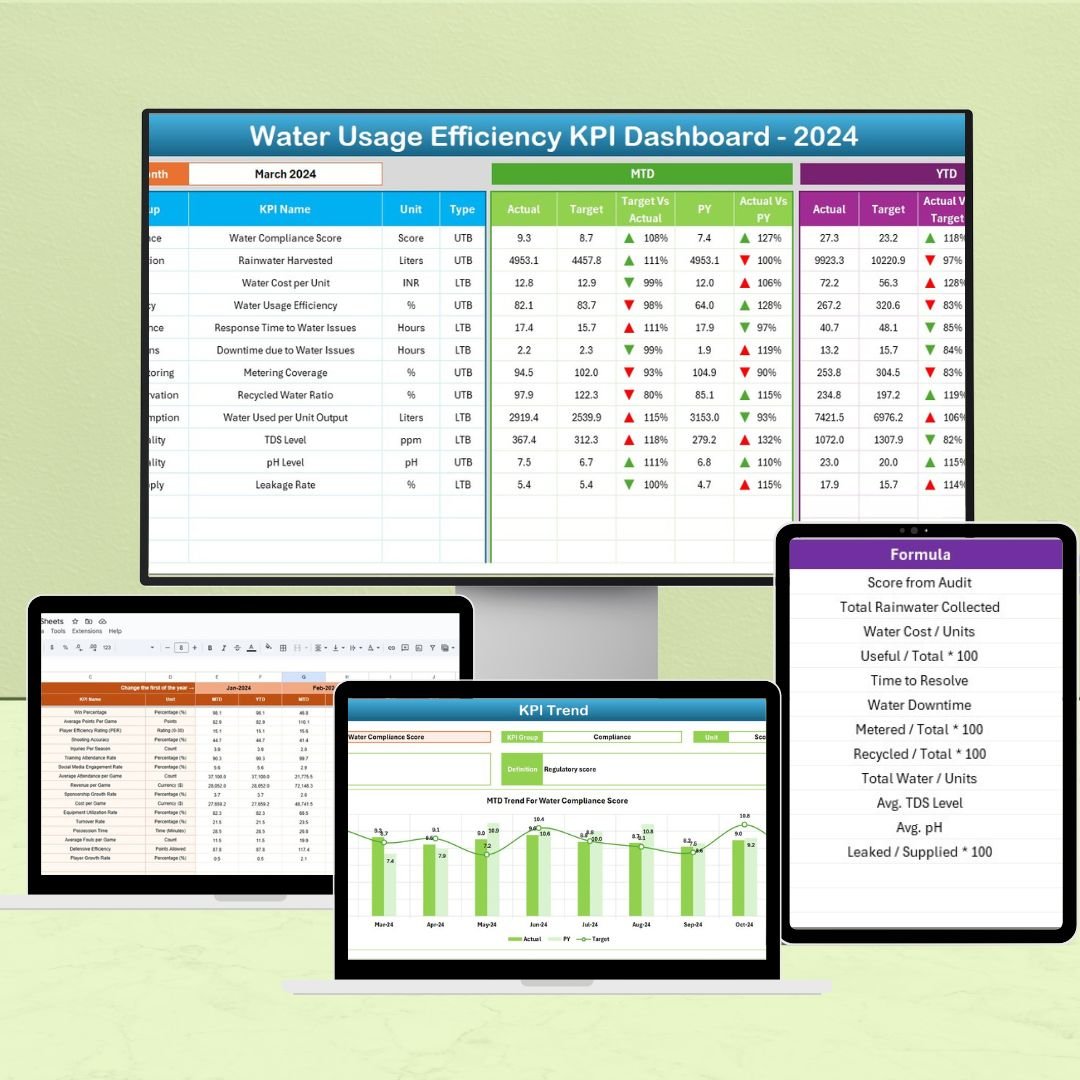

The Water Usage Efficiency KPI Dashboard in Excel is a powerful tool designed to help organizations monitor, track, and optimize their water consumption. This dashboard consolidates key performance indicators (KPIs) related to water usage, providing clear, actionable insights that help businesses reduce waste, enhance sustainability, and lower costs.
By using this Excel-based dashboard, organizations can assess their water efficiency, identify areas for improvement, and implement strategies that contribute to both operational efficiency and environmental sustainability.
Key Features of the Water Usage Efficiency KPI Dashboard
📊 Comprehensive KPI Tracking
-
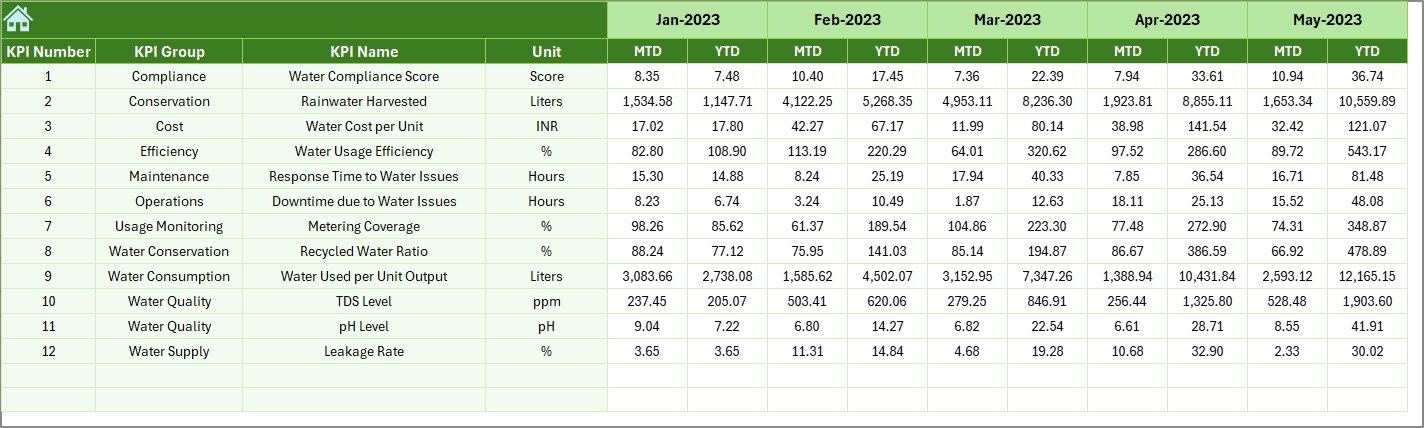
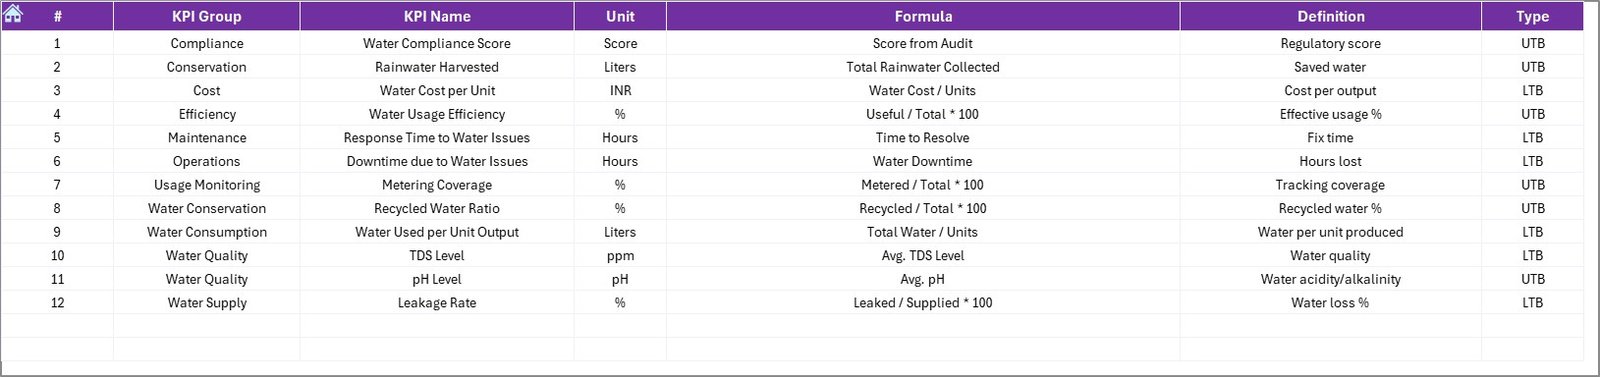
Monitor Essential Metrics: Track KPIs such as water usage per unit of production, total consumption, efficiency rates, and water waste.
-
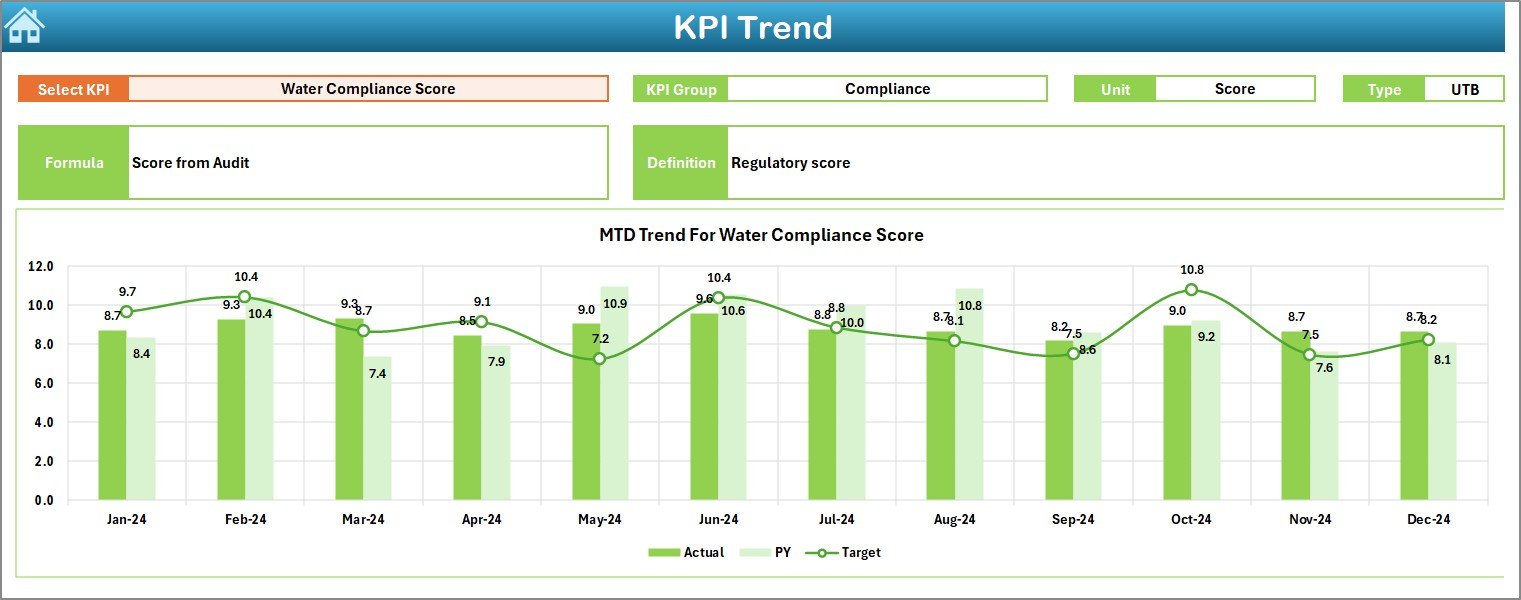
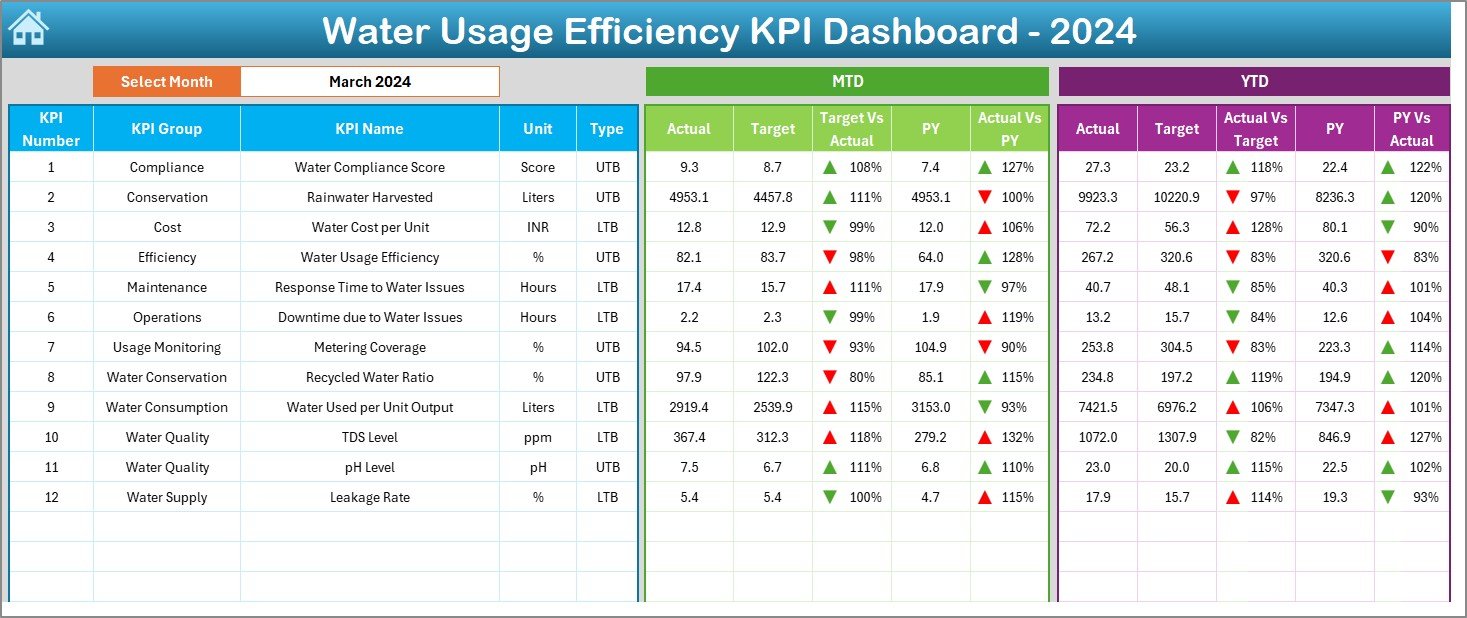
Visualize Trends: Use dynamic charts and graphs to spot trends over time and make informed decisions.
📈 Customizable Metrics
-
Tailor to Your Needs: Easily adjust the dashboard to reflect the water usage metrics that matter most to your business.
-
Flexible Inputs: Input data for different departments, facilities, or locations to track water usage across your entire organization.
🔧 User-Friendly Interface
-
Easy Setup: This Excel template is designed for simplicity, making it easy for users with minimal technical experience to set up and use.
-
Real-Time Data Updates: Automatically update the dashboard with real-time data, ensuring that your water usage metrics are always current.
📅 Performance Monitoring & Reporting
-
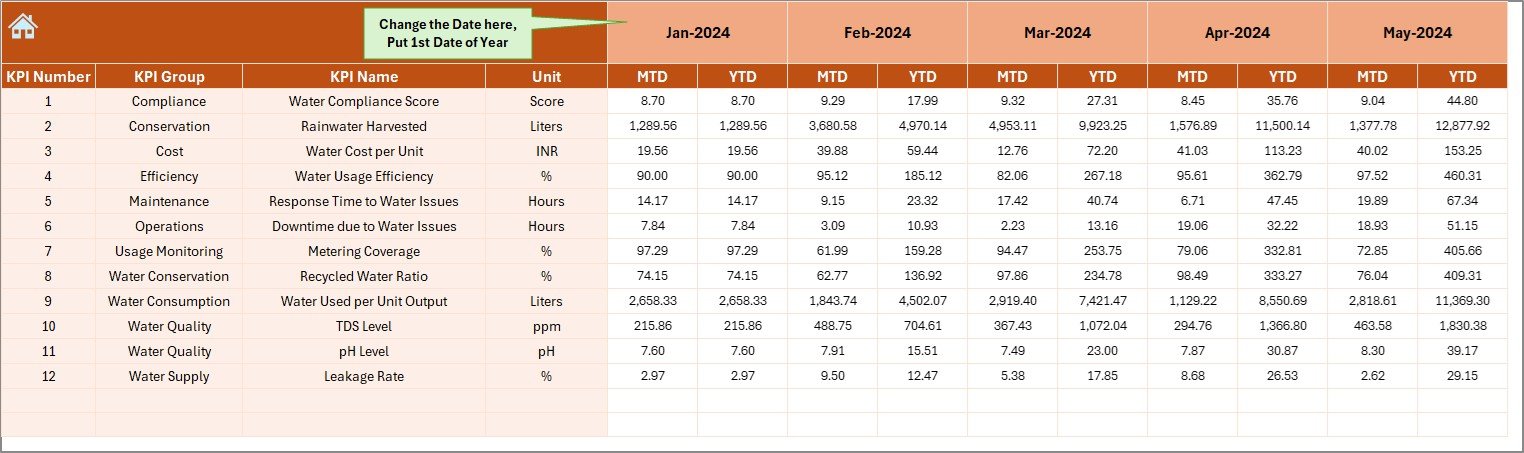
Track MTD & YTD: Monitor Month-to-Date (MTD) and Year-to-Date (YTD) performance to evaluate improvements over time.
-
Target vs. Actual Comparison: Measure actual water usage against predefined targets to gauge performance and identify areas for improvement.
Benefits of Using the Water Usage Efficiency KPI Dashboard
✅ Informed Decision-Making
Access real-time data to make quick, informed decisions about water usage and efficiency improvements.
✅ Cost Savings
Reduce water waste and optimize water usage to lower costs across your operations.
✅ Enhanced Sustainability
Track and improve water efficiency to meet sustainability goals and contribute to environmental conservation.
✅ Improved Accountability
With clear KPI tracking, teams can stay accountable for their water usage, ensuring alignment with the organization’s sustainability objectives.
Getting Started with Your Water Usage Efficiency KPI Dashboard
-
Download the Template: Get started by downloading the Water Usage Efficiency KPI Dashboard template, ready for customization.
-
Set Up Your KPIs: Define the key metrics that reflect your organization’s water usage goals and objectives.
-
Input Data: Regularly input your water usage data, ensuring the dashboard is updated with real-time information.
-
Monitor & Analyze: Use the dashboard to track trends and identify areas where water usage can be optimized.
-
Share Insights: Distribute the dashboard to stakeholders to promote transparency and collaboration in achieving sustainability goals.
By using the Water Usage Efficiency KPI Dashboard in Excel, organizations can streamline water management processes, reduce costs, and contribute to environmental sustainability.
Click here to read the Detailed blog post
Water Usage Efficiency KPI Dashboard in Excel
Visit our YouTube channel to learn step-by-step video tutorials
YouTube.com/@PKAnExcelExpert


Reviews
There are no reviews yet.