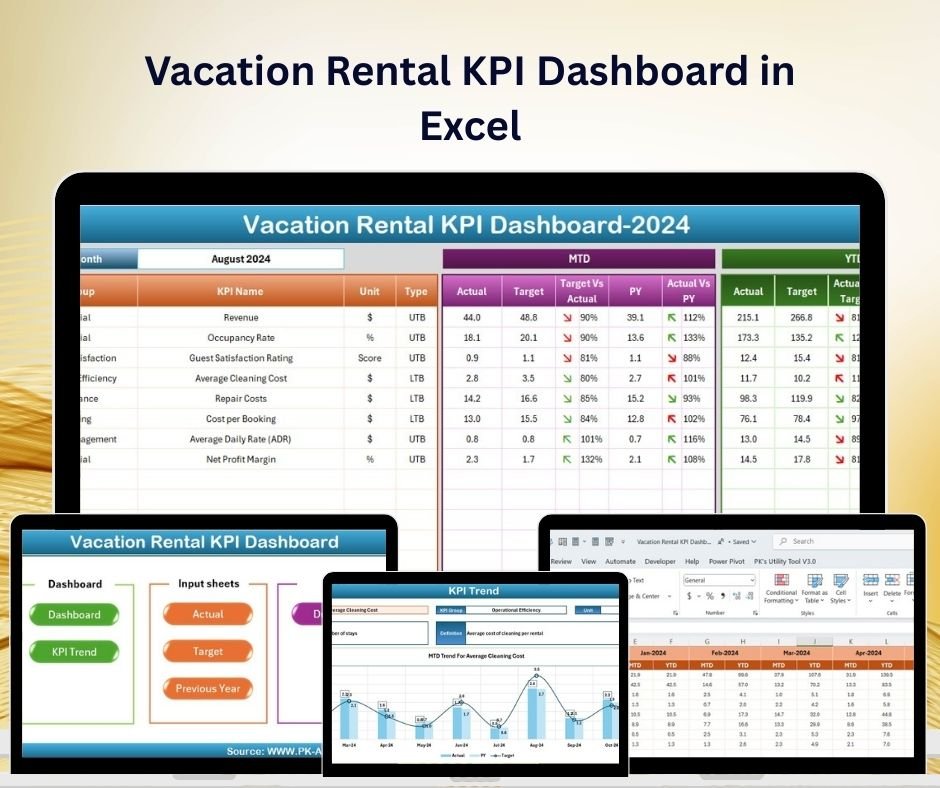
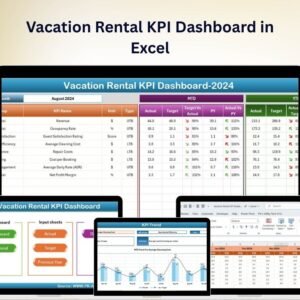
The Vacation Rental KPI Dashboard in Excel is a comprehensive tool designed for property owners, managers, and analysts in the vacation rental industry. Whether you manage a single rental property or an entire portfolio, this dashboard allows you to track critical performance indicators (KPIs) like booking rates, occupancy, revenue, customer satisfaction, and operational efficiency.
With customizable features and real-time tracking, this Excel-based dashboard helps you make data-driven decisions to optimize your vacation rental operations, boost profitability, and improve guest experiences.

Key Features of the Vacation Rental KPI Dashboard in Excel:
🏠 Booking and Occupancy Tracking
Monitor the number of bookings, occupancy rates, and revenue per property to assess performance and identify opportunities for improving booking rates.
💰 Revenue Management
Track total revenue, average daily rates (ADR), revenue per available room (RevPAR), and other financial KPIs to maximize profitability.
📈 Customer Satisfaction Tracking
Analyze guest reviews, ratings, and satisfaction scores to evaluate the guest experience and identify areas for improvement.
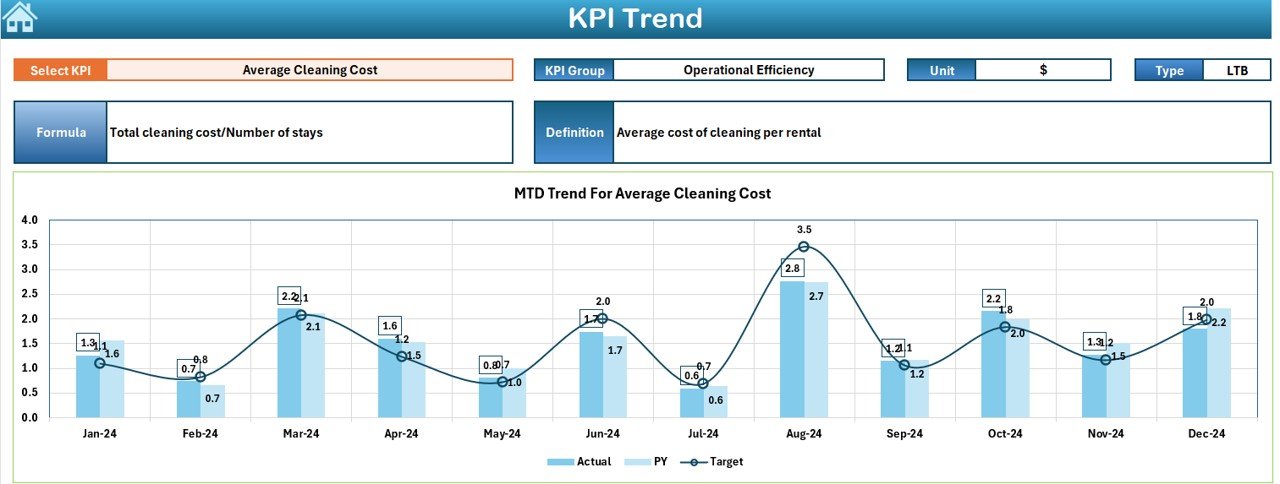
📦 Property and Operational Efficiency
Track maintenance, cleaning schedules, and operational costs to optimize property management and ensure smooth operations.
📅 Seasonal Performance Tracking
Track occupancy and revenue trends for different seasons, helping you plan marketing strategies and adjust pricing for peak and off-peak periods.
🚀 Why You’ll Love the Vacation Rental KPI Dashboard in Excel:
✅ Track Booking and Occupancy – Monitor booking rates, occupancy, and the number of guests to optimize your property’s availability and pricing strategies.
✅ Maximize Revenue – Track revenue per property, ADR, and RevPAR to make informed decisions that drive financial success.
✅ Enhance Guest Satisfaction – Track customer reviews, satisfaction ratings, and feedback to maintain a high level of service and improve the guest experience.
✅ Improve Operational Efficiency – Monitor operational metrics like cleaning schedules, property maintenance, and costs to streamline your property management.
✅ Track Seasonal Trends – Analyze occupancy and revenue trends by season to optimize your marketing strategies and pricing for peak periods.
✅ Fully Customizable and Interactive – Tailor the dashboard to fit your specific vacation rental business, with interactive features and real-time insights for better decision-making.
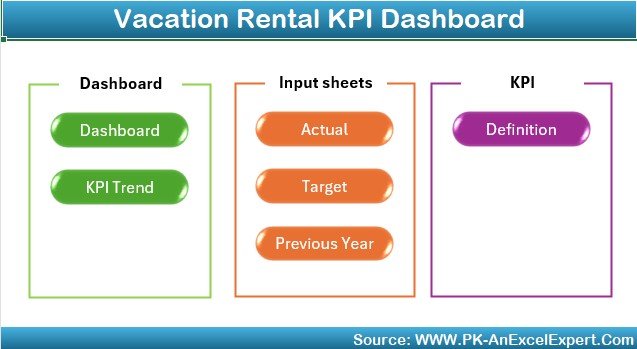
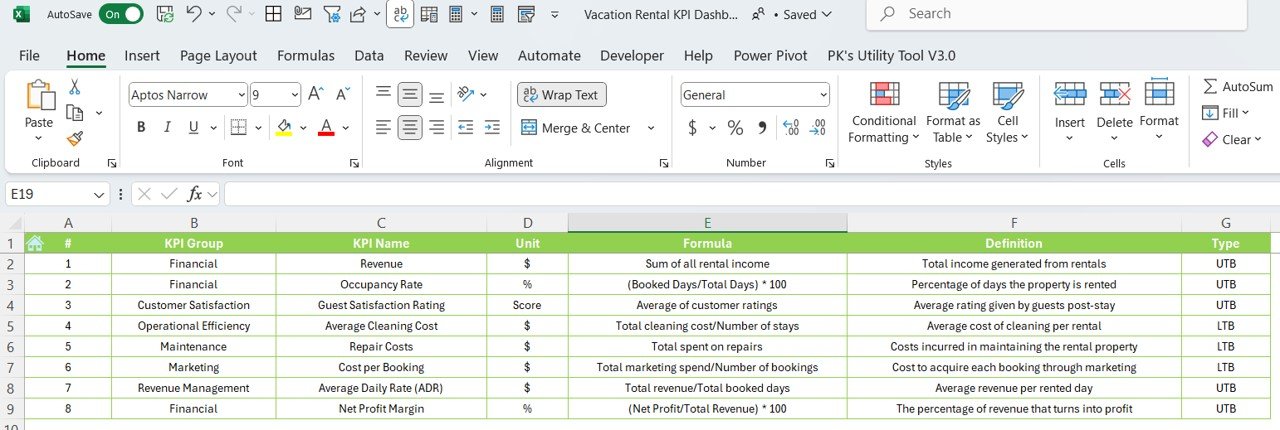
What’s Inside the Vacation Rental KPI Dashboard in Excel:
-
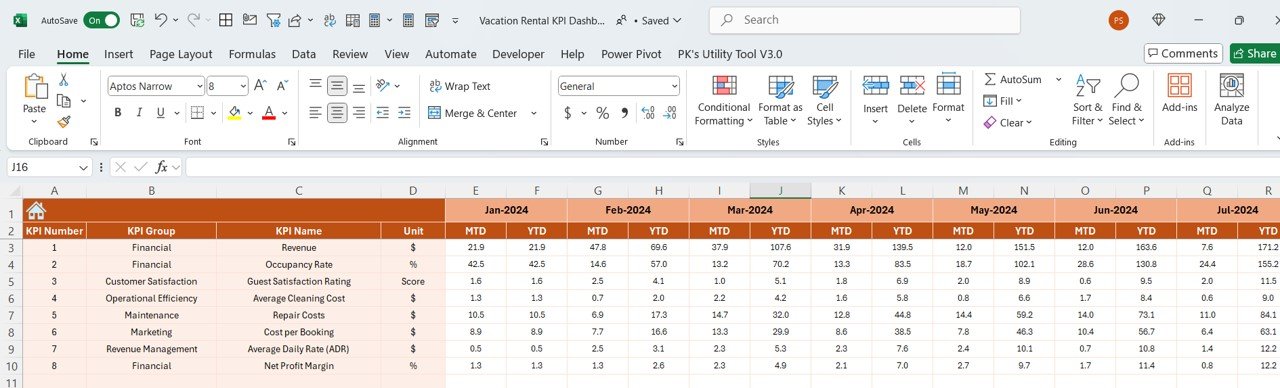
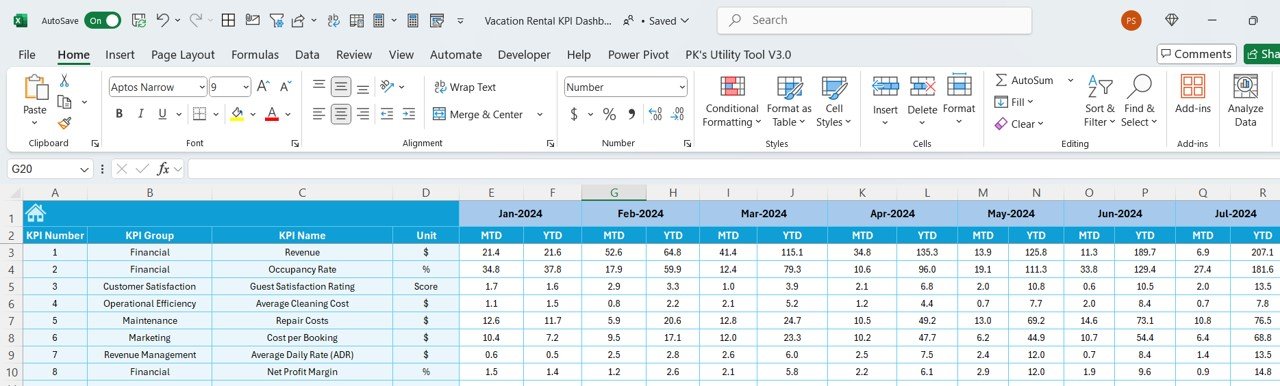
Booking and Occupancy Tracking: Track the number of bookings, occupancy rate, and revenue per booking to identify trends and optimize pricing strategies.
-
Revenue Management: Monitor ADR, RevPAR, total revenue, and average length of stay (LOS) to assess financial performance and profitability.
-
Customer Satisfaction: Track customer feedback, reviews, and ratings to improve guest experience and increase retention rates.
-
Property Operations: Monitor operational activities such as cleaning schedules, maintenance requests, and property readiness for guest arrivals.
-
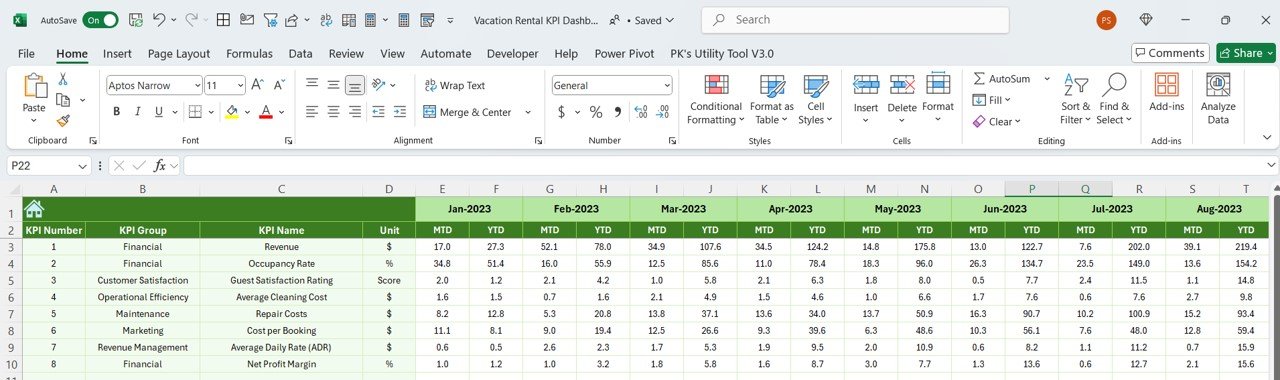
Seasonal Performance: Track seasonal performance by analyzing revenue, occupancy, and pricing trends during peak and off-peak times.
-
Custom Reports: Generate custom reports summarizing key metrics such as occupancy, revenue, and customer satisfaction for strategic decision-making.
How to Use the Vacation Rental KPI Dashboard in Excel:
1️⃣ Download the Template – Instantly access your Excel file upon purchase.
2️⃣ Input Booking and Revenue Data – Enter booking details, revenue figures, and guest ratings to start tracking key KPIs.
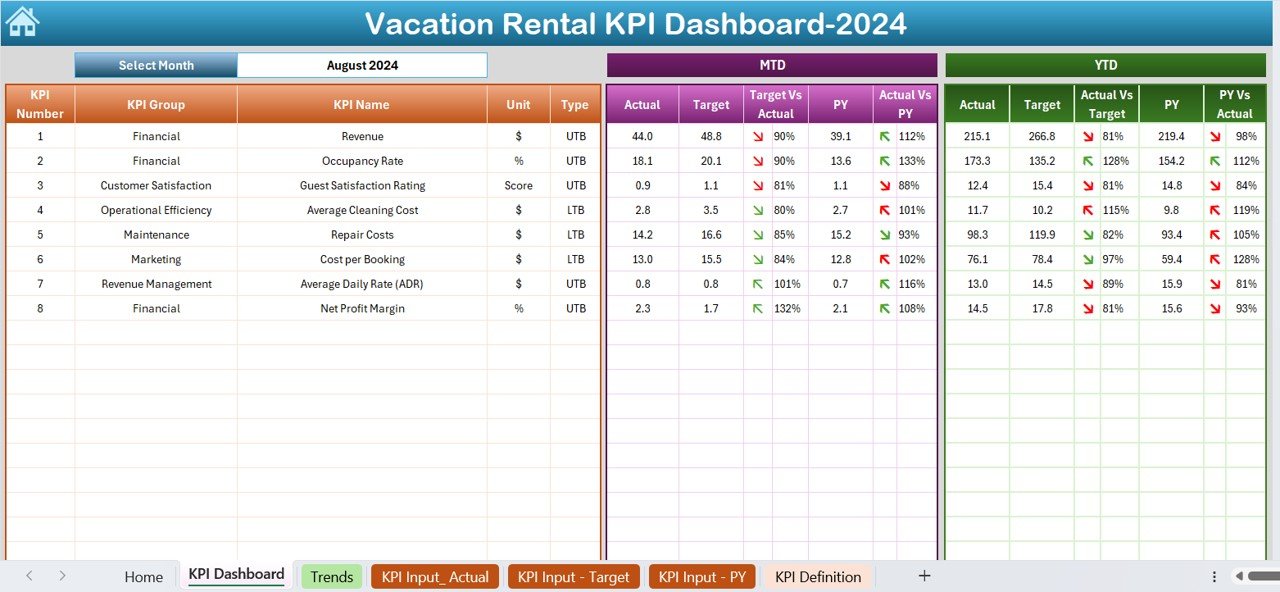
3️⃣ Monitor Key Metrics – Use the dashboard to track occupancy rates, revenue, guest satisfaction, and operational efficiency in real-time.
4️⃣ Analyze Financials – Track your revenue and profit metrics, including ADR and RevPAR, to optimize your pricing strategies.
5️⃣ Generate Reports – Create custom reports summarizing performance metrics and trends to inform your business strategy.
Who Can Benefit from the Vacation Rental KPI Dashboard in Excel:
-
Vacation Rental Owners and Managers
-
Property Managers and Administrators
-
Financial Analysts in the Vacation Rental Industry
-
Customer Service Teams
-
Marketing and Sales Teams
-
Operations Managers
-
Business Owners and Entrepreneurs in the Vacation Rental Market
-
Data Analysts
The Vacation Rental KPI Dashboard in Excel is the ideal tool for property owners and managers looking to optimize their operations, maximize profitability, and enhance guest satisfaction. Whether you manage a single vacation rental or a large portfolio, this dashboard ensures you make informed decisions that drive business success.
Click here to read the Detailed blog post
https://www.pk-anexcelexpert.com/vacation-rental-kpi-dashboard-in-excel/
Visit our YouTube channel to learn step-by-step video tutorials
Youtube.com/@PKAnExcelExpert


Reviews
There are no reviews yet.