

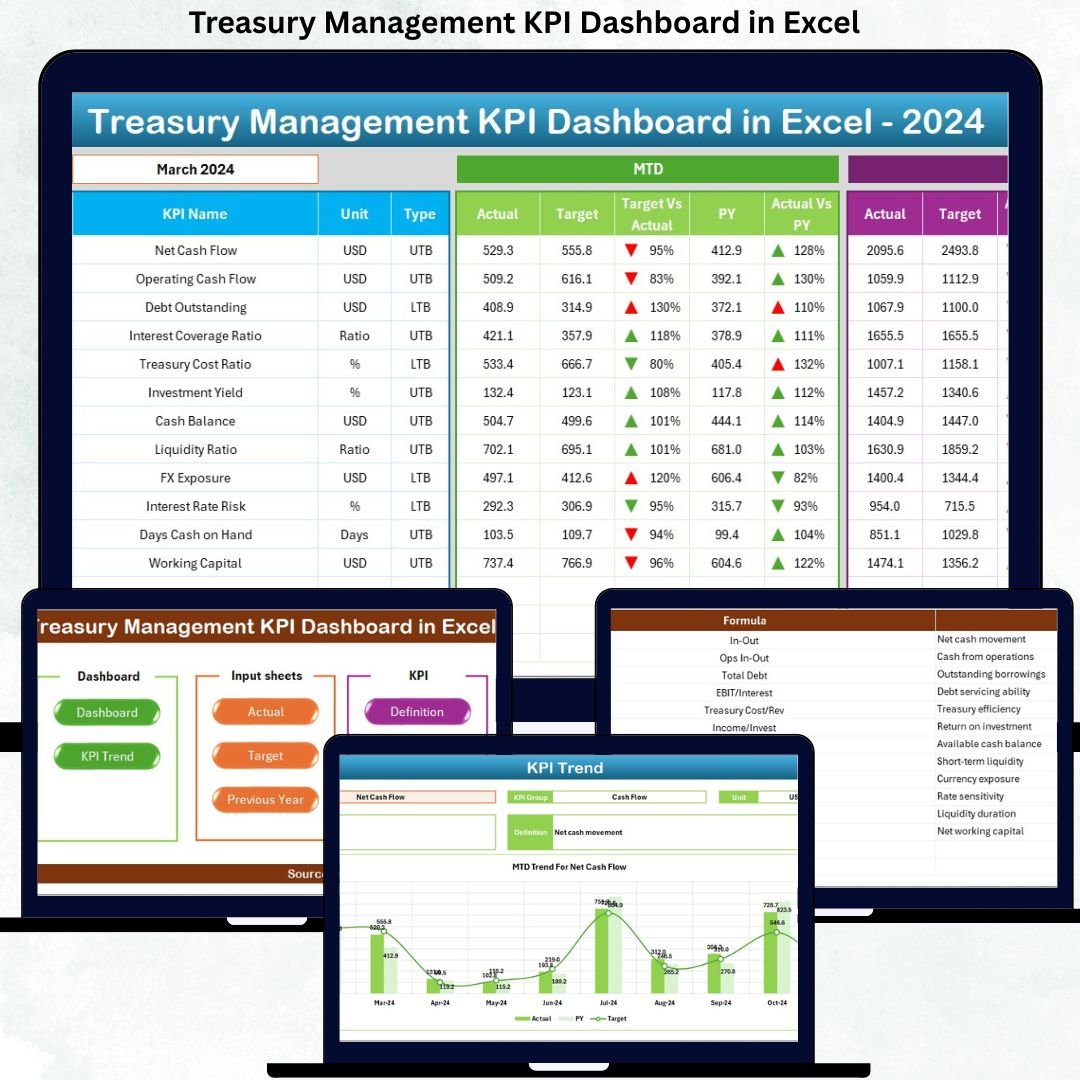

Managing treasury operations without clear, real-time visibility often leads to cash flow uncertainty, delayed decisions, and increased financial risk. That is exactly why the Treasury Management KPI Dashboard in Excel is designed—to give finance and treasury teams complete control, clarity, and confidence over critical treasury performance metrics from a single Excel file.
This ready-to-use dashboard transforms complex treasury data into simple, visual, and actionable insights. Instead of juggling multiple spreadsheets, emails, and manual reports, you get a centralized, interactive KPI dashboard that tracks cash position, liquidity, debt exposure, forecast accuracy, and performance trends with ease. Best of all, it runs entirely in Excel—no expensive treasury software or IT dependency required.
🔑 Key Features of the Treasury Management KPI Dashboard in Excel
📊 This dashboard is built to deliver clarity at a glance while maintaining analytical depth.
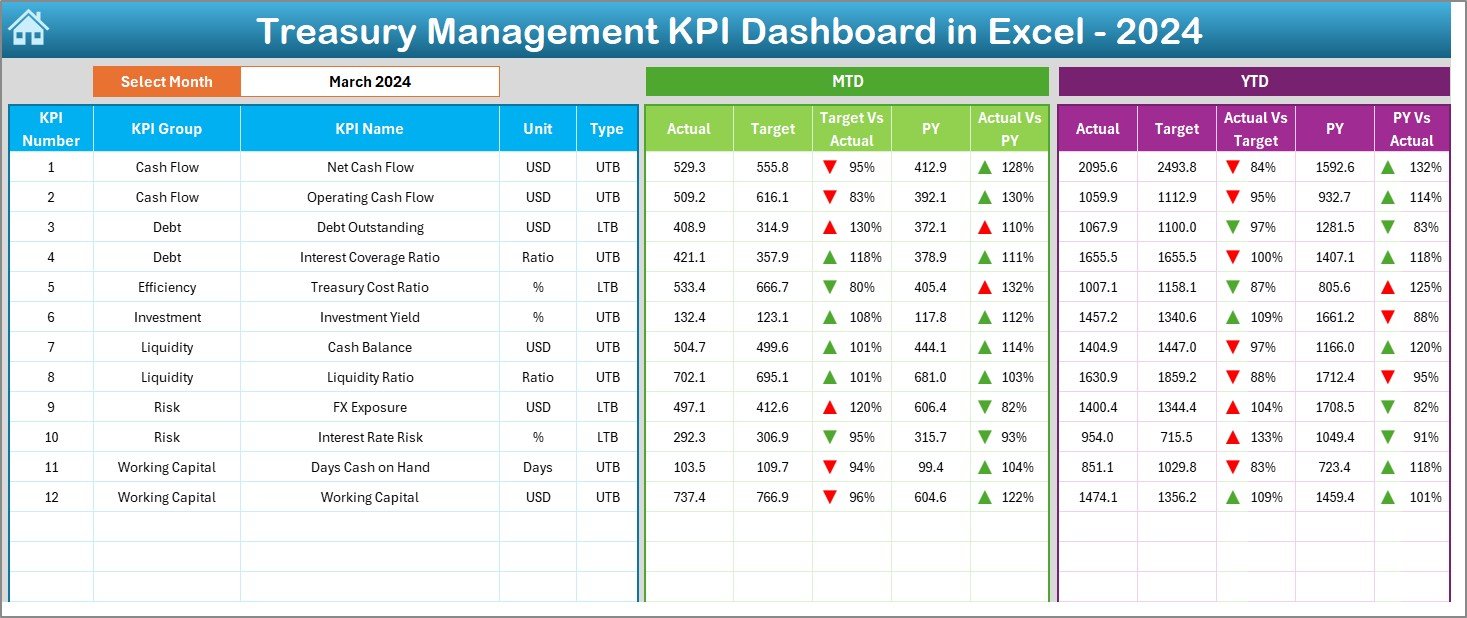
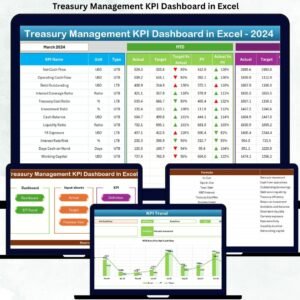
Interactive MTD and YTD KPI tracking
Target vs Actual and Previous Year vs Actual comparisons
Month selector for dynamic reporting
Conditional formatting with up/down arrows for instant performance signals
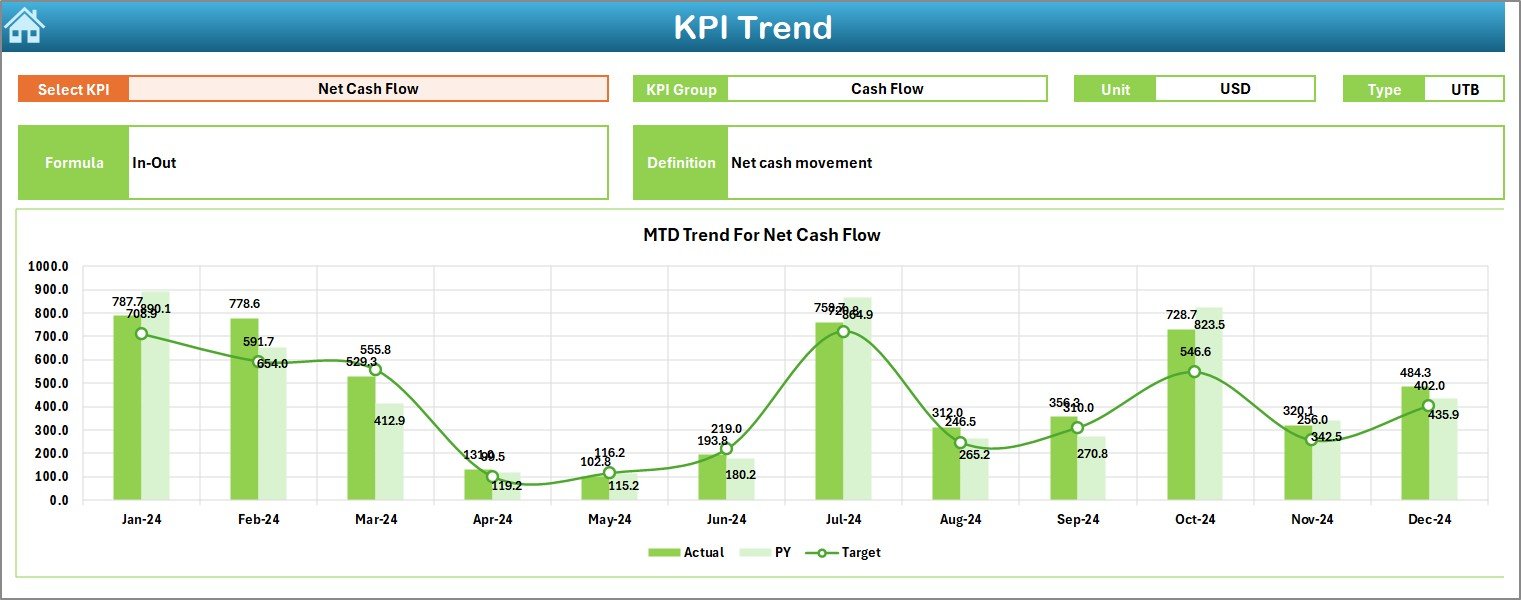
Dedicated Trend Analysis with charts and KPI details
Clean, professional layout designed for decision-makers
Fully customizable KPIs based on business needs
📦 What’s Inside the Treasury Management KPI Dashboard in Excel
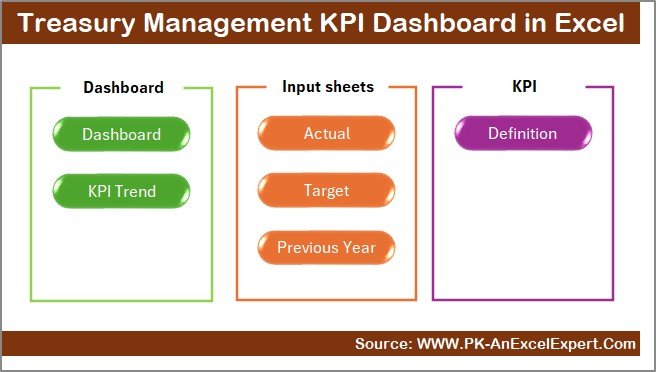
🗂️ The product includes 7 structured worksheets, each with a clear purpose:
Summary Page – Acts as a navigation hub with buttons for quick access to all sheets
Dashboard Sheet – Displays all treasury KPIs in one view with MTD & YTD performance
Trend Sheet – Deep KPI analysis with trends, formulas, definitions, and performance charts
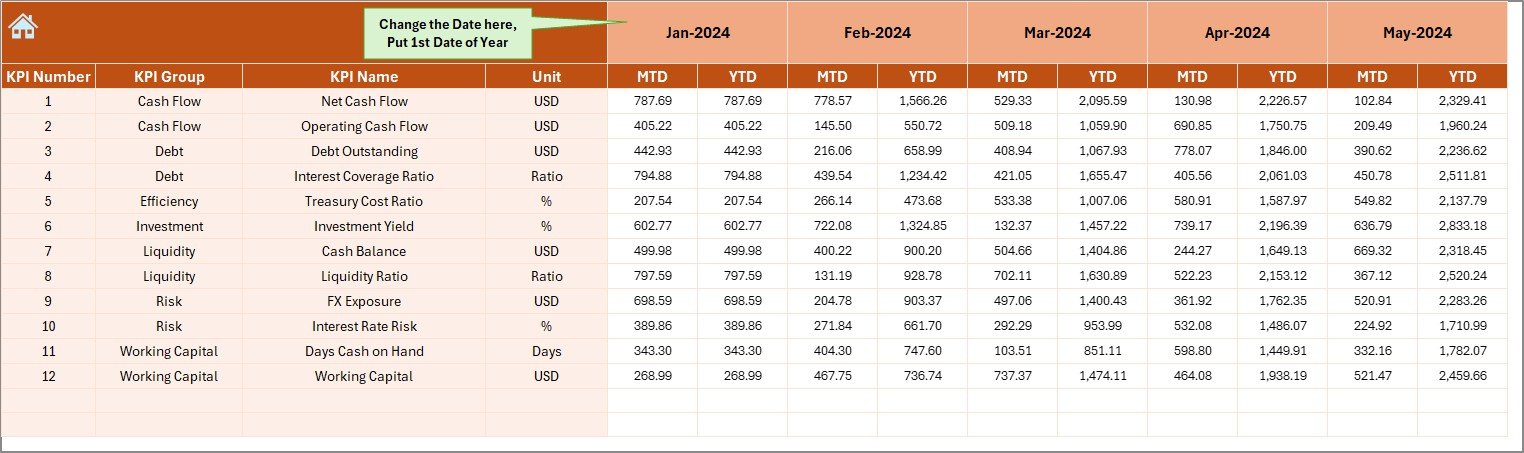
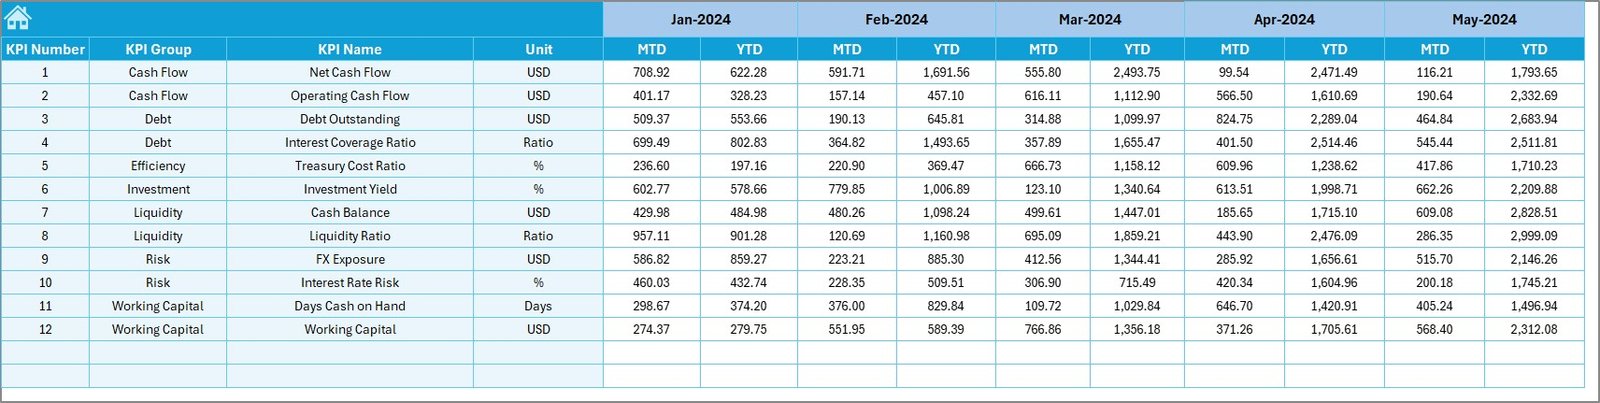
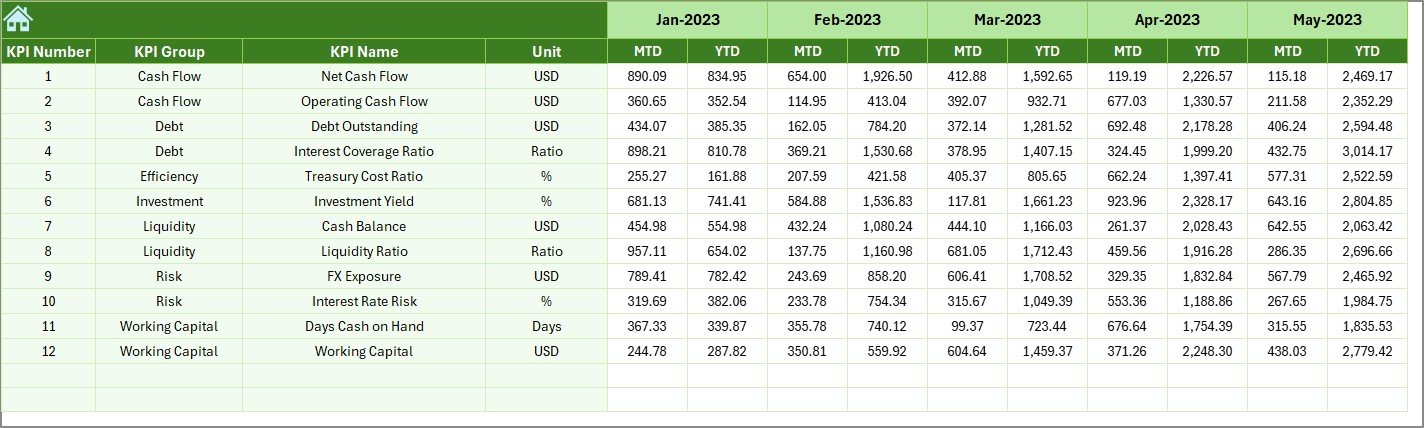
Actual Numbers Sheet – Easy input area for monthly actual data
Target Sheet – Stores planned targets for comparison
Previous Year Sheet – Enables year-over-year analysis
KPI Definition Sheet – Explains KPI names, groups, units, formulas, and definitions
This structure ensures clarity, consistency, and scalability for treasury reporting.
⚙️ How to Use the Treasury Management KPI Dashboard in Excel
🚀 Getting started is simple and fast:
Enter actual values in the Actual Numbers sheet
Define monthly and annual targets in the Target sheet
Add previous year data in the Previous Year sheet
Select the desired month from the dropdown
Instantly review performance on the Dashboard and Trend sheets
No advanced Excel skills are required. Basic data entry is enough to unlock powerful insights.
👥 Who Can Benefit from This Treasury Management KPI Dashboard in Excel
💼 This dashboard is ideal for:
Treasury Managers
Finance Managers
CFOs and Controllers
Financial Analysts
Growing startups managing cash flow
Mid-sized and large organizations
If your organization deals with cash, liquidity, debt, or forecasting, this dashboard is a must-have tool.
Click here to read the Detailed blog post
Watch the step-by-step video tutorial:







Reviews
There are no reviews yet.