


The Travel & Tourism KPI Dashboard in Excel is a dynamic tool designed specifically for businesses in the travel and tourism industry, including travel agencies, tour operators, and hotels. This dashboard enables you to track key performance indicators (KPIs) related to bookings, revenue, customer satisfaction, and marketing efforts, helping you optimize operations, boost revenue, and improve customer experience.
With real-time tracking, visual charts, and customizable features, this Excel dashboard helps you manage everything from sales performance to customer feedback. Whether you’re tracking hotel bookings, tour sales, or online marketing performance, this tool provides the insights you need to make informed decisions and grow your travel business.
Key Features of the Travel & Tourism KPI Dashboard in Excel:
📊 Comprehensive KPI Tracking
Track essential travel and tourism KPIs such as booking volumes, revenue generation, customer satisfaction, cost-per-booking, occupancy rates, and marketing ROI—all in one dashboard.
📈 Real-Time Performance Monitoring
Monitor your travel and tourism business performance in real-time, ensuring that you can optimize sales, customer service, and marketing efforts as needed.
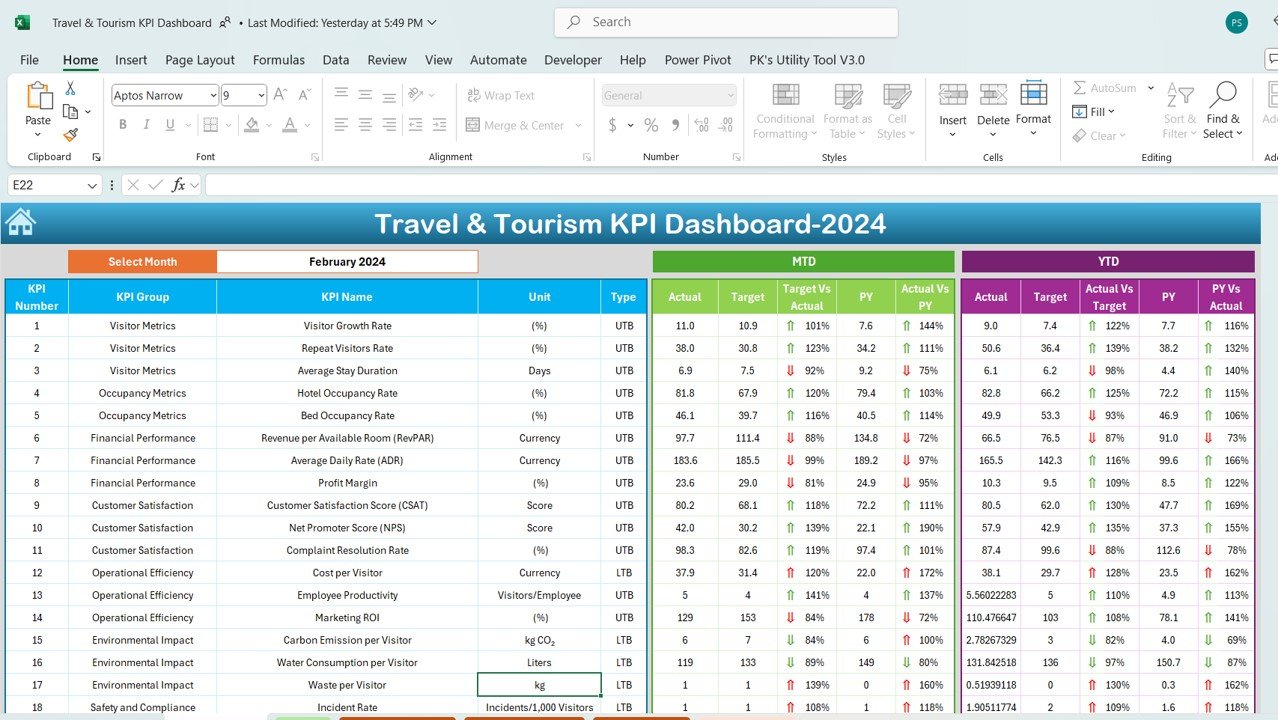
📅 Month-to-Date (MTD) and Year-to-Date (YTD) Analysis
Compare performance across months and years to identify trends, seasonality, and areas for improvement in your business operations.
🎯 Goal Setting and Performance Comparison
Set specific targets for each KPI and compare actual performance against those goals, ensuring that your travel business is meeting or exceeding expectations.
🛠 Customizable Inputs
Easily input data such as bookings, revenue, customer feedback, and marketing campaign results, while customizing the dashboard to suit your travel business’s needs.
🔔 Conditional Formatting Alerts
Get real-time alerts using color-coded indicators to highlight areas that require attention, such as low booking numbers, low occupancy rates, or poor customer feedback.
🌍 Booking and Revenue Insights
Gain deeper insights into bookings, revenue generation, and the effectiveness of marketing campaigns, helping you improve pricing strategies and customer acquisition efforts.
🚀 Why You’ll Love the Travel & Tourism KPI Dashboard in Excel:
✅ Track Sales Performance – Monitor booking volumes, revenue, and occupancy rates to optimize pricing strategies and increase sales.
✅ Boost Marketing ROI – Measure the effectiveness of your marketing campaigns by tracking metrics such as cost-per-booking, lead conversion rates, and advertising spend.
✅ Enhance Customer Experience – Track customer satisfaction levels through feedback, reviews, and survey results to improve service and loyalty.
✅ Optimize Operational Efficiency – Monitor operational KPIs such as booking channels, cancellations, and customer service response times to enhance overall business efficiency.
✅ User-Friendly Interface – The dashboard is easy to use, even for those with limited technical expertise, allowing you to quickly input and analyze performance data.
✅ Fully Customizable – Tailor the dashboard to suit your specific travel or tourism business, whether you are tracking hotel bookings, tour sales, or flight bookings.
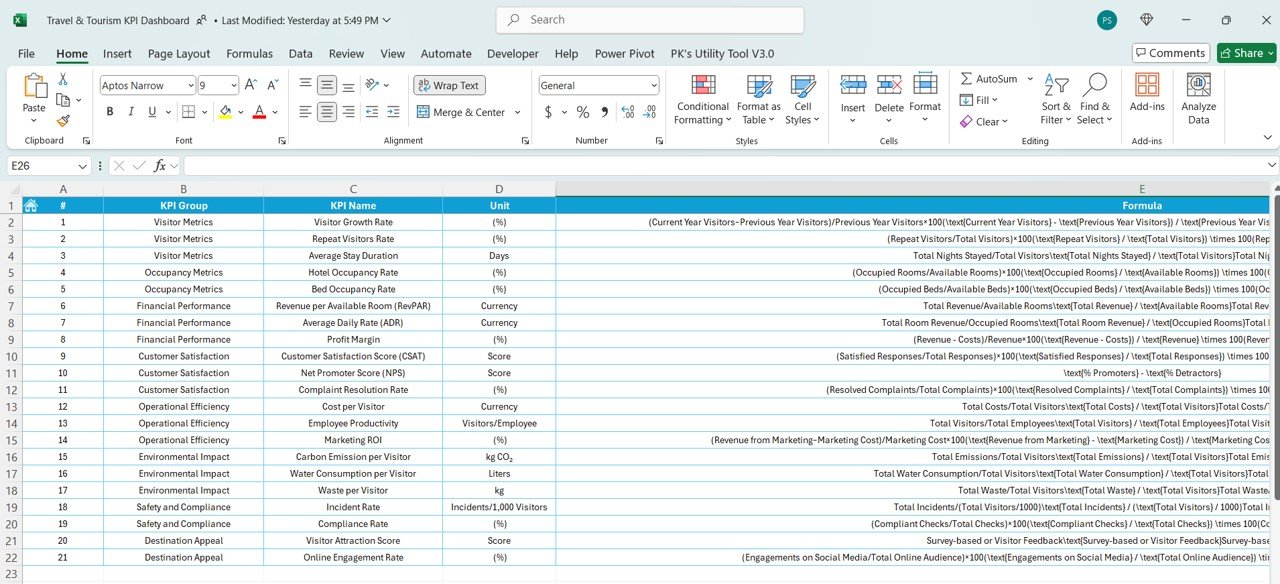
What’s Inside the Travel & Tourism KPI Dashboard in Excel:
- Booking Volume KPI: Track the number of bookings across different services, including hotels, tours, and activities.
- Revenue KPI: Monitor total revenue generated from bookings and sales, providing insights into your business’s profitability.
- Occupancy Rate KPI: Measure the percentage of available rooms, tours, or activities that have been booked to monitor utilization and demand.
- Customer Satisfaction KPI: Track customer feedback, satisfaction ratings, and reviews to measure service quality and identify areas for improvement.
- Cost-Per-Booking KPI: Calculate the cost of acquiring each booking, helping you evaluate the efficiency of your marketing and sales efforts.
- Marketing ROI KPI: Track the return on investment for marketing campaigns, including digital ads, promotions, and referral programs.
- Cancellations KPI: Measure the rate of cancellations and their impact on revenue, identifying trends or issues that need attention.
How to Use the Travel & Tourism KPI Dashboard in Excel:
1️⃣ Download the Template – Instantly access your Excel file upon purchase.
2️⃣ Input Your Business Data – Enter your booking, revenue, customer feedback, and marketing data into the provided fields.
3️⃣ Set Business Goals – Define your KPIs for bookings, revenue, and customer satisfaction to guide your operational strategies.
4️⃣ Monitor Performance – Track your travel business performance in real-time and make adjustments as needed to achieve your targets.
5️⃣ Generate Reports – Use the dashboard to generate detailed performance reports for management reviews, client meetings, or marketing evaluations.
Who Can Benefit from the Travel & Tourism KPI Dashboard in Excel:
- Travel Agencies
- Tour Operators
- Hotel Managers
- Marketing Teams
- Sales Managers
- Customer Service Teams
- Business Owners in Travel & Tourism
- Marketing Analysts
The Travel & Tourism KPI Dashboard in Excel is the ideal solution for businesses looking to track performance, optimize revenue, and enhance customer satisfaction in the travel and tourism industry.
Click here to read the Detailed blog post
https://www.pk-anexcelexpert.com/travel-tourism-kpi-dashboard-in-excel/
Visit our YouTube channel to learn step-by-step video tutorials
Youtube.com/@PKAnExcelExpert


Reviews
There are no reviews yet.