Time tracking is one of the most important activities for modern businesses. Whether you manage billable client work, internal projects, overtime, or departmental costs, accurate time tracking directly impacts revenue, profitability, and productivity. However, many organizations still rely on raw timesheets or scattered spreadsheets. As a result, tracking billable hours, overtime, costs, and margins becomes confusing and inefficient.
That is exactly why the Time Tracking Dashboard in Google Sheets becomes a powerful and business-critical solution.
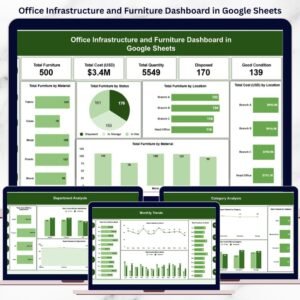
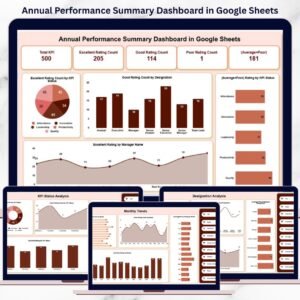
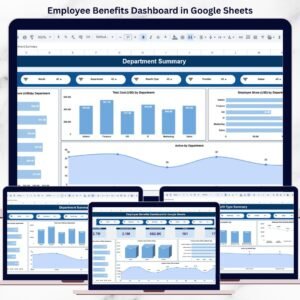
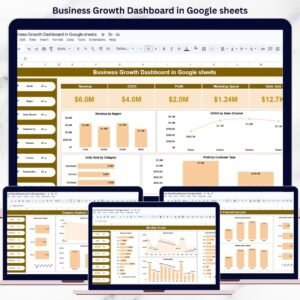
This ready-to-use dashboard converts raw time tracking data into meaningful insights. It helps organizations monitor revenue, costs, margins, billable hours, and overtime across departments, managers, roles, clients, and projects—all from one centralized Google Sheets dashboard.
Because the dashboard is built entirely in Google Sheets, it is cloud-based, collaborative, and extremely easy to use. You simply update the data input sheet, and the entire dashboard refreshes automatically—no complex setup or technical skills required.
🔑 Key Features of the Time Tracking Dashboard in Google Sheets ⏱️
📊 Complete Financial Visibility
Track Revenue (USD), Cost (USD), and Margin (USD) in one place.
⏳ Billable & Overtime Hour Tracking
Monitor billable productivity and overtime impact accurately.
🧩 Multi-Dimensional Analysis
Analyze performance by Department, Manager, Role, Client, and Project.
📈 Trend-Based Insights
Identify monthly performance patterns with trend charts.
⚡ Auto-Refreshing Dashboard
All charts and cards update automatically when data changes.
📦 What’s Inside the Time Tracking Dashboard 📂
The dashboard is designed with a clean structure and multiple analysis sections for clear decision-making.
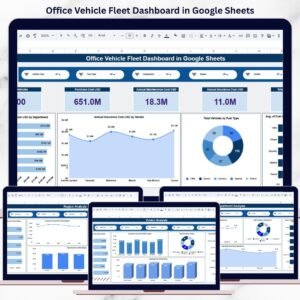
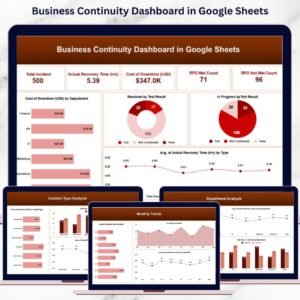
🧭 Overview Sheet Tab – Executive Summary
This is the main landing page of the dashboard where leadership gets an instant snapshot of time and cost performance.
🔢 KPI Cards Included
-
💰 Revenue (USD)
-
💸 Cost (USD)
-
📊 Margin (USD)
-
⏱️ Billable Hours
-
🚨 Overtime Hours
These cards give immediate visibility into financial health and workforce utilization.
📊 Charts on Overview Page
-
Pending Count by Task Category
-
Rejected Count by Task Category
-
Revenue (USD) by Client
-
Revenue (USD) by Project
-
Rejected Count by Task Month
These visuals help identify workflow bottlenecks, client contribution, and task-level issues.
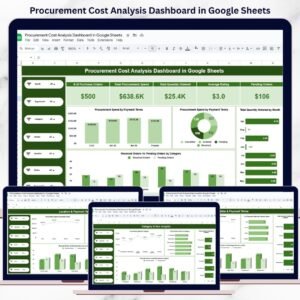
🏢 Department Analysis – Performance by Teams
This section evaluates how each department performs financially and operationally.
📊 Charts Included
-
Revenue (USD) by Department
-
Cost (USD) by Department
-
Billable Hours by Department
-
Overtime Hours by Department
It helps management identify high-performing teams and departments with cost or overtime issues.
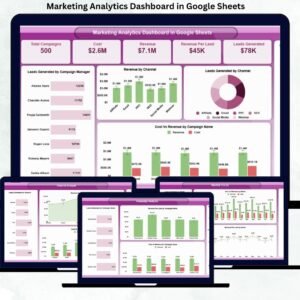
👨💼 Manager Analysis – Leadership Performance
This section analyzes workload and financial contribution at the manager level.
📊 Charts Included
-
Revenue (USD) by Manager
-
Cost (USD) by Manager
-
Billable Hours by Manager
-
Overtime Hours by Manager
It supports fair workload distribution, accountability, and leadership performance review.
🧑💻 Role Analysis – Productivity by Job Role
Understand how different roles contribute to revenue and costs.
📊 Charts Included
-
Revenue (USD) by Role
-
Cost (USD) by Role
-
Billable Hours by Role
-
Overtime Hours by Role
This analysis helps HR and operations teams optimize staffing and role utilization.
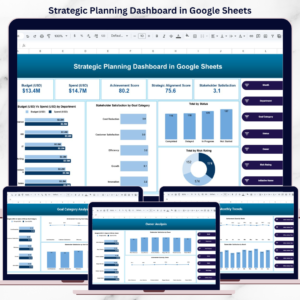
📅 Monthly Trends – Time & Cost Over Time
This section highlights time-based performance trends.
📊 Charts Included
-
Revenue (USD) by Month
-
Cost (USD) by Month
-
Billable Hours by Month
-
Overtime Hours by Month
These trends help forecast workload, plan resources, and control overtime.
🗂️ Data Input Sheet Tab – Simple & Flexible
This sheet acts as the data foundation of the dashboard.
You enter all time tracking records here, and the dashboard updates automatically.
👥 Who Can Benefit from This Dashboard 🎯
-
Consulting Firms
-
IT & Software Companies
-
Professional Service Providers
-
Project Managers
-
HR & Finance Teams
-
Business Owners & Leadership
📈 Best Practices for Using the Dashboard
-
Update time tracking data regularly
-
Review overtime trends weekly
-
Monitor margins monthly
-
Share insights with department heads
-
Use trends for capacity planning
### Click here to read the Detailed blog post
Watch the step-by-step video tutorial:


Reviews
There are no reviews yet.