

Ticket Resolution Time KPI Dashboard in Excel – Your Complete Customer Service Performance Tool 🚀
In today’s fast-paced digital world, customers expect quick solutions. Every delayed ticket increases frustration and reduces loyalty. That’s why Ticket Resolution Time has become one of the most critical customer service metrics. To track, analyze, and improve it, we’ve designed a ready-to-use Ticket Resolution Time KPI Dashboard in Excel—a smart solution for teams that want clarity, speed, and efficiency.
With this dashboard, you can measure performance, monitor targets, and take immediate action—all without relying on complicated software. Everything is structured, interactive, and customizable to fit your business needs.
✨ Key Features of Ticket Resolution Time KPI Dashboard in Excel
-
📊 All-in-One Dashboard: Consolidates ticket-related KPIs in one place.
-
📅 Month & Year Selection: Instantly switch between MTD (Month-to-Date) and YTD (Year-to-Date).
-
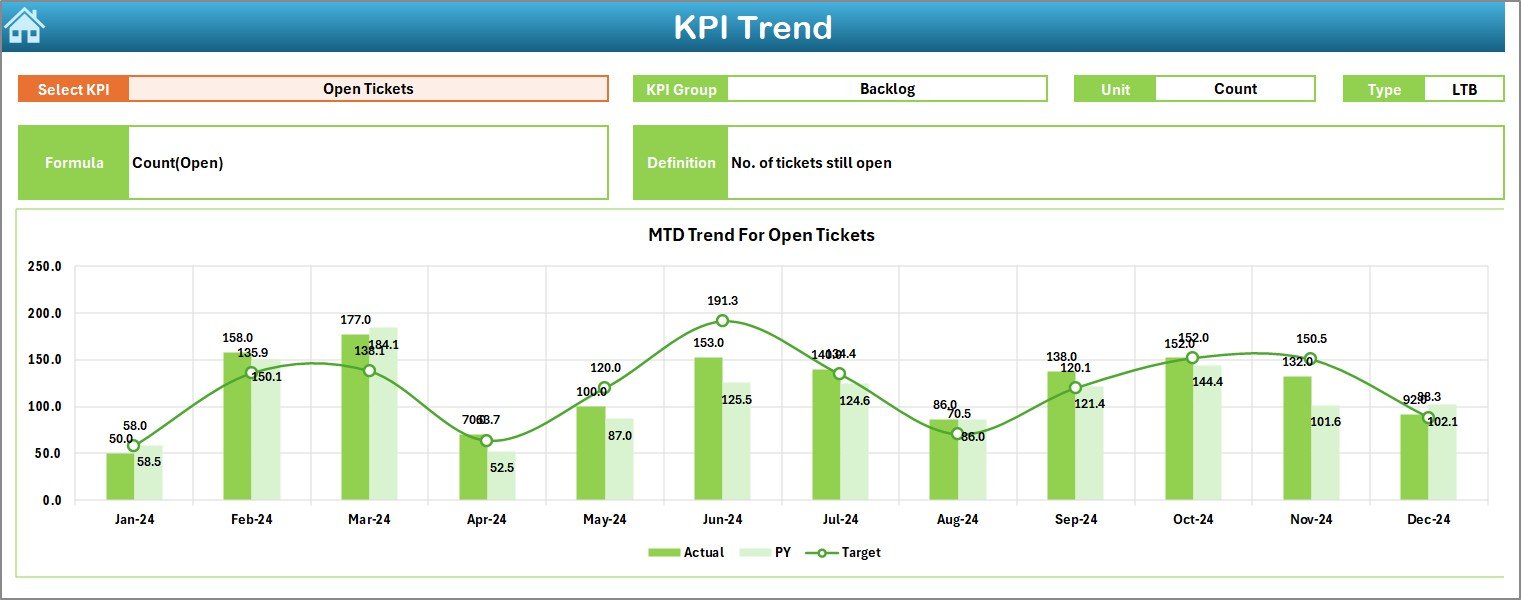
📈 Dynamic Charts: Track trends, spot delays, and identify improvements visually.
-
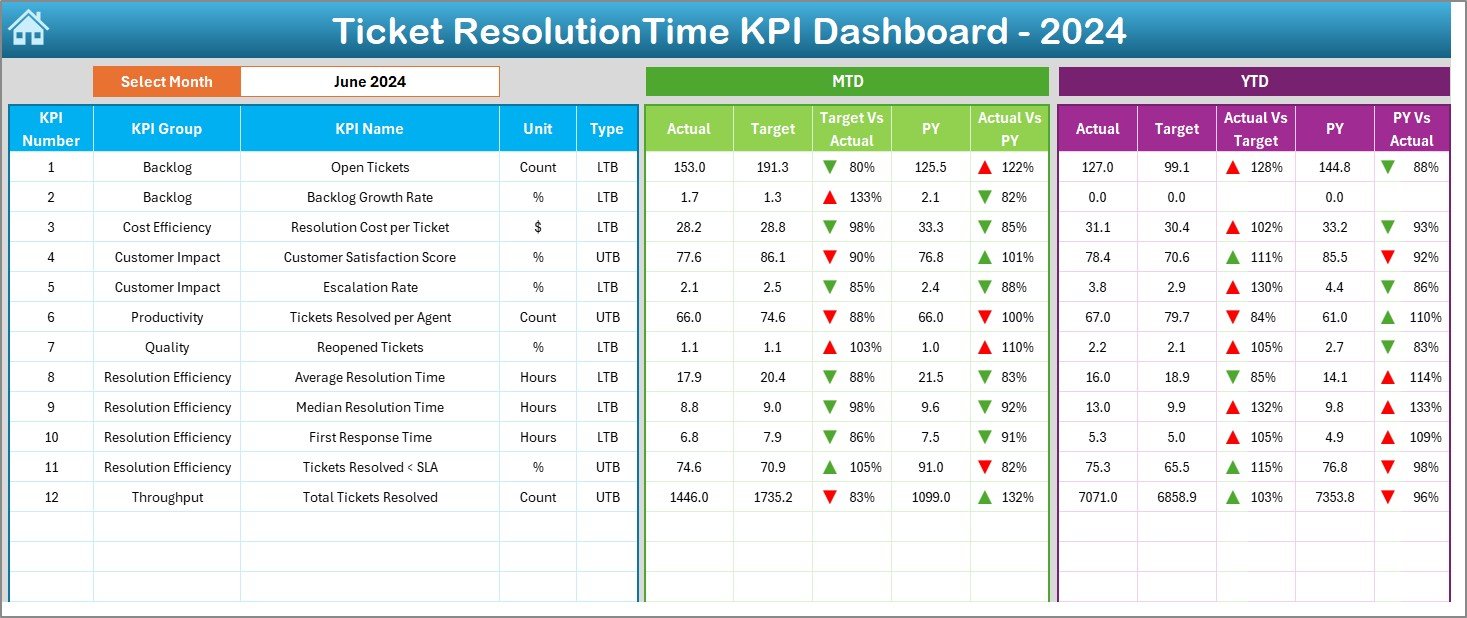
🔄 Comparison Metrics: Evaluate Actual vs. Target vs. Previous Year performance.
-
🖱️ Easy Navigation: User-friendly Home sheet with quick buttons to jump across tabs.
-
🎯 Standardized KPIs: Each KPI defined clearly with formula, unit, and type (UTB/LTB).
-
📥 Data Entry Simplified: Input actuals, targets, and past numbers directly in structured sheets.
-
✅ Conditional Formatting: Up/down arrows highlight progress instantly.
📦 What’s Inside the Ticket Resolution Time KPI Dashboard
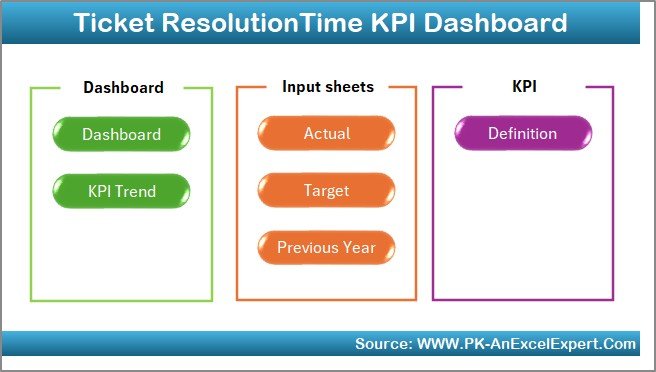
This Excel product is organized into 7 powerful sheets, each serving a unique purpose:
-
Home Sheet – A navigation hub with quick-access buttons.
-
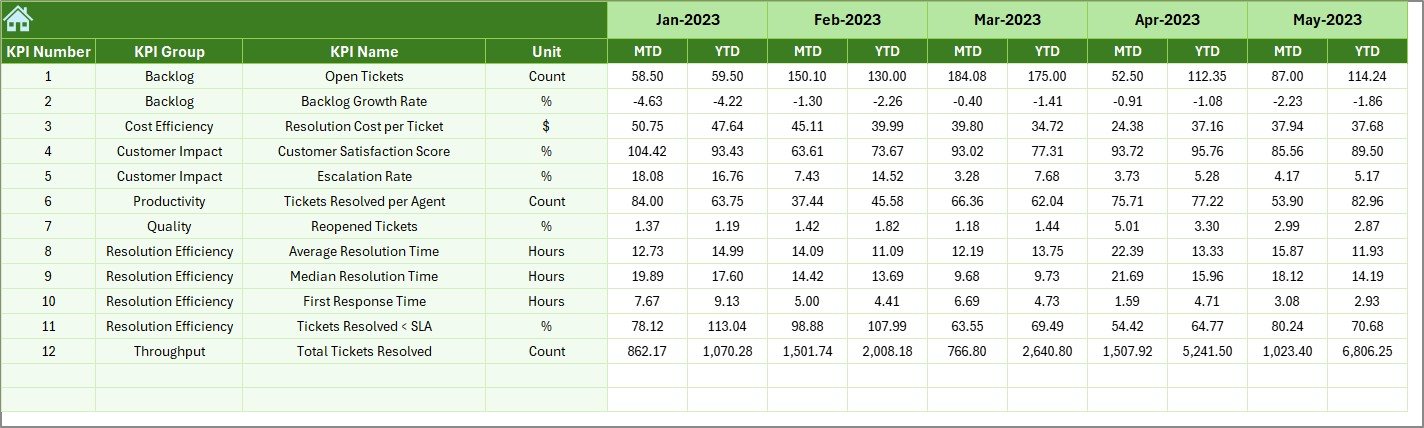
Dashboard Sheet – The main control center showing KPI cards, charts, and comparisons.
-
KPI Trend Sheet – View long-term performance trends by KPI.
-
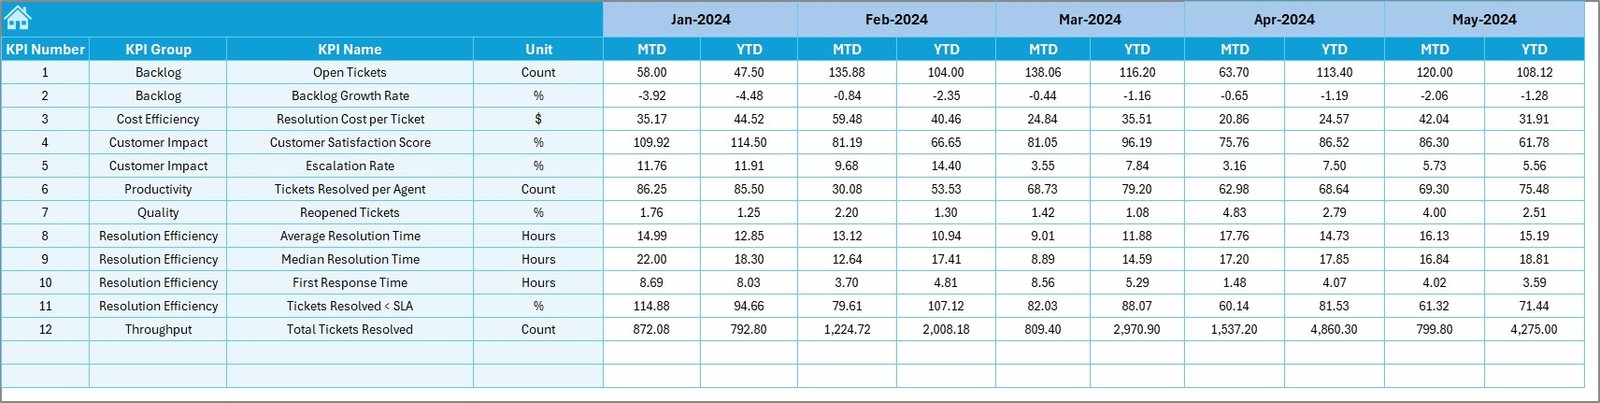
Actual Numbers Input Sheet – Enter your current data to feed the dashboard.
-
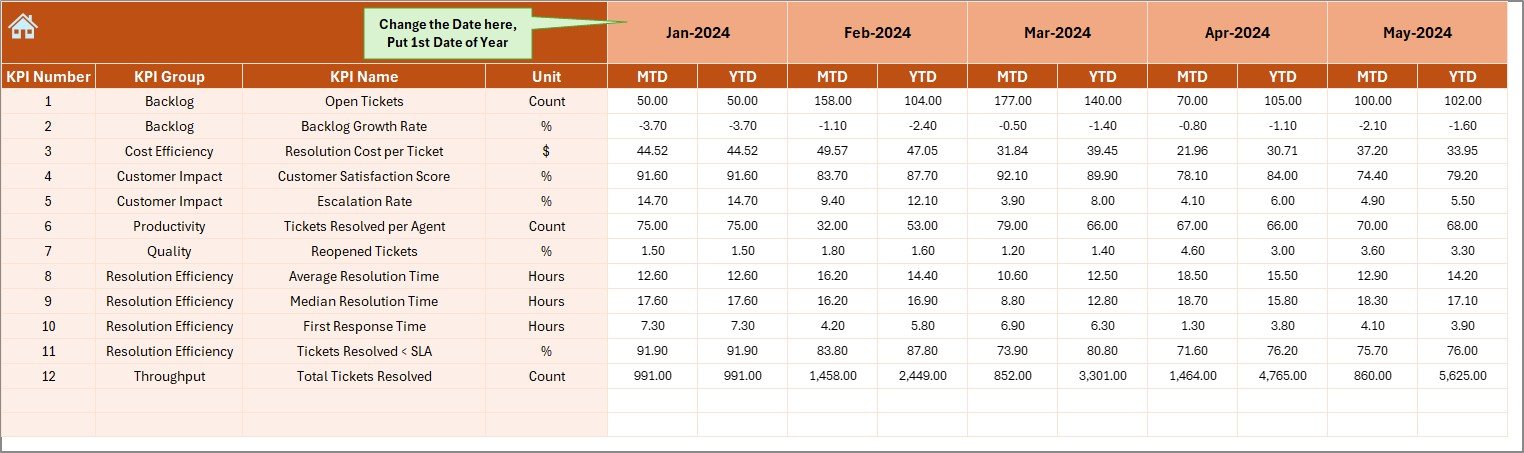
Target Sheet – Define your monthly and yearly service goals.
-
Previous Year Number Sheet – Store last year’s figures for YoY comparisons.
-
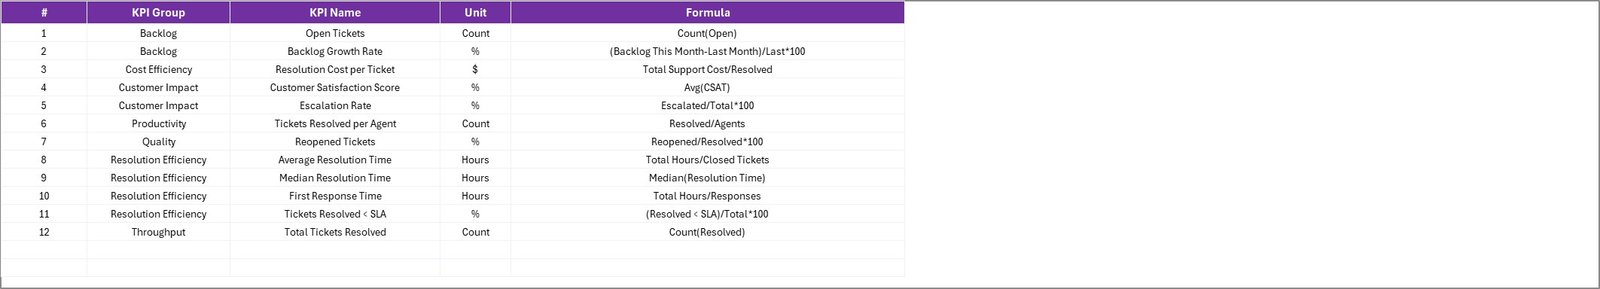
KPI Definition Sheet – A library of all KPI names, groups, units, formulas, and definitions.
Everything is pre-designed, automated, and ready for use. You just need to plug in your data!
🛠️ How to Use the Ticket Resolution Time KPI Dashboard
-
Step 1: Open the Home sheet and use the buttons to access different views.
-
Step 2: Input your actual ticket data into the Actual Numbers Input sheet.
-
Step 3: Set your targets in the Target sheet.
-
Step 4: Add last year’s data for instant YoY comparison.
-
Step 5: Use the Dashboard sheet to analyze MTD, YTD, and trend performance.
-
Step 6: Share insights with your team and make data-driven decisions.
No technical skills required—everything runs automatically with Excel formulas and conditional formatting.
👥 Who Can Benefit from This Dashboard?
This dashboard is designed for any organization that values customer satisfaction and efficiency. It’s ideal for:
-
🛒 E-commerce Companies: Monitor order issues, refunds, and complaint resolution times.
-
🏥 Healthcare Providers: Track patient support query handling times.
-
💳 Banks & Financial Institutions: Manage loan or account service ticket turnaround times.
-
📡 Telecom Operators: Ensure fast response to billing or connectivity complaints.
-
🎓 Educational Institutions: Resolve IT and administrative support tickets for staff and students.
-
👨💼 SMEs & Startups: Even small teams can track KPIs without investing in expensive BI tools.
🎯 Why Choose This Product?
By using the Ticket Resolution Time KPI Dashboard in Excel, you’ll:
-
Improve customer experience through faster resolutions.
-
Save hours of manual reporting with auto-updates.
-
Gain real-time clarity on service efficiency.
-
Reduce bottlenecks and improve SLA compliance.
-
Empower your managers with visual, accurate, and actionable insights.
🔗 Click here to read the Detailed blog post
Watch the step-by-step video tutorial:


Reviews
There are no reviews yet.