


Running a theme park successfully requires more than just thrilling rides and happy visitors. You need to monitor performance across multiple areas—attendance, ticket sales, staff efficiency, ride utilization, and guest satisfaction. That’s where the Theme Park KPI Dashboard in Google Sheets becomes your ultimate companion.
This ready-to-use, cloud-based dashboard transforms raw numbers into clear visuals and actionable insights. Designed specifically for amusement and entertainment parks, it helps managers keep operations smooth, costs under control, and visitors delighted. Whether you manage a single park or multiple locations, this dashboard gives you real-time visibility into your most important Key Performance Indicators (KPIs).Theme Park KPI Dashboard in Google Sheets.
✨ Key Features of Theme Park KPI Dashboard in Google Sheets
✅ All-in-One Dashboard – Track attendance, revenue, ride performance, and guest satisfaction from one central hub.
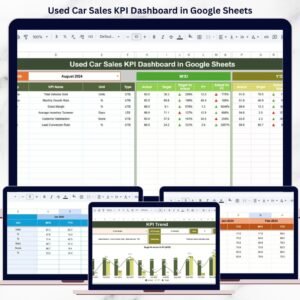
✅ Interactive Monthly Selector – Choose a month from the dropdown menu (cell D3) to see MTD and YTD insights instantly.
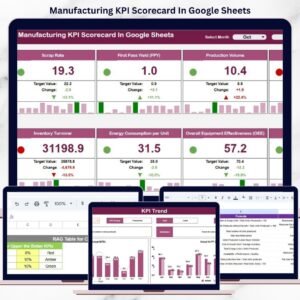
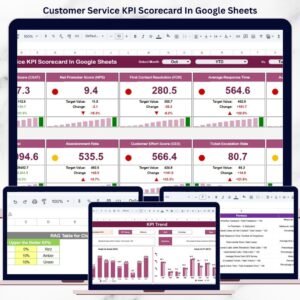
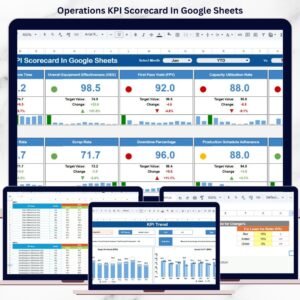
✅ Real-Time Comparisons – Actual vs Target vs Previous Year performance with visual up/down arrows.
✅ Cloud-Based Collaboration – Managers, finance, operations, and guest services can work on the same file anytime, anywhere.
✅ Cost-Effective & Scalable – No need for expensive BI tools; Google Sheets adapts as your park grows.
✅ Customizable KPIs – Add or modify KPIs to match your park’s unique goals and requirements.
✅ Performance Insights – Quickly spot whether you’re ahead or behind business targets.Theme Park KPI Dashboard in Google Sheets
📂 What’s Inside the Theme Park KPI Dashboard
This dashboard template includes six dedicated worksheet tabs:
-
Dashboard Sheet Tab – A one-stop view of all MTD and YTD KPIs with dynamic charts and conditional formatting.
-
Trend Sheet Tab – Select any KPI to see detailed formulas, definitions, and performance trends over time.
-
Actual Numbers Input Sheet – Enter real MTD and YTD data. Flexible setup with a starting month option (cell E1).
-
Target Sheet Tab – Define your monthly and yearly goals for accurate performance tracking.
-
Previous Year Numbers Sheet – Store historical values to compare current vs past results.
-
KPI Definition Sheet – A complete reference of KPI names, formulas, units, and definitions to ensure clarity across teams.
🛠️ How to Use the Theme Park KPI Dashboard
-
Enter Actual Data – Use the Actual Numbers Input Sheet to record attendance, ticket sales, and other KPIs.
-
Set Targets – Add monthly and annual goals in the Target Sheet.Theme Park KPI Dashboard in Google Sheets
-
Compare with History – Input previous year’s performance to benchmark progress.
-
Monitor KPIs – Switch between months in the Dashboard Sheet to instantly track performance.
-
Analyze Trends – Use the Trend Sheet to study seasonality, growth patterns, or performance dips.
-
Collaborate in Real Time – Share the sheet with your team to update and review together.
In just a few steps, you’ll be turning raw data into actionable insights—without needing advanced technical skills.
👥 Who Can Benefit from This Dashboard?
🎡 Theme Park Owners – Get a bird’s-eye view of overall business health.
🎟️ Operations Managers – Track ride utilization, wait times, and efficiency.
💰 Finance Teams – Monitor revenue, costs, and profit margins.
📢 Marketing Teams – Identify seasonal trends to plan campaigns and offers.
🙋 Guest Services – Improve satisfaction scores by addressing real-time feedback.
A Theme Park KPI Dashboard in Google Sheets is more than just a reporting tool—it’s your digital control center. By centralizing all metrics in one place, offering real-time insights, and enabling collaboration, this dashboard ensures that your theme park operates efficiently while keeping guests happy and safe.


Reviews
There are no reviews yet.