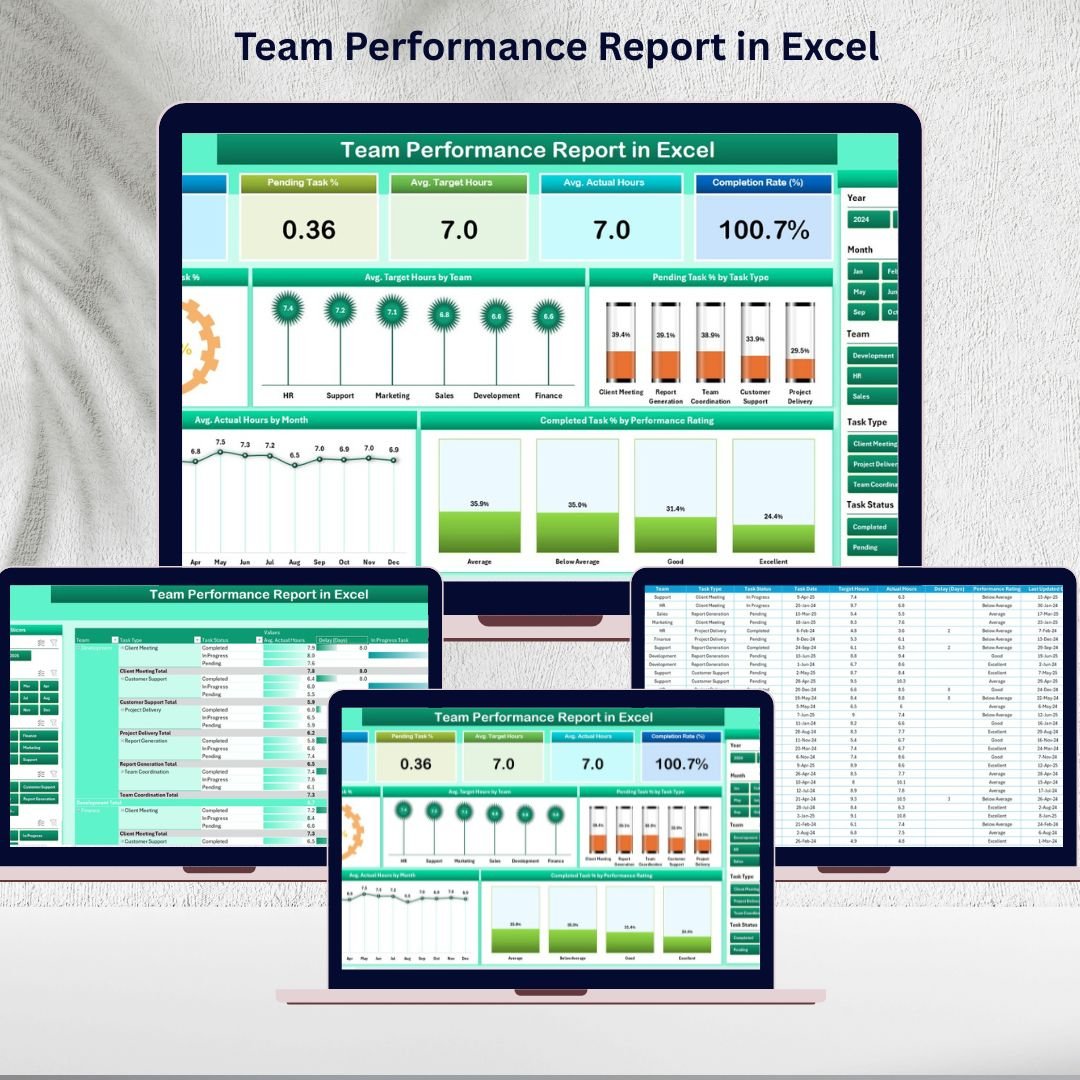
👥 Teamwork is the backbone of organizational success. But without a structured system to track and evaluate performance, managers often struggle to understand productivity, efficiency, and results. The Team Performance Report in Excel solves this challenge by offering a clear, flexible, and professional way to monitor team performance. 🚀
This ready-to-use template consolidates KPIs, tasks, hours, and ratings into one interactive Excel file. With dashboards, slicers, charts, and detailed reports, it provides actionable insights for managers, team leaders, and HR professionals.
🌟 Key Features of the Team Performance Report in Excel
-
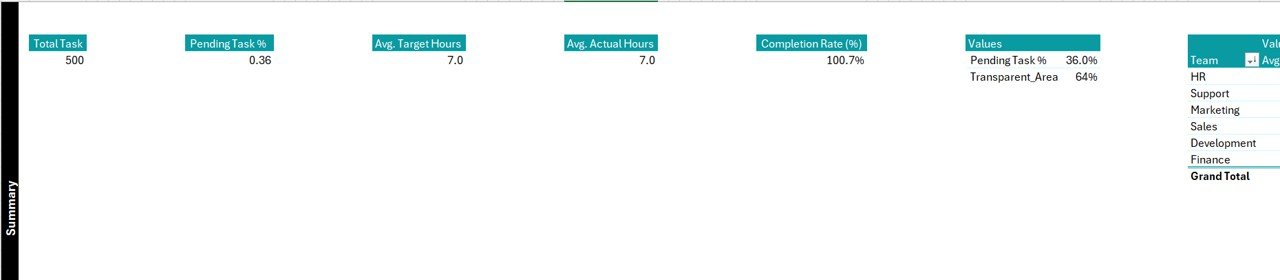
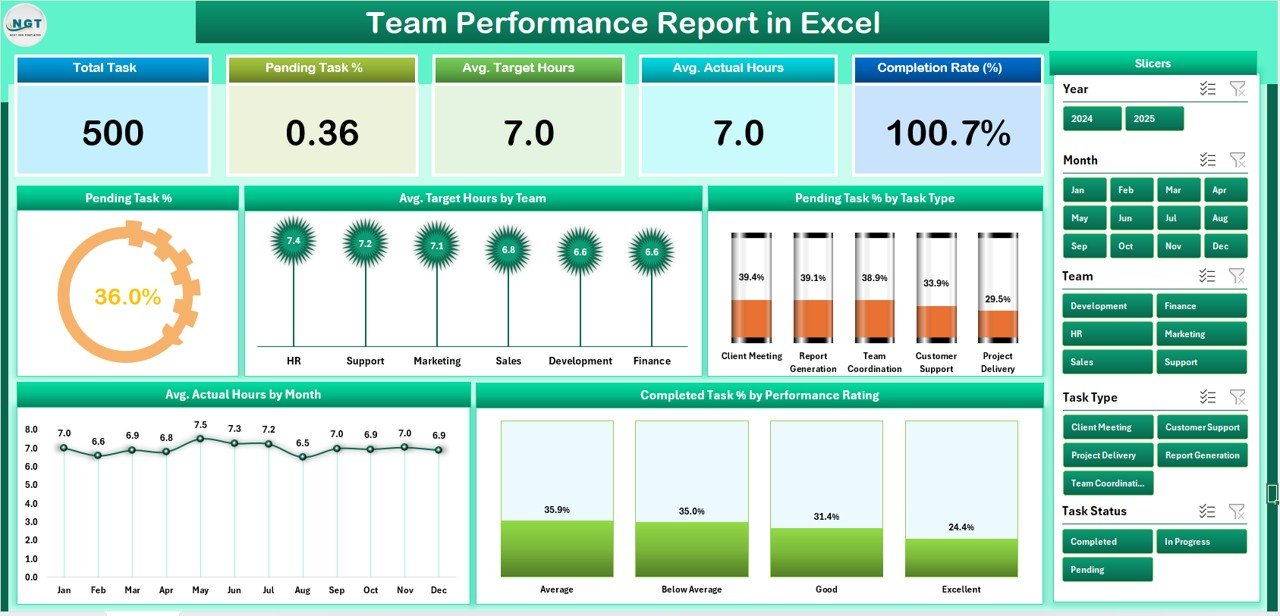
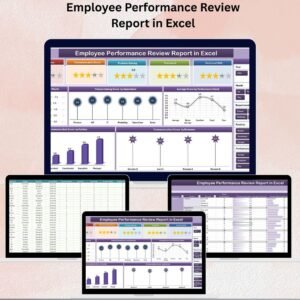
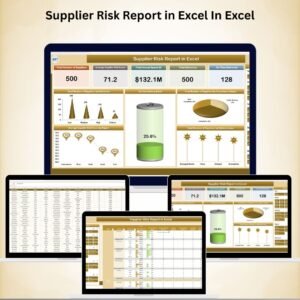
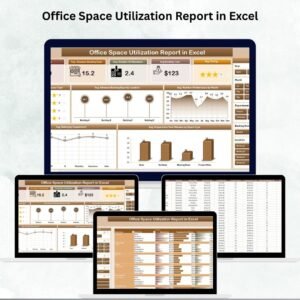
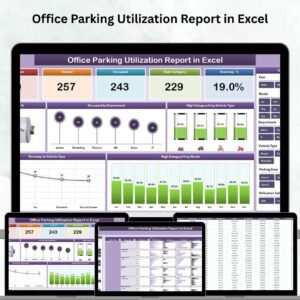
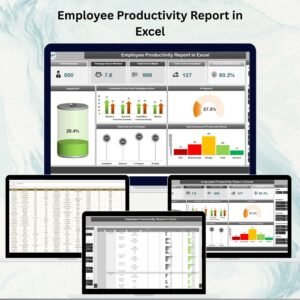
📊 Summary Page (Main Dashboard):
-
5 KPI cards: total tasks, completed tasks, pending tasks, average hours, and performance rating.
-
Right-side slicers: filter by team, department, month, or task type.
-
Charts include:
-
Pending Task %
-
Average Target Hours by Team
-
Pending Task % by Task Type
-
Average Actual Hours by Month
-
Completed Task % by Rating
-
-
-
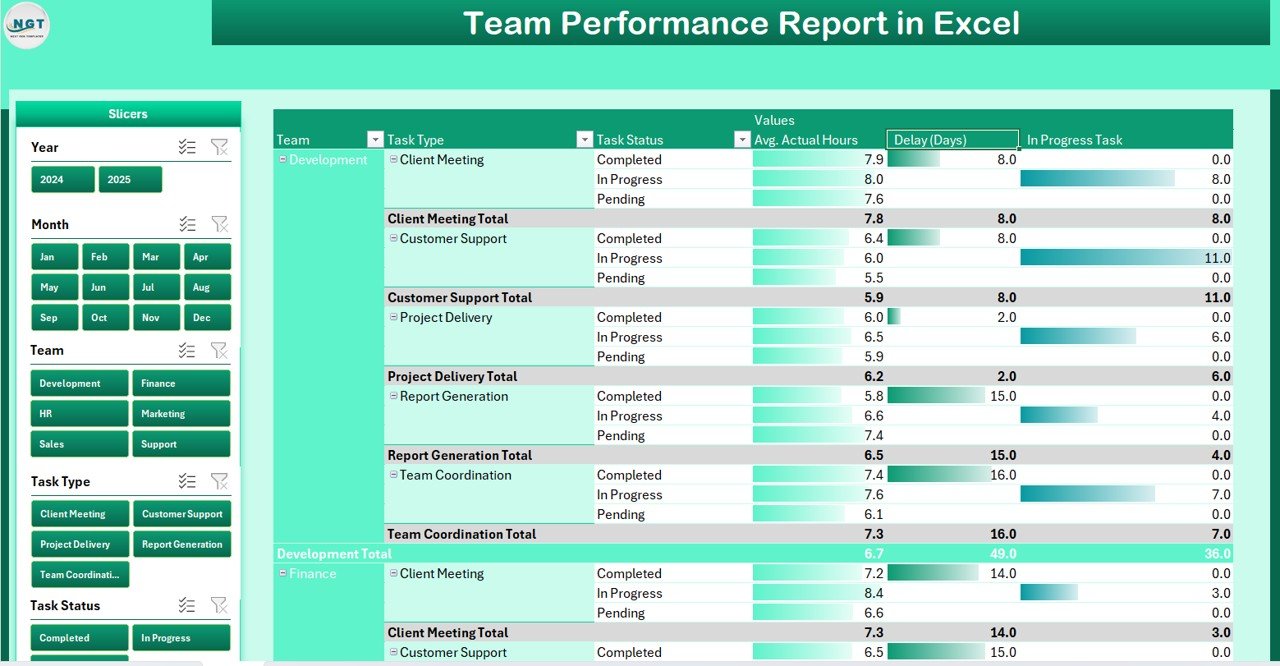
📑 Report Page (Detailed Insights):
-
Left-side slicers to filter data by project, department, or timeframe.
-
A detailed performance table showing employee name, task description, target hours, actual hours, and completion status.
-
-
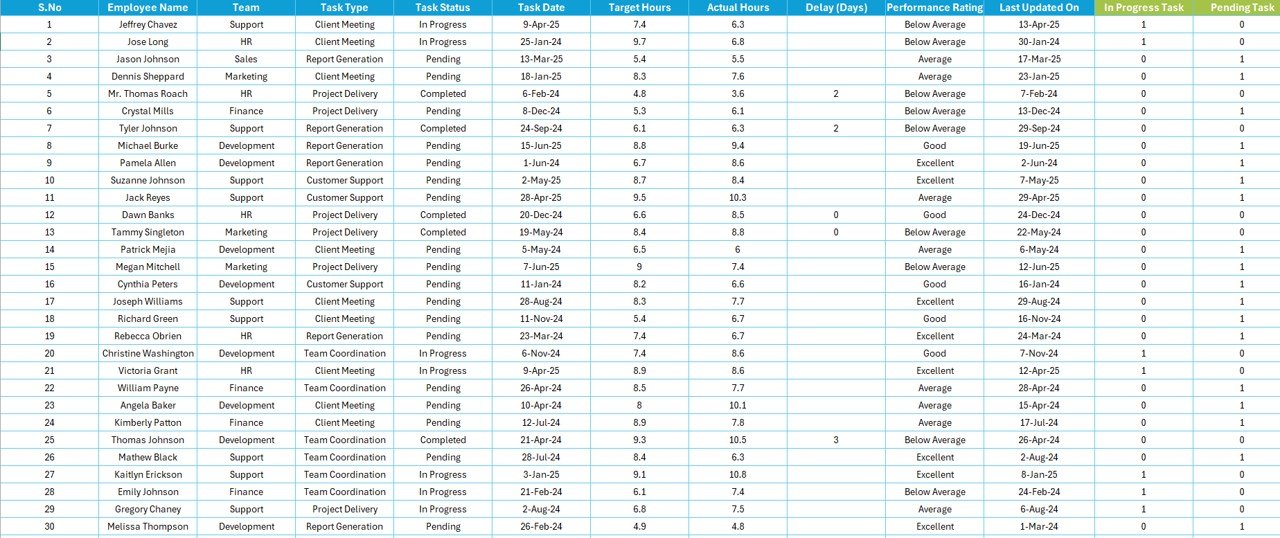
📂 Data Sheet (Data Backbone):
-
Stores raw data such as task lists, hours, completion status, and ratings.
-
Clean and structured for easy updates.
-
-
⚙️ Support Sheet (Reference Data):
-
Contains drop-down lists for task types, departments, and performance categories.
-
Ensures consistency and reduces input errors.
-
📦 What’s Inside the Report
When you download the Team Performance Report in Excel, you’ll get:
-
✅ A structured Excel template with four pages: Summary, Report, Data, and Support.
-
✅ Ready-to-use KPIs, slicers, and visuals for performance tracking.
-
✅ Clear task-level insights with drill-down capability.
-
✅ Flexible structure for custom KPIs, task types, or department names.
-
✅ Easy-to-update data sheets for ongoing performance cycles.
🛠 How to Use the Team Performance Report
-
Enter Data – Add tasks, hours, ratings, and completion details in the Data Sheet.
-
Refresh Reports – KPIs and charts automatically update.
-
Use Slicers – Filter performance by team, department, or month.
-
Analyze Results – Review pending tasks, time variances, and ratings.
-
Share Insights – Export dashboards to PDF or PowerPoint for management reviews.
💡 Designed to be user-friendly—no advanced Excel knowledge required.
👥 Who Can Benefit from This Report?
-
🧑💼 Managers & Supervisors – Monitor workload, task completion, and team productivity.
-
👩💻 HR Teams – Evaluate performance ratings and track workforce efficiency.
-
📊 Department Heads – Compare performance across different teams.
-
🏢 Small & Large Organizations – Scales easily for teams of any size.
-
🎯 Project Leaders – Track planned vs actual hours for better project control.
✅ Advantages of Using a Team Performance Report in Excel
-
Transparency – Provides visibility into tasks and progress.
-
Accountability – Assignments and completion status are clearly documented.
-
Data-Driven Decisions – Supports managers in optimizing workload distribution.
-
Employee Motivation – Recognizes achievements through ratings and completion %.
-
Customizable – Adapt KPIs and charts to fit any industry.
-
Cost-Effective – No need for expensive tools—Excel does it all.
-
Collaboration Ready – Share reports across teams or departments.
-
Real-Time Updates – Refresh with new data instantly.


Reviews
There are no reviews yet.