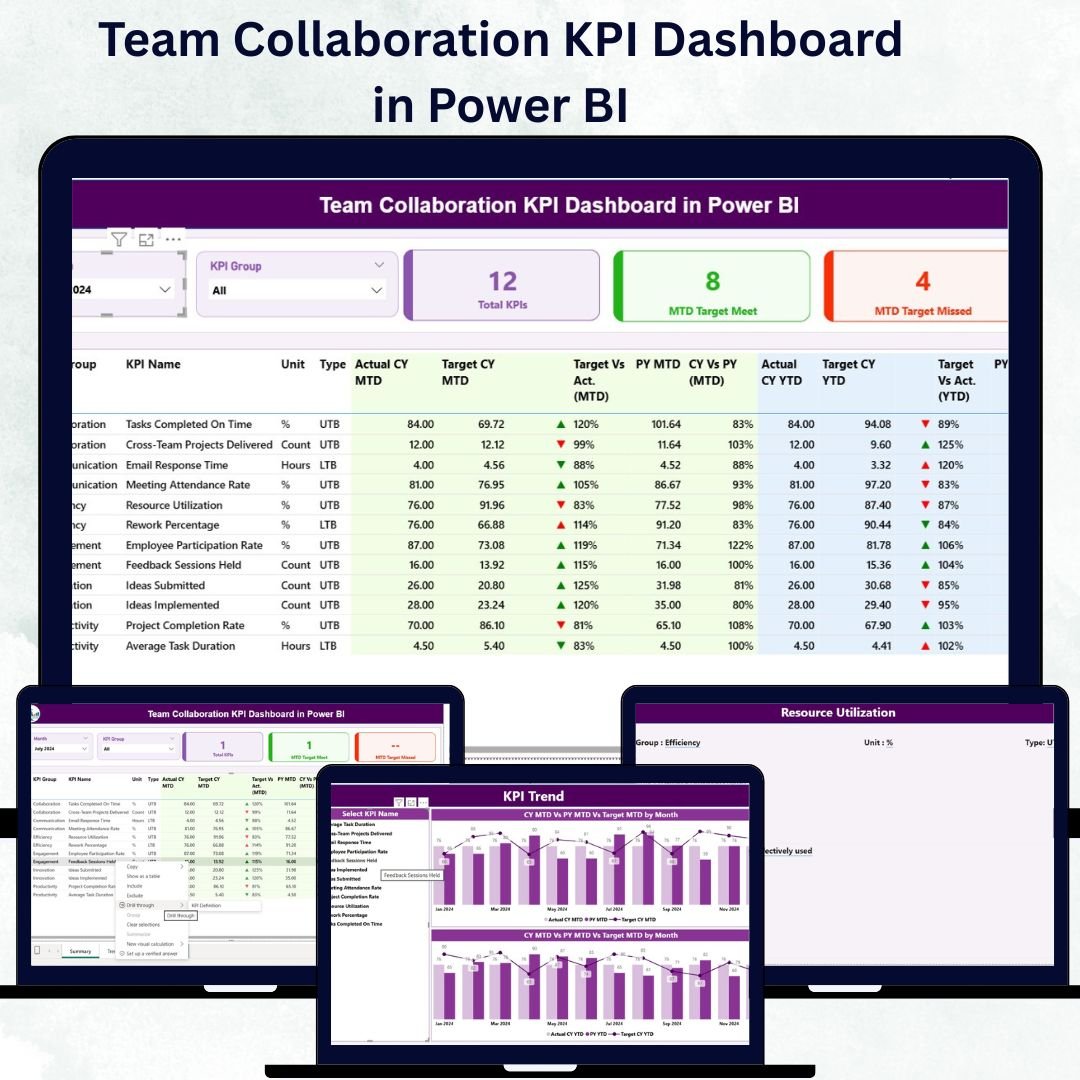
In today’s fast-moving business world, teamwork defines success. The Team Collaboration KPI Dashboard in Power BI empowers organizations to analyze, monitor, and improve team performance with ease. This ready-to-use dashboard transforms raw collaboration data into beautiful visuals and actionable insights, helping leaders measure engagement, communication, and project efficiency — all in one place. 🚀
Whether you manage a remote workforce or multiple departments, this Power BI dashboard helps you track what truly matters — how well your teams work together to deliver results.Team Collaboration KPI Dashboard in Power BI
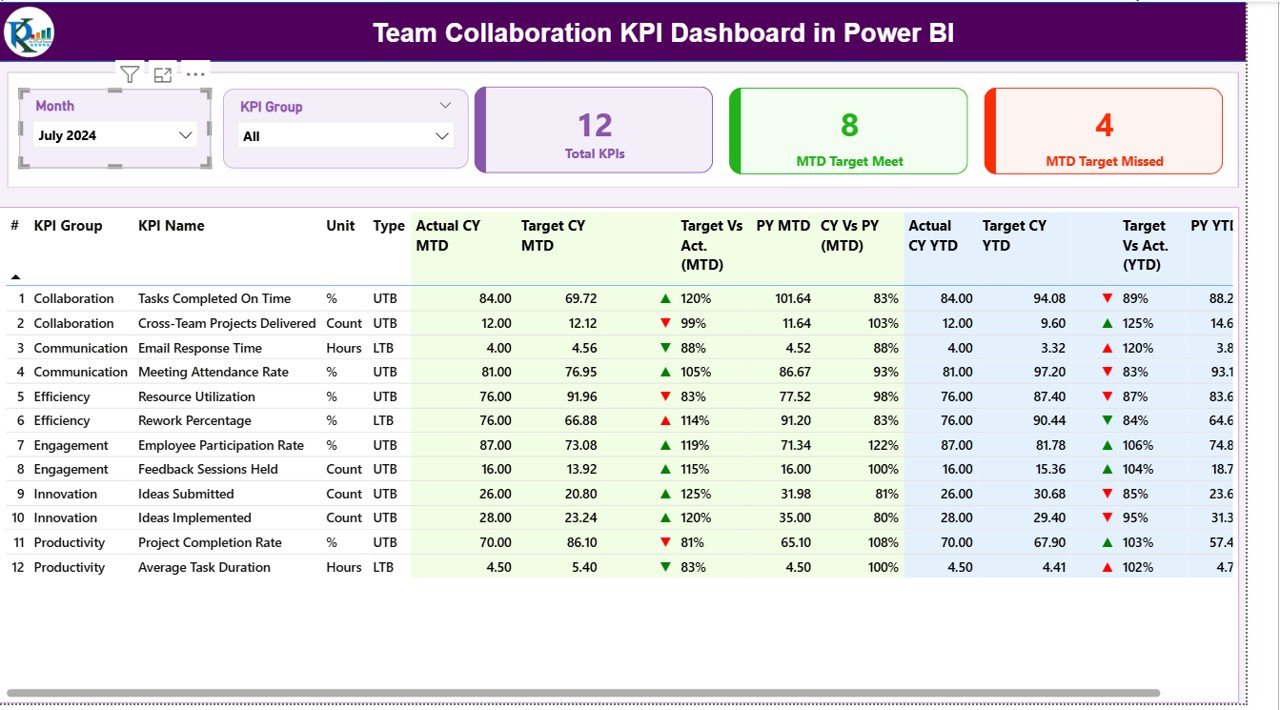
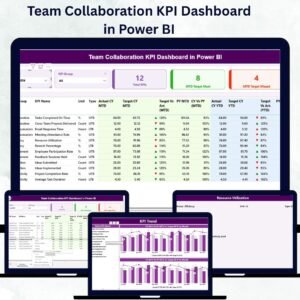
✨ Key Features of the Team Collaboration KPI Dashboard in Power BI
💡 Dynamic Filters and Slicers – Instantly filter by month or KPI group to focus on specific performance areas.
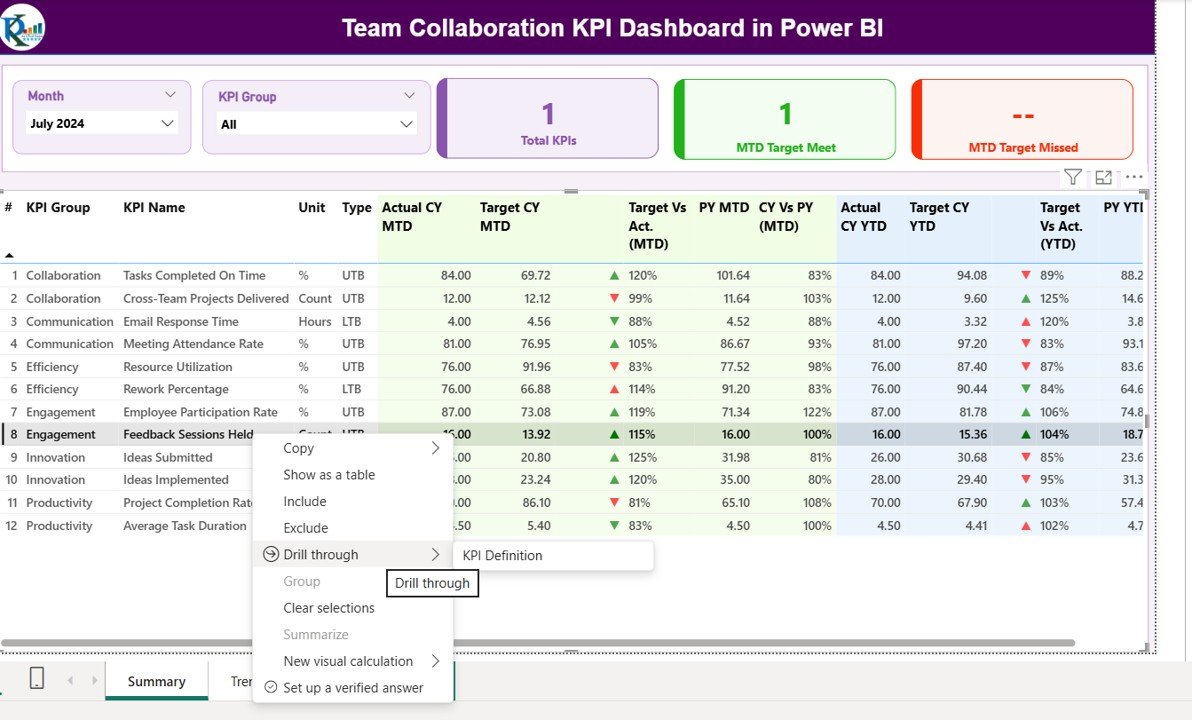
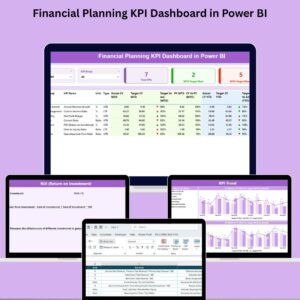
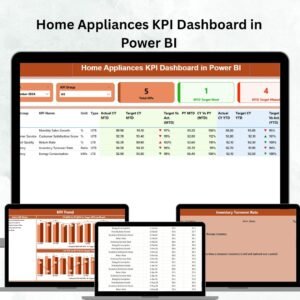
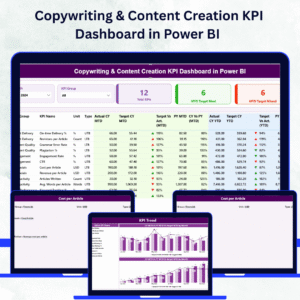
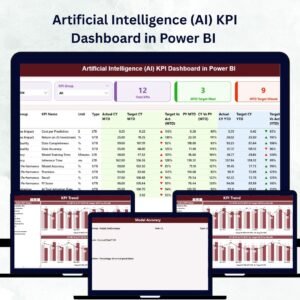
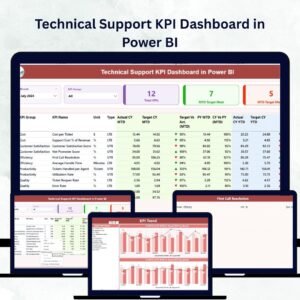
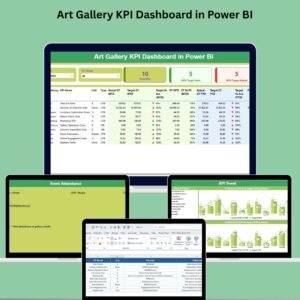
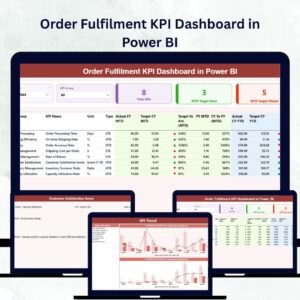
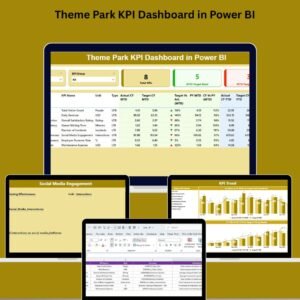
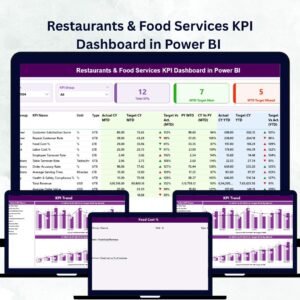
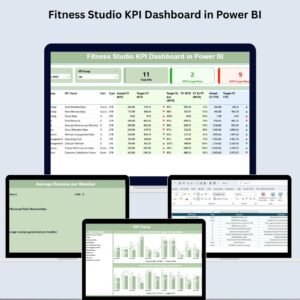
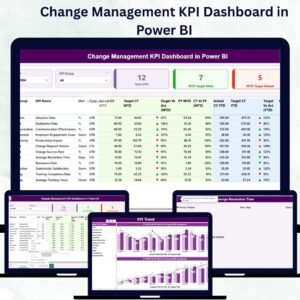
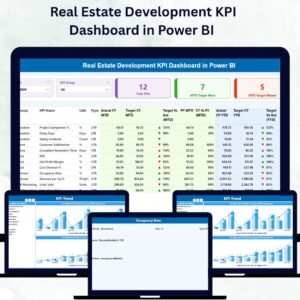
📊 Visual Performance Cards – Get at-a-glance insights into Total KPIs Count, MTD Target Met, and MTD Target Missed indicators.
📈 Comprehensive KPI Table – View key metrics such as Actual MTD, Target MTD, YTD Comparison, and Performance Icons (▲ or ▼).Team Collaboration KPI Dashboard in Power BI
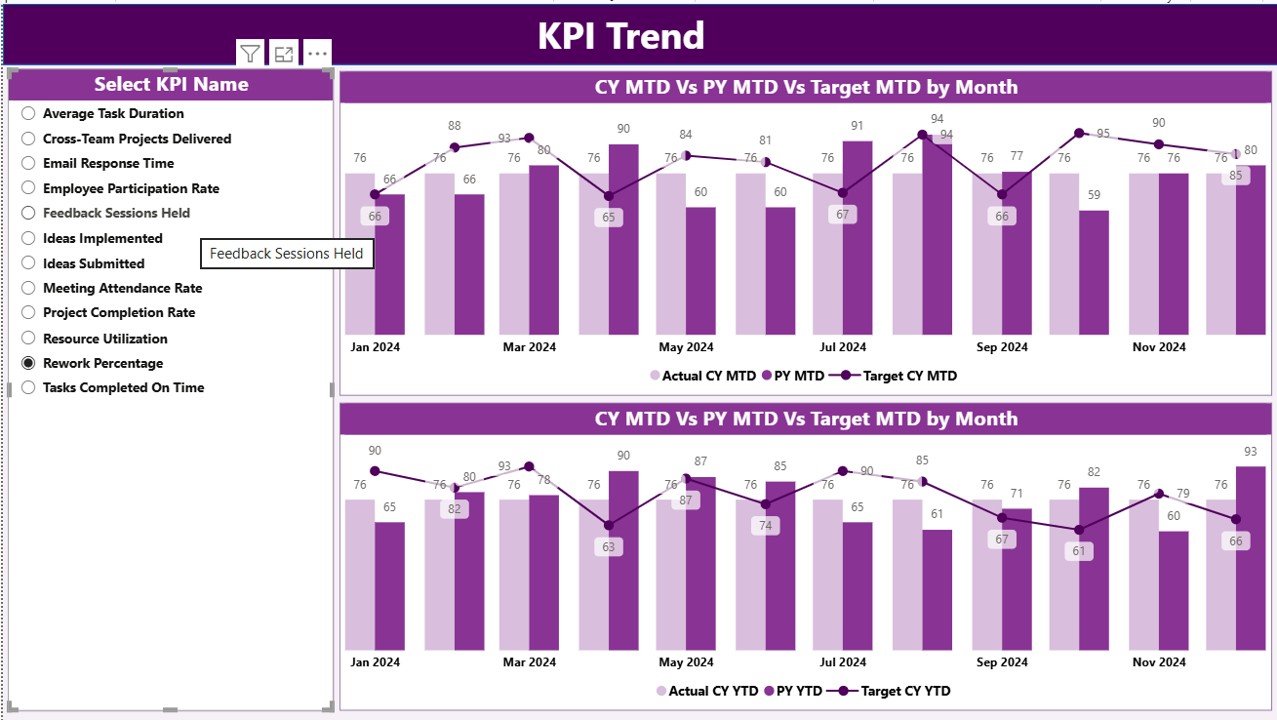
🔁 KPI Trend Page – Visualize Actual vs Target vs Previous Year data through combo charts for both MTD and YTD.
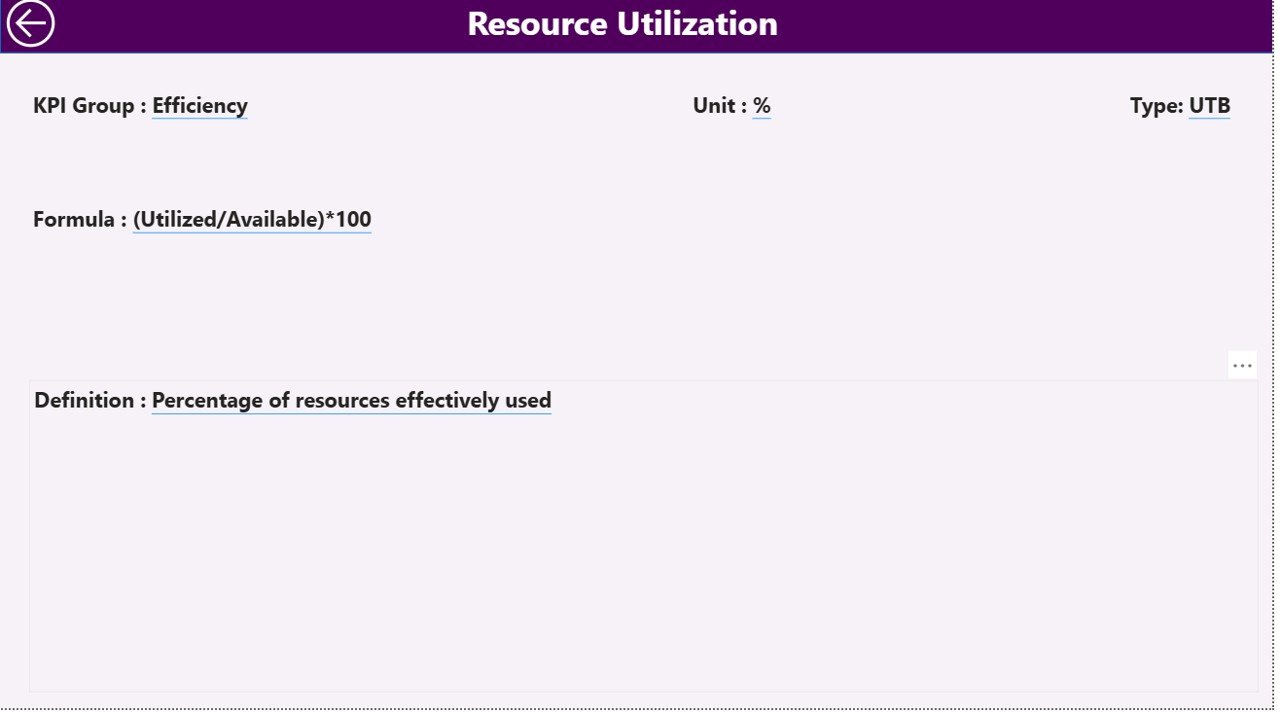
📘 KPI Definition Page – Understand each KPI’s logic, formula, and type (UTB/LTB) with an easy drill-through feature.
💾 Excel-Powered Backend – Maintain your KPIs in simple Excel sheets for Actuals, Targets, and Definitions — no coding required!
⚙️ Auto-Refresh Capabilities – Update Excel and refresh Power BI to pull in the latest metrics instantly.
🧩 Fully Customizable – Add new KPIs, adjust definitions, and connect additional departments effortlessly.
This dashboard blends simplicity with analytical depth, making it ideal for HR, operations, and project management professionals who want clear visibility over team dynamics.
📂 What’s Inside the Team Collaboration KPI Dashboard in Power BI
The dashboard file contains three interactive Power BI pages and an Excel data source with structured sheets:
1️⃣ Summary Page – The command center for collaboration.
-
Use slicers to filter by Month or KPI Group.
-
Review visual cards showing KPIs achieved vs missed.
-
Analyze detailed KPI tables with MTD, YTD, and growth metrics.
2️⃣ KPI Trend Page – Understand trends over time.
-
View combo charts (bars for targets, lines for actuals).
-
Compare performance year-over-year to measure improvement.
3️⃣ KPI Definition Page – The behind-the-scenes logic.
-
Drill-through view with KPI formula, unit, and type.
-
Helps maintain consistency and clarity in performance evaluation.
4️⃣ Excel Data Source – Three key sheets:
-
Input_Actual – Enter monthly MTD and YTD actuals.
-
Input_Target – Record target values in the same structure.
-
KPI_Definition – Define KPI name, group, unit, formula, and type.
Together, they create a seamless link between Excel and Power BI, ensuring every update reflects in real time.
🧭 How to Use the Team Collaboration KPI Dashboard in Power BI
✅ Step 1: Enter your actual, target, and definition data in Excel.
✅ Step 2: Load the Excel file into Power BI as a data source.
✅ Step 3: Refresh the dashboard to update visuals instantly.
✅ Step 4: Use slicers to explore different months or KPI groups.
✅ Step 5: Drill-through to the KPI Definition page for deeper insight.
✅ Step 6: Publish and share interactive reports via Power BI Service.Team Collaboration KPI Dashboard in Power BI
This process ensures every stakeholder — from HR to top management — can access up-to-date collaboration performance data.
👥 Who Can Benefit from This Team Collaboration KPI Dashboard
👩💼 HR Managers – Track employee engagement, communication, and teamwork participation.
👨💻 Project Managers – Evaluate task completion and delivery accuracy across teams.
🏢 Department Heads – Identify strong and weak collaboration areas to enhance productivity.
👨💼 Executives – Gain strategic insight into overall teamwork alignment.
📊 Data Analysts – Use trends to forecast future performance and recommend improvements.
From corporate offices to remote teams, this dashboard brings clarity, accountability, and transparency to teamwork measurement.
Click here to read the Detailed blog post
Watch the step-by-step video tutorial:
Visit our YouTube channel to learn step-by-step video tutorials


Reviews
There are no reviews yet.