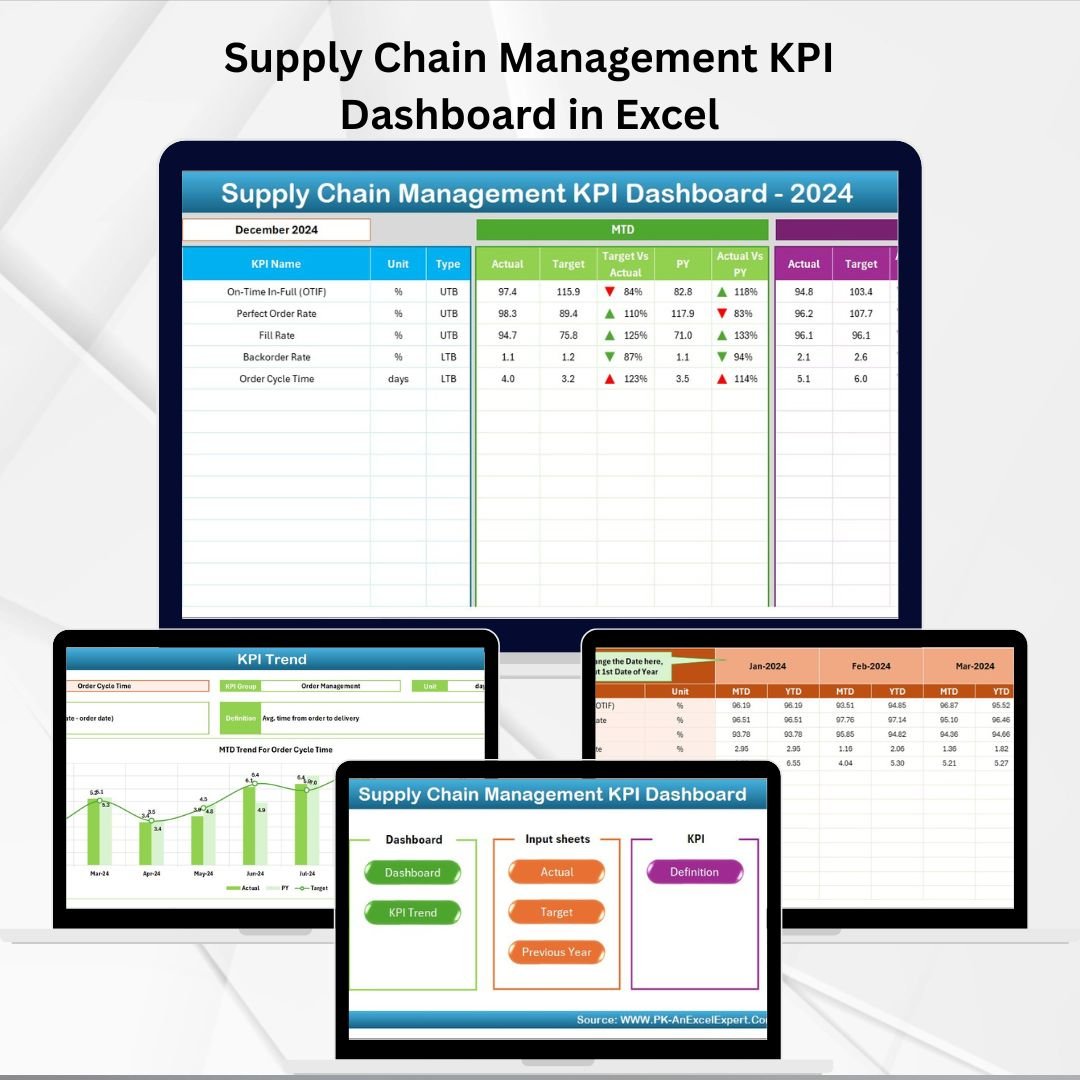
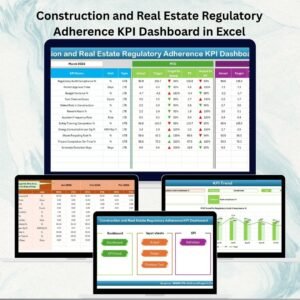
Managing a supply chain is one of the most complex tasks in business today. From sourcing raw materials to delivering products to customers, every stage requires efficiency, accuracy, and visibility. Without the right tools, businesses face delays, rising costs, or missed opportunities. That’s why we designed the Supply Chain Management KPI Dashboard in Excel — a ready-to-use, professional tool that helps organizations monitor and improve their entire supply chain 🚛📦.
This dashboard transforms raw data into actionable insights. With a clean structure, interactive visuals, and automated comparisons, it gives managers complete control over performance metrics. Whether you’re a small business or a large enterprise, this Excel dashboard ensures your supply chain remains resilient, efficient, and cost-effective.
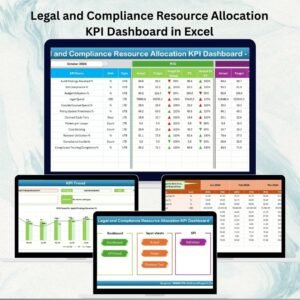
✨ Key Features of Supply Chain Management KPI Dashboard
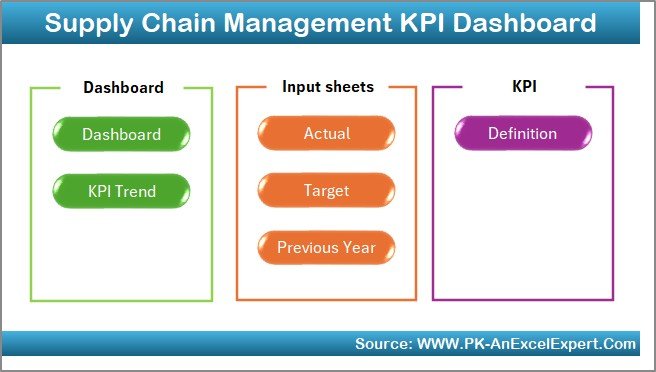
✅ 7 Pre-Built Worksheets – Includes Home, Dashboard, KPI Trend, Actual Numbers Input, Target, Previous Year, and KPI Definition.
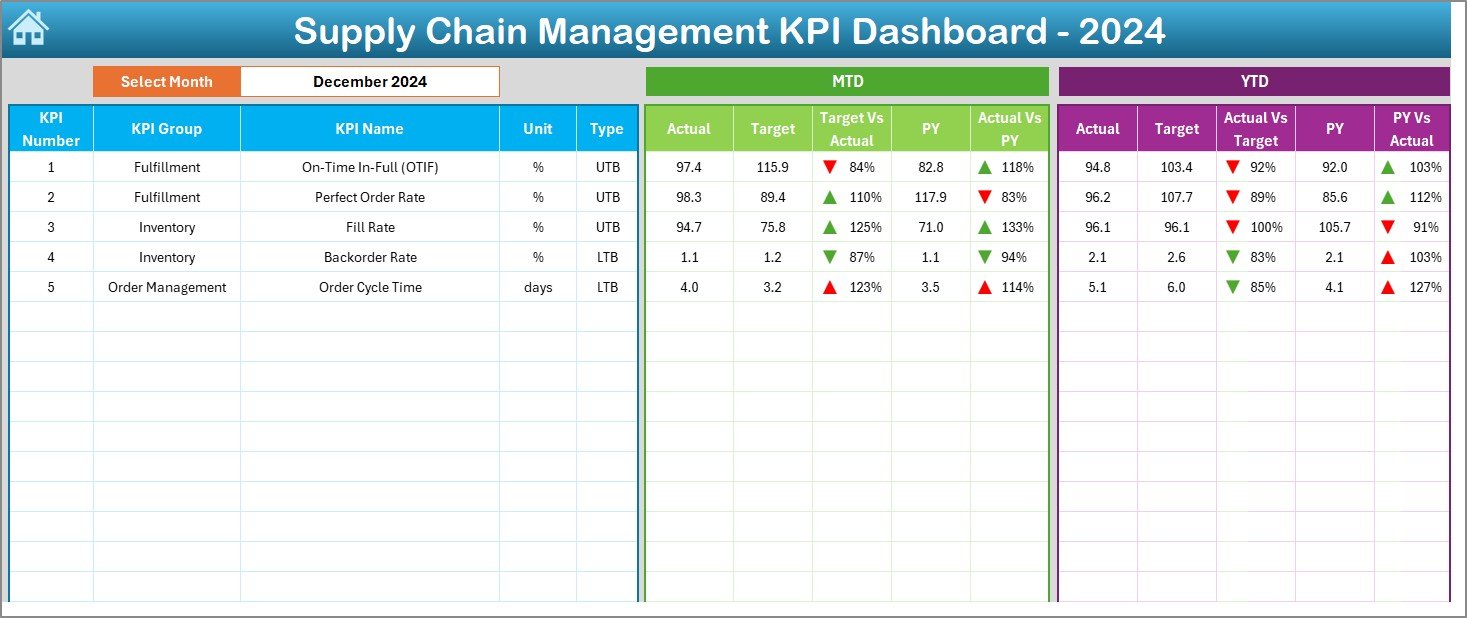
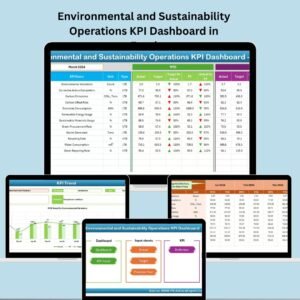
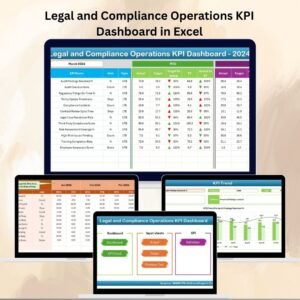
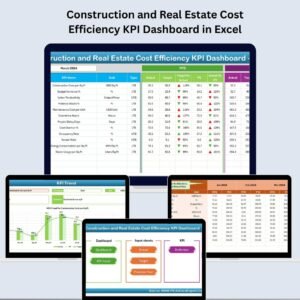
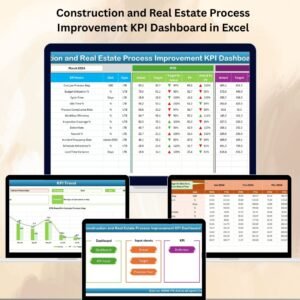
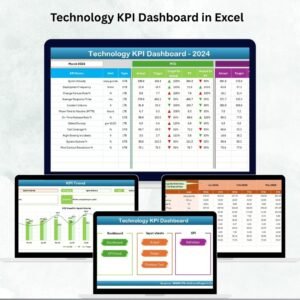
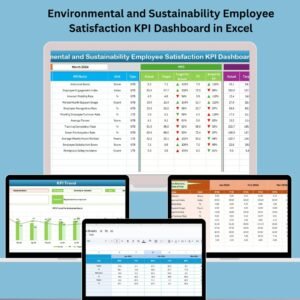
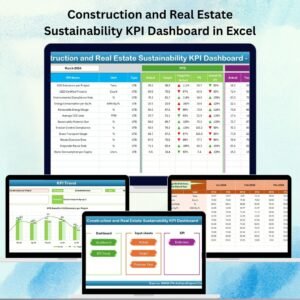
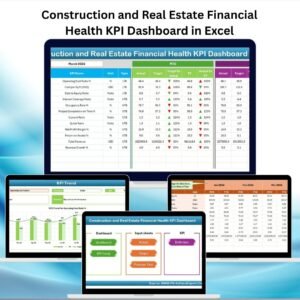
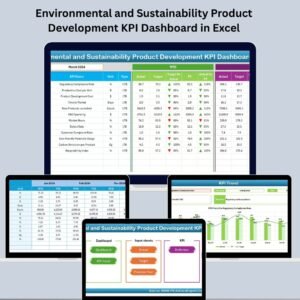
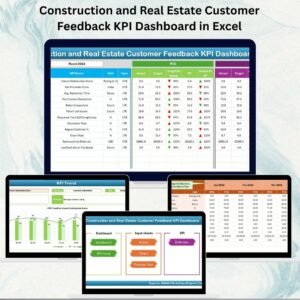
✅ Interactive Dashboard – Select a month and instantly view MTD and YTD actuals vs. targets and last year’s data.
✅ Conditional Formatting – Red/green arrows highlight performance improvements or declines.
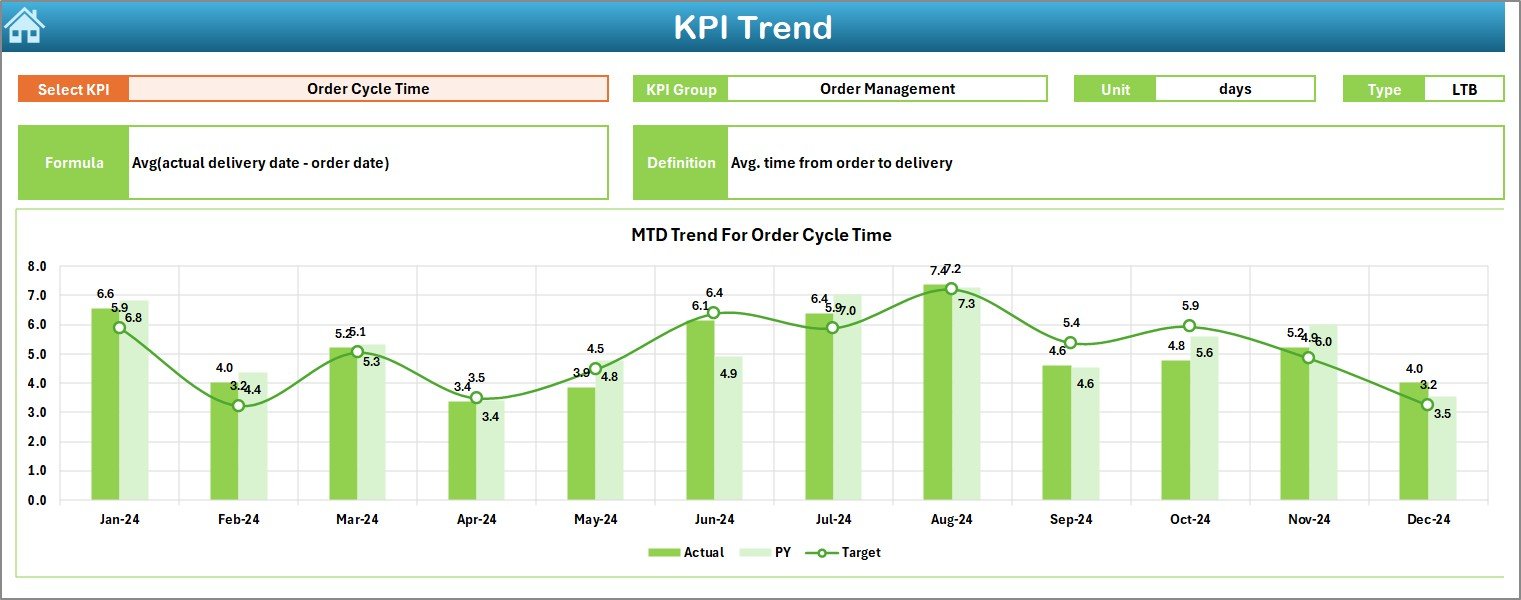
✅ KPI Trend Analysis – Drill down into individual KPIs with detailed units, formulas, and trend charts.
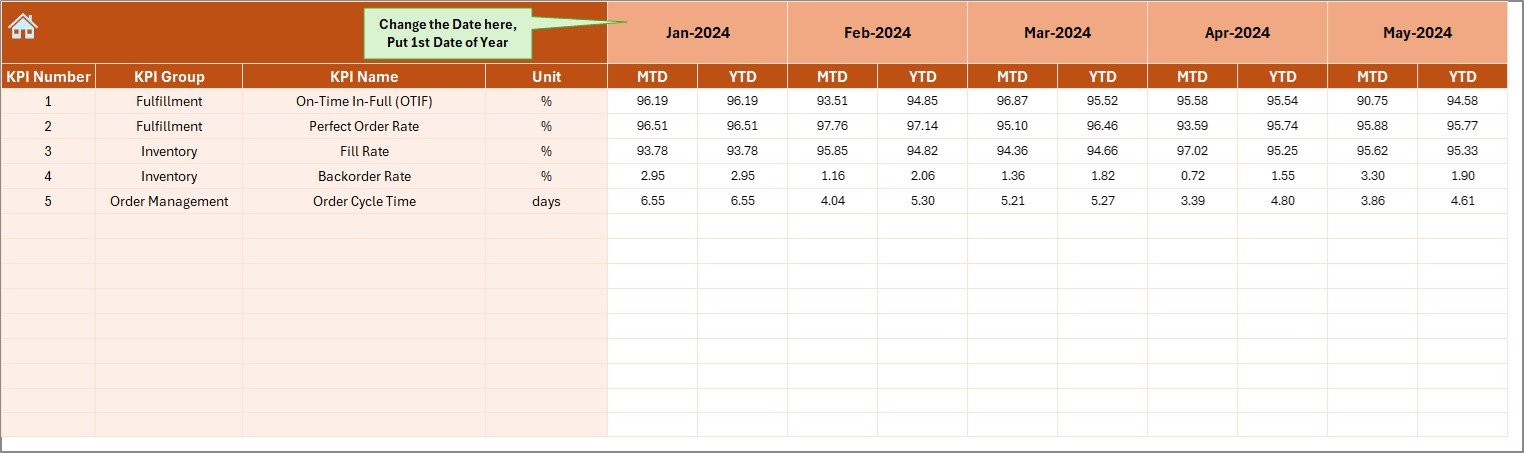
✅ Data Entry Made Simple – Input actual numbers in a structured format for automated reporting.
✅ Target Tracking – Define clear monthly and annual goals for every KPI.
✅ Historical Benchmarking – Compare current performance against previous year numbers.
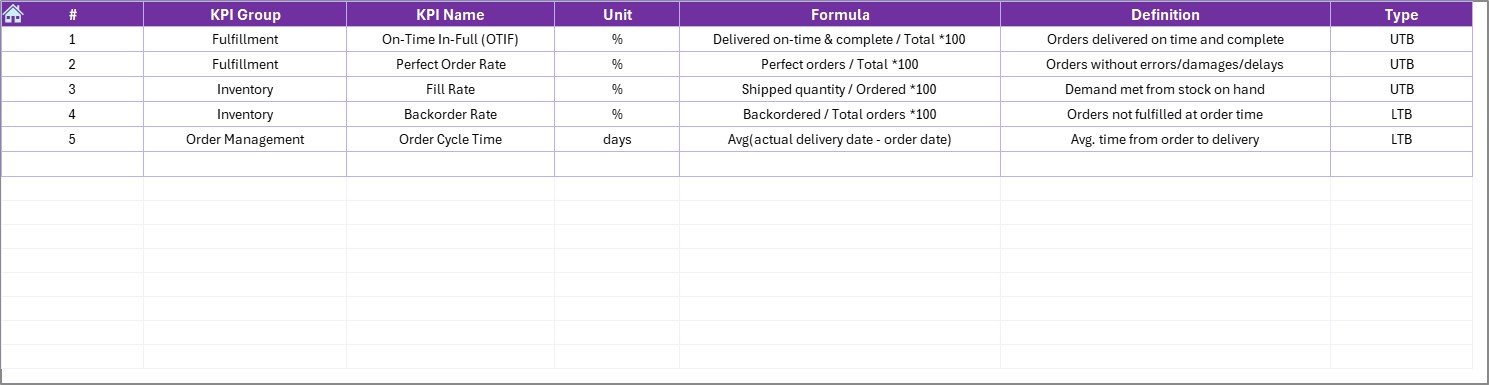
✅ KPI Definition Sheet – Maintain clarity with documented formulas, definitions, and units.
📊 What’s Inside the Supply Chain Management KPI Dashboard in Excel
When you download this template, you’ll receive a structured Excel file designed for smooth performance tracking:
-
Home Sheet: Quick navigation with six buttons to access all major sheets.
-
Dashboard Tab: Main performance view showing MTD and YTD results vs. targets and last year.
-
KPI Trend Tab: Focused analysis of selected KPIs with trends and definitions.
-
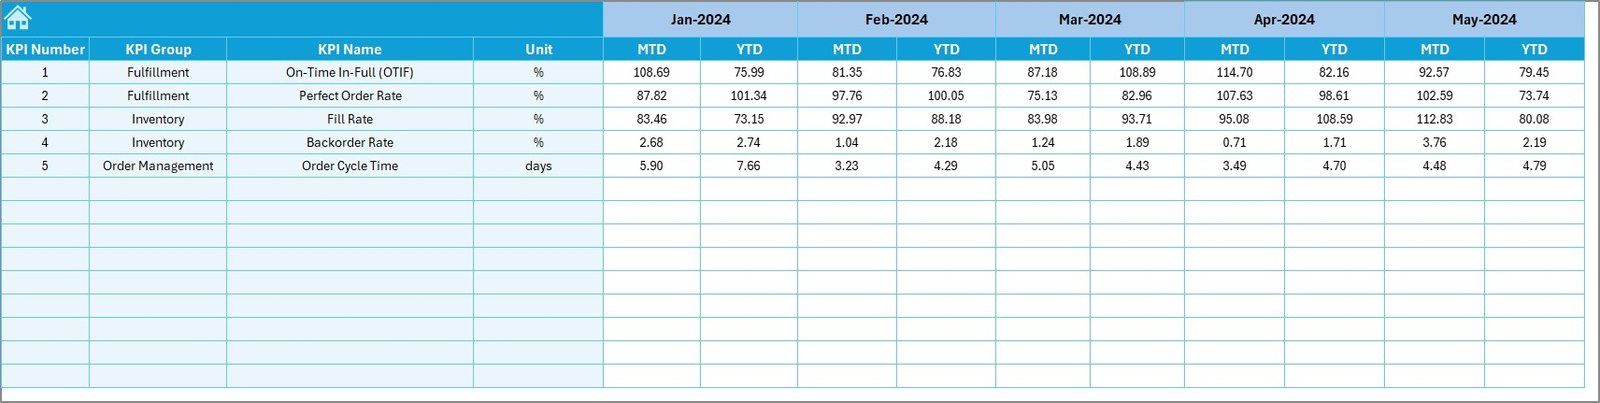
Actual Numbers Input Sheet: Enter MTD and YTD actuals for real-time updates.
-
Target Sheet: Define monthly and yearly benchmarks.
-
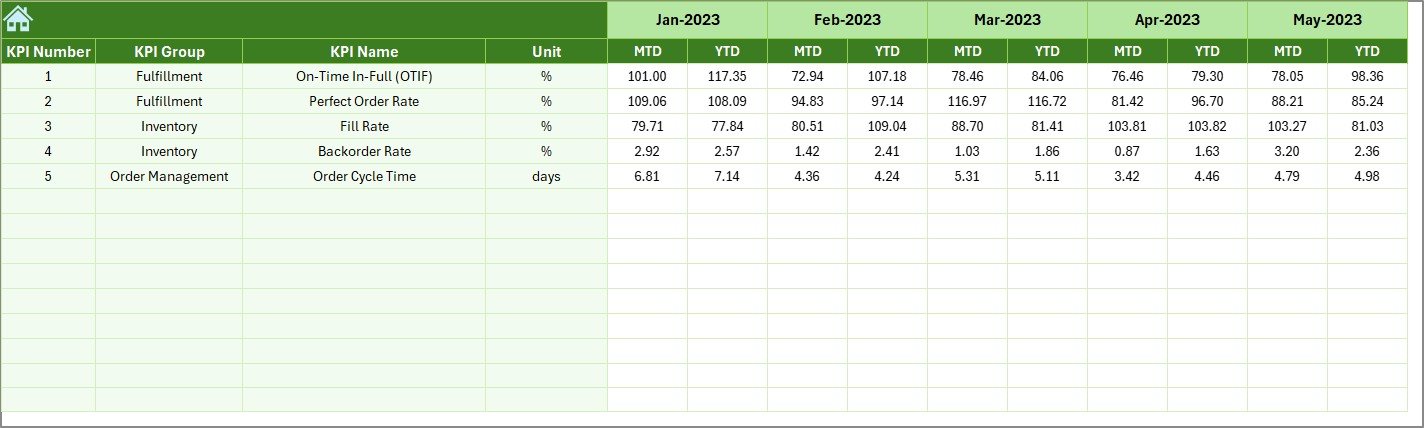
Previous Year Sheet: Store historical data for meaningful comparisons.
-
KPI Definition Tab: Document all KPIs for team-wide consistency.
🛠️ How to Use the Supply Chain Management KPI Dashboard in Excel
1️⃣ Set Targets – Define monthly and YTD benchmarks in the Target sheet.
2️⃣ Enter Actual Data – Record monthly actuals in the input sheet.
3️⃣ Compare Performance – Review Dashboard visuals to track Actual vs. Target and Previous Year.
4️⃣ Analyze Trends – Use KPI Trend tab for long-term performance analysis.
5️⃣ Take Action – Identify bottlenecks, inefficiencies, or cost spikes and resolve them quickly.
6️⃣ Update Regularly – Refresh data monthly to keep your dashboard accurate and reliable.
This Excel template requires no advanced technical skills — if you can use Excel, you can use this dashboard with ease!
👥 Who Can Benefit from This Supply Chain Management KPI Dashboard
🏭 Manufacturing Companies – Track supplier lead times, inventory turnover, and logistics costs.
📦 Retail & E-commerce Businesses – Monitor order fulfillment, returns, and demand forecasting.
🚚 Logistics Providers – Ensure on-time deliveries and optimize transportation costs.
💼 SMEs & Enterprises – Get a cost-effective alternative to expensive BI tools.
📊 Supply Chain Analysts – Gain deeper insights into KPIs and performance trends.
This dashboard is versatile, customizable, and designed to help businesses of all sizes build stronger, more resilient supply chains.
Click here to read the Detailed blog post
Visit our YouTube channel to learn step-by-step video tutorials
👉 PKAnExcelExpert


Reviews
There are no reviews yet.