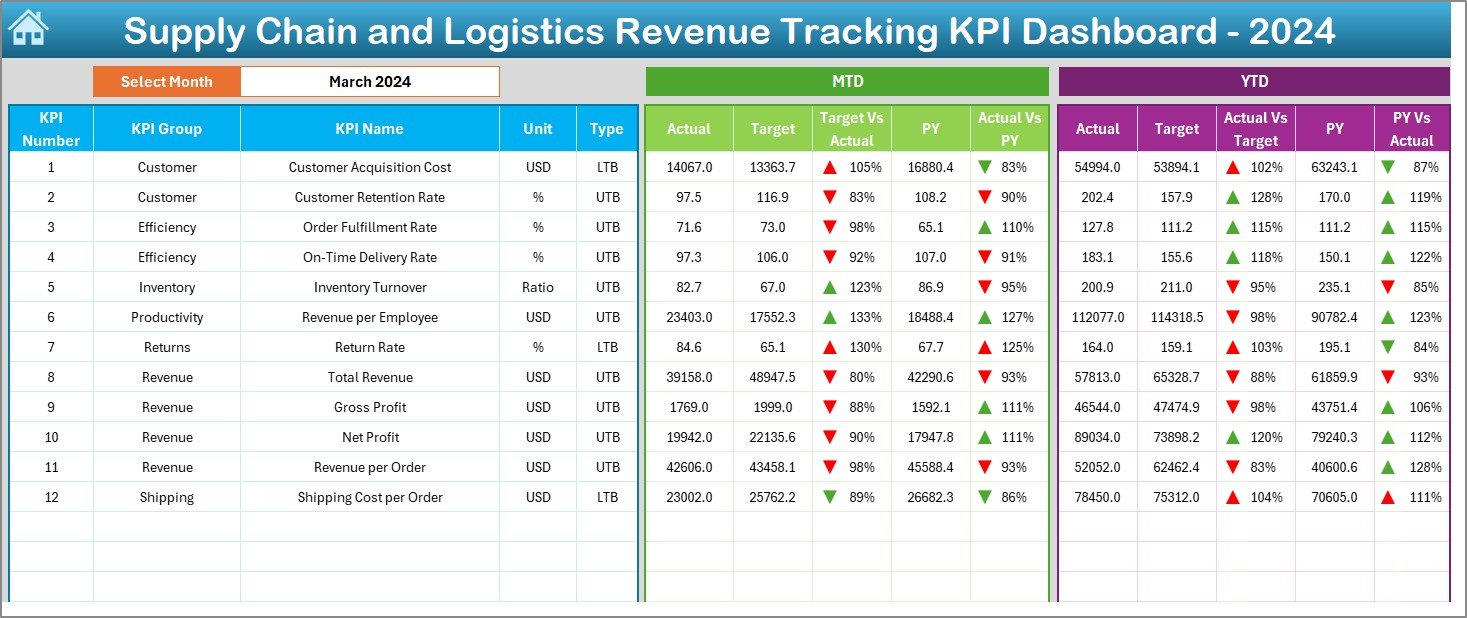
In the ever-evolving world of logistics and supply chain management, understanding your revenue flow isn’t optional — it’s a competitive advantage. Introducing the Supply Chain and Logistics Revenue Tracking KPI Dashboard in Excel — a fully automated, visually engaging, and business-ready dashboard designed to help you track revenue KPIs, compare actual vs. target vs. previous year, and make informed, data-driven decisions.
Whether you’re managing warehouse operations, monitoring transportation efficiency, or overseeing financial reporting, this Excel dashboard brings all your critical revenue metrics into one clean, intuitive workspace.
 Key Features of the Dashboard

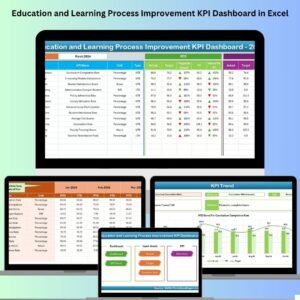
With six clickable buttons, jump straight to any key section like Dashboard, Trend Sheet, or KPI Definitions — no scrolling needed.

-
Drop-down Month Selector (D3) to filter the dashboard instantly
-
KPIs with MTD & YTD values — including Actual, Target, and Previous Year
-
Trend Arrows show performance against benchmarks using conditional formatting
-
A perfect at-a-glance snapshot for monthly and yearly reviews

-
Select any KPI to see trends over 12 months
-
Metadata displays KPI group, unit, LTB/UTB type, formula & definition
-
View clear MTD & YTD trends for Actual, Target, and PY data

-
Enter monthly MTD and YTD values
-
Set the fiscal start month (E1)
-
All charts, metrics, and visuals update automatically

-
Define MTD and YTD revenue targets for each KPI
-
Keep your team aligned with measurable goals

-
Input last year’s values to calculate year-over-year performance
-
Great for forecasting and strategic planning

-
Includes KPI Name, Group, Unit, Formula, Definition, and Type (UTB or LTB)
-
Ideal for onboarding new team members and maintaining consistency
 Advantages of Using This Excel Dashboard

Monitor key revenue drivers like Transport Cost %, Delivery Revenue, or Warehouse Profitability — all in one place.

Conditional formatting, trend lines, and chart visuals make your performance insights easy to digest and present.

Add your own KPIs, change formulas, switch currencies, or brand it with your company’s logo.

Clean layout + dropdown filters + auto-updating metrics = Easy for beginners, powerful for pros.

Compare actuals with last year’s data and anticipate trends before they impact your bottom line.
 Who Should Use This Dashboard?
This Excel template is perfect for:


 Best Practices for Using the Revenue KPI Dashboard


 Why Revenue Tracking Matters in Supply Chains
By using this dashboard, you can:
-
Detect bottlenecks that reduce profits
-
Measure transportation and warehousing performance
-
Align budget planning with financial performance
-
Optimize pricing and supplier costs
-
Identify profit-draining inefficiencies early
 Click here to read the Detailed blog post
 Visit our YouTube channel for step-by-step video tutorials
 Auto-updating Revenue KPIs – MTD, YTD, Target, PY
 Perfect for boardroom-ready reporting








Reviews
There are no reviews yet.