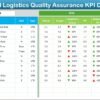
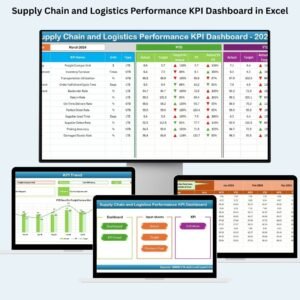
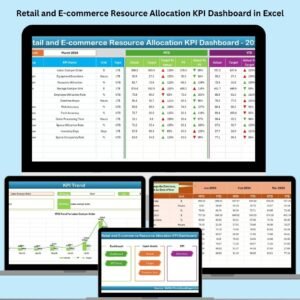
In a high-stakes, customer-driven world, your supply chain can’t afford delays, inaccuracies, or blind spots. That’s where the Supply Chain and Logistics Quality Assurance KPI Dashboard in Excel steps in — an interactive, visual, and easy-to-use Excel tool that empowers you to monitor key performance indicators, uncover inefficiencies, and make smarter decisions with real-time data.
Built specifically for quality assurance within logistics and supply chain management, this Excel dashboard provides an all-in-one view of MTD, YTD, and YoY performance across the KPIs that matter most.
 Key Features of the Dashboard

Navigate between dashboard sections easily with six clickable buttons. No scrolling. Just click and go.


-
Drop-down Month Selector – Choose any month and the entire dashboard refreshes instantly
-
KPI Cards for MTD & YTD – Track actual, target, and previous year values
-
Arrows for Trend Analysis – Visual alerts using conditional formatting for under/overperformance
-
Instantly spot delays, dips, or red flags

-
Select any KPI using a drop-down
-
View key metadata (Unit, Group, Formula, LTB/UTB)
-
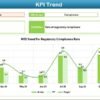
Line charts for MTD & YTD trends across Actual, Target, and Previous Year

-
Set the first month in cell E1
-
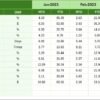
Enter MTD & YTD actuals for all KPIs
-
Dashboard auto-updates — no manual linking needed

-
Input monthly MTD and YTD targets
-
Set expectations and benchmarks for every KPI

-
Record previous year MTD & YTD values
-
Evaluate growth, decline, or stagnation

-
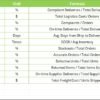
KPI Name, Group, Formula, Unit
-
LTB/UTB Type explained for context
-
Ideal for onboarding and strategy alignment
 Why This Dashboard Matters
Tracking KPIs like On-Time Delivery, Order Accuracy, and Supplier Defect Rate isn’t optional — it’s vital for:
-
Reducing costs
-
Preventing delays
-
Improving service quality
-
Meeting regulatory and customer expectations
By centralizing all your supply chain quality data into one automated system, you unlock proactive decision-making and strategic visibility.
 Advantages of Using the Dashboard


 Who Should Use This Dashboard?
Ideal for professionals in:


If your work touches inventory, warehousing, delivery, or procurement — this dashboard is your new best friend.
 Real-World Use Case
Let’s say you’re noticing late deliveries and unhappy customers. You open the dashboard and see that your Order Cycle Time has increased over the past 3 months. In the KPI Trend Sheet, you spot a dip in On-Time Delivery, aligning with a change in your primary supplier.
You use this insight to renegotiate delivery timelines — or find a better supplier. Result: improved delivery, reduced complaints, and optimized cost.
 Best Practices for Dashboard Use


 Click here to read the Detailed blog post
 Visit our YouTube channel to learn step-by-step video tutorials





 Fully Editable & Reusable – Customize KPIs and branding








Reviews
There are no reviews yet.