In the fast-moving retail world, supermarkets need real-time performance tracking to stay competitive, profitable, and customer focused. Managing sales, inventory, and operations manually is time-consuming and error-prone — that’s why the Supermarkets KPI Dashboard in Excel is the ultimate solution 🏪📊.
This ready-to-use Excel dashboard helps you analyze every aspect of supermarket performance in one visual, data-driven file. It tracks Month-to-Date (MTD) and Year-to-Date (YTD) KPIs, compares Actual vs Target results, and highlights growth or decline using color-coded indicators — empowering retail managers to make faster, smarter decisions.
Built entirely in Microsoft Excel, it’s affordable, easy to customize, and packed with automation features that save hours of manual reporting.
⚙️ Key Features of the Supermarkets KPI Dashboard in Excel
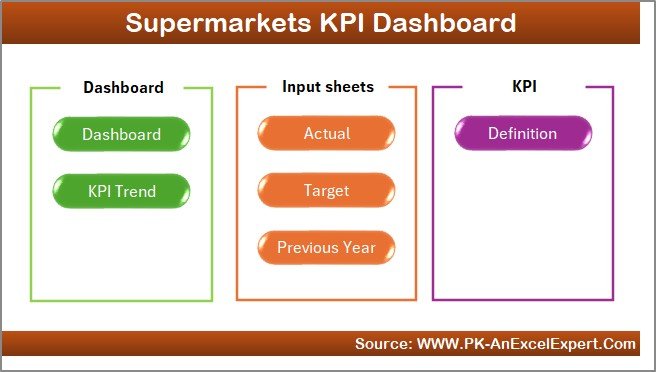
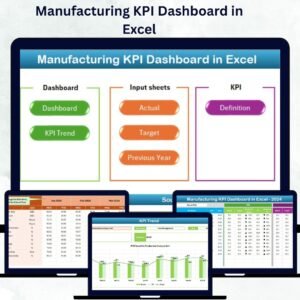
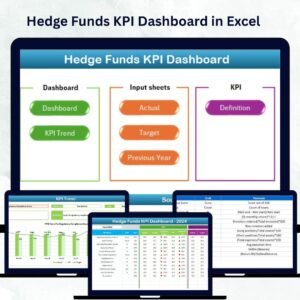
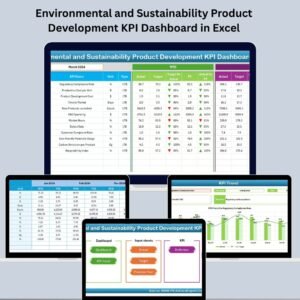
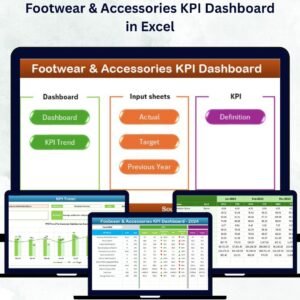
📊 7 Worksheet Tabs – Home, Dashboard, KPI Trend, Actual Data, Targets, Previous Year, and KPI Definition.
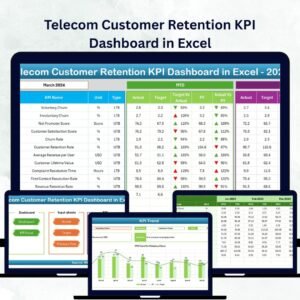
🎯 MTD & YTD Tracking – Compare monthly and annual performance with ease.
🟢 Conditional Formatting – Up ↑ / Down ↓ arrows show instant KPI movement.
📈 Dynamic Dropdowns – Select any month to refresh data automatically.
💰 Target vs Actual Comparison – Know where you’re winning or falling behind.
📉 Previous Year Benchmarking – Identify year-on-year growth or gaps.
💡 KPI Dictionary Sheet – Defines every metric for team clarity.
⚙️ Customizable Formulas – Add or edit KPIs as your store evolves.
💼 Professional Design – Clean, interactive layout for management reviews.
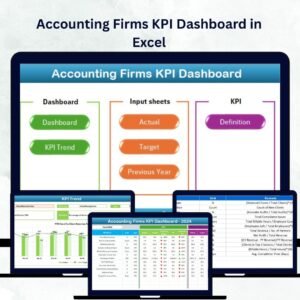
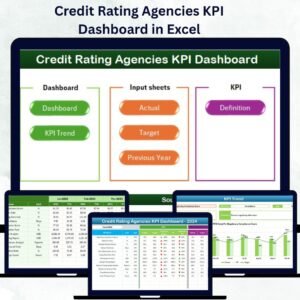
📦 What’s Inside the Dashboard Template
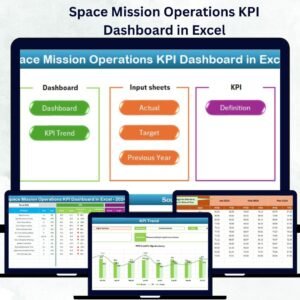
1️⃣ Home Sheet – Navigation Hub
Acts as your control panel with six interactive buttons to jump between sheets.
A user-friendly interface ensures easy navigation for any team member.
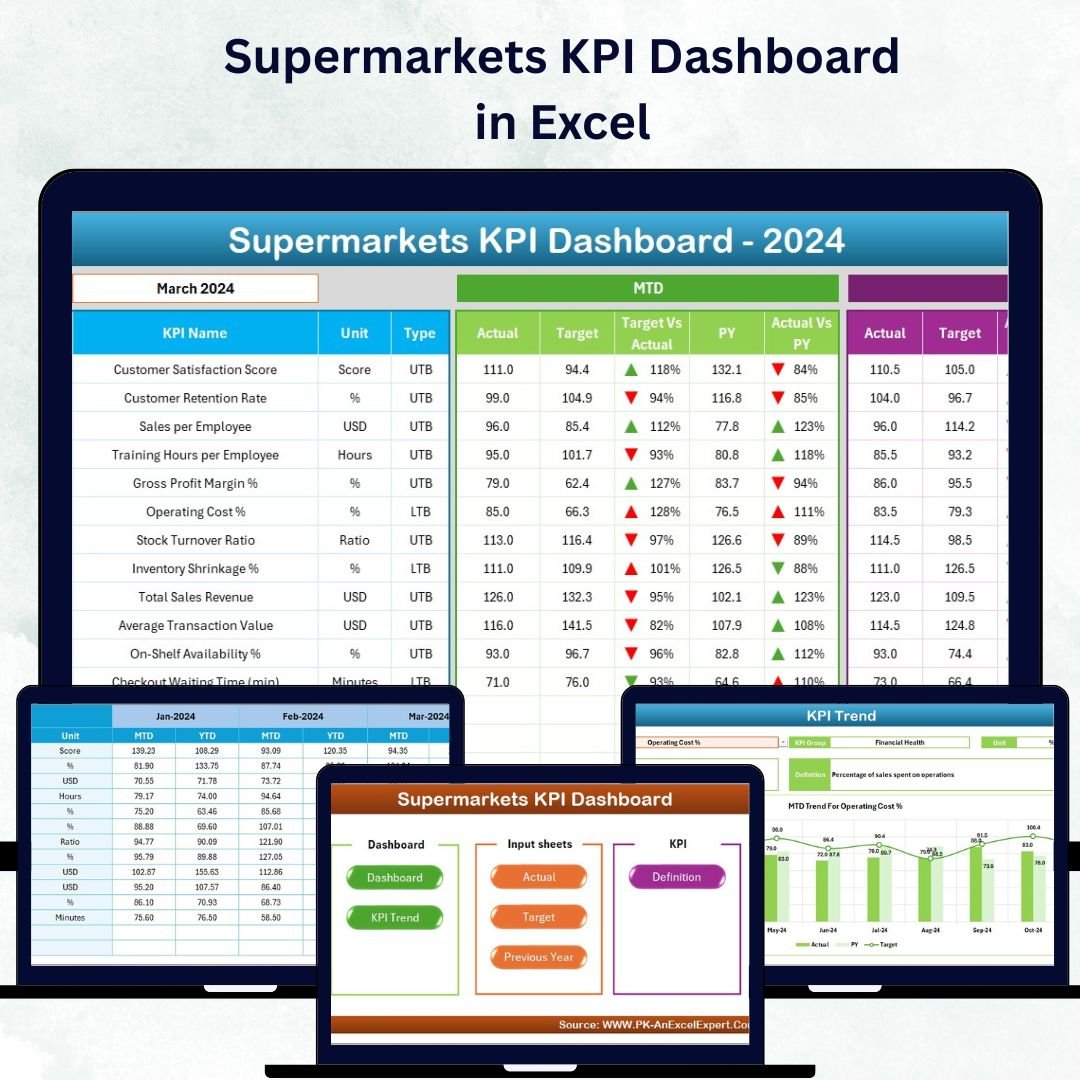
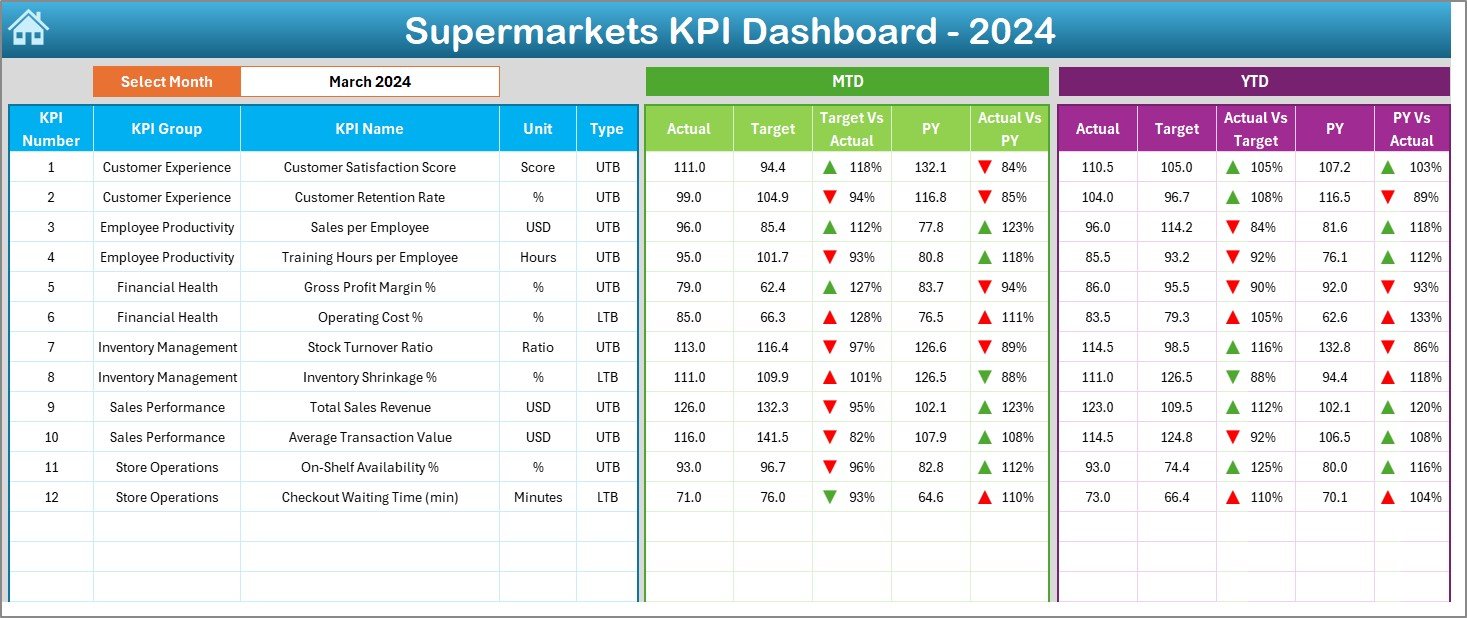
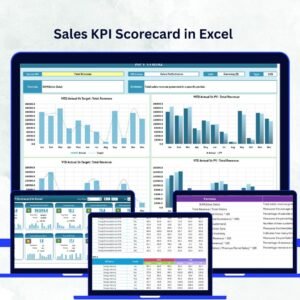
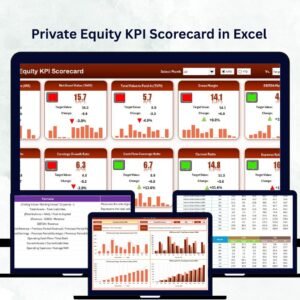
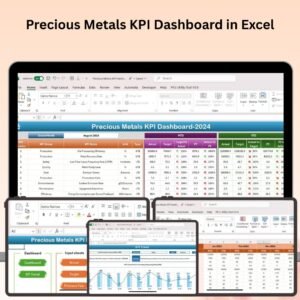
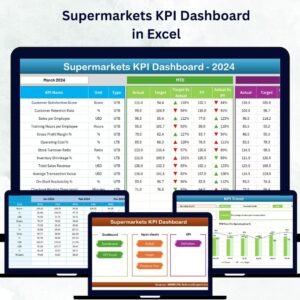
2️⃣ Dashboard Sheet – Performance at a Glance
The main page where all key metrics come together.
-
Select a month from Cell D3 to update instantly.
-
View MTD and YTD Actual vs Target and Previous Year figures.
-
Conditional formatting highlights success 🟢 or concern 🔴.
Perfect for management meetings and weekly performance reviews.
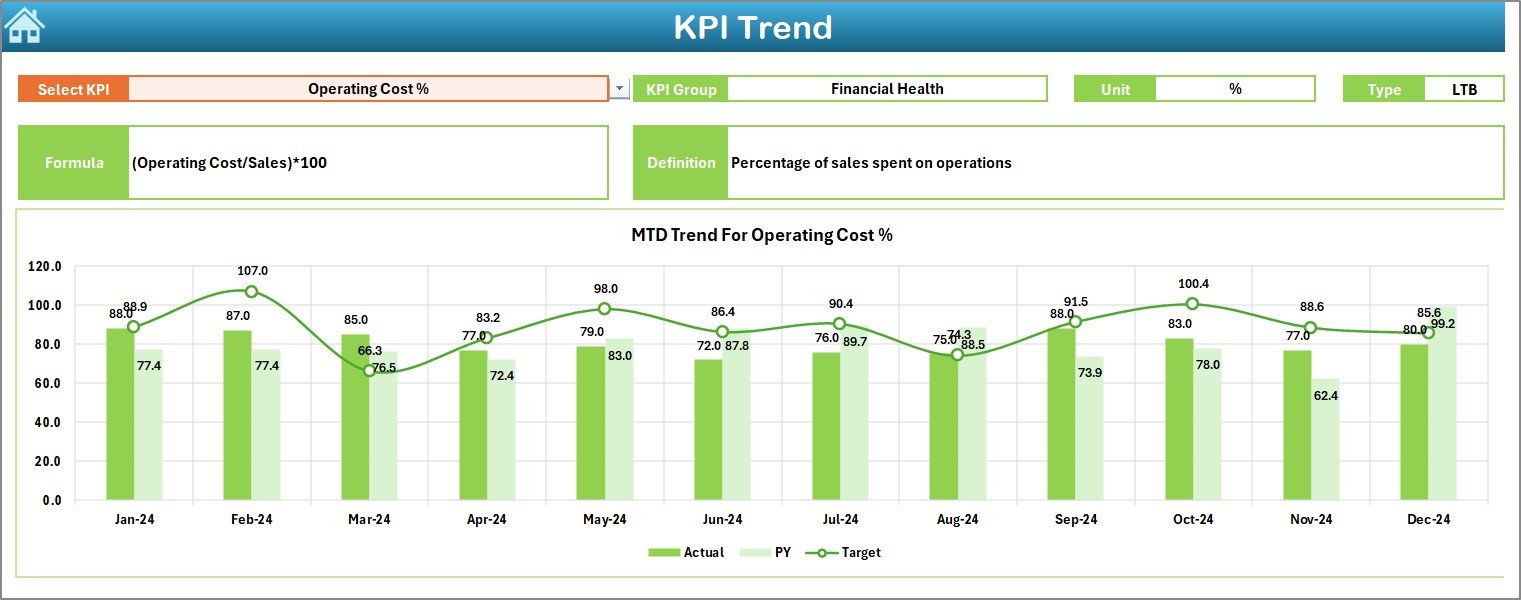
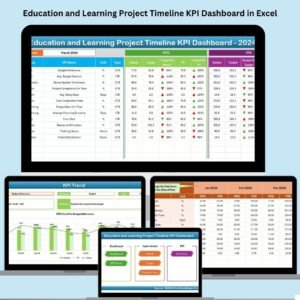
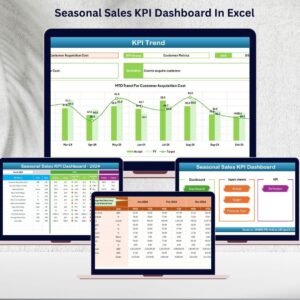
3️⃣ KPI Trend Sheet – Track Progress Over Time
Dive deeper into each KPI’s movement with time-series charts.
-
Select a KPI from the dropdown (Cell C3).
-
Displays Group, Unit, Formula, and Type (UTB/LTB).
-
Charts compare Actual, Target, and Previous Year values for MTD and YTD.
Ideal for spotting seasonal trends and forecasting future sales.
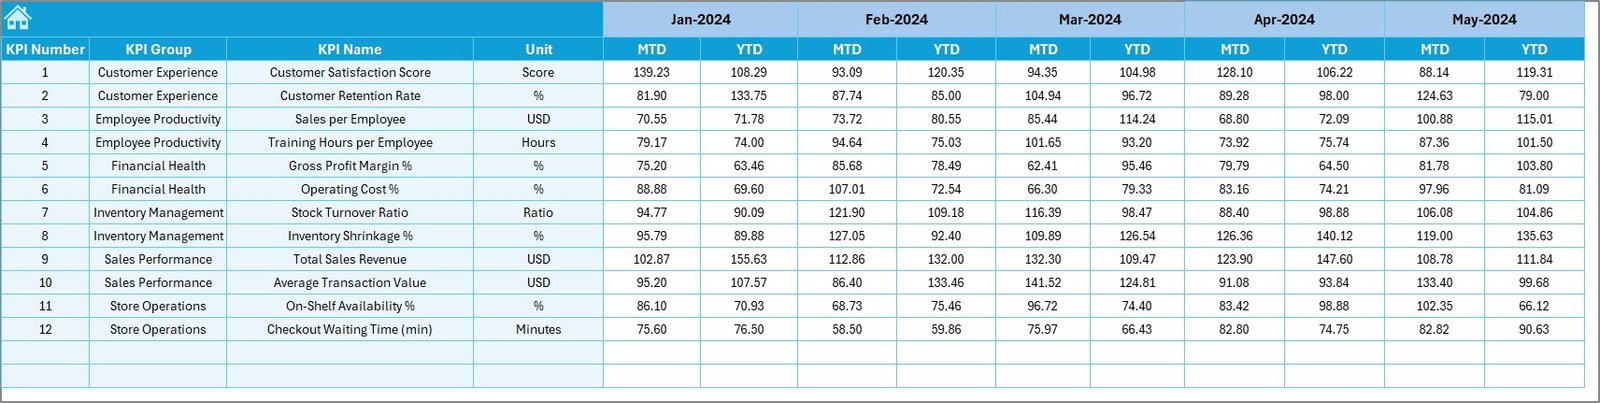
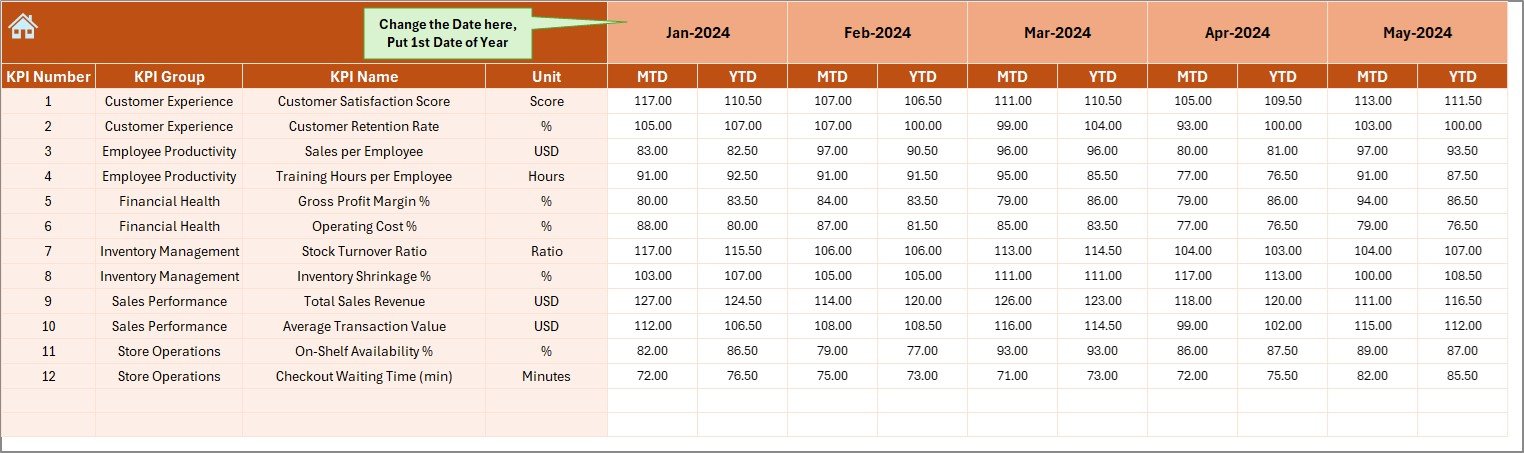
4️⃣ Actual Numbers Input Sheet – Data Entry Made Simple
Enter real performance numbers for each month.
Once data is entered, it updates across all dashboard views automatically ✅.
5️⃣ Target Sheet – Set Clear Goals
Input monthly and annual targets for every KPI.
Automatic variance calculations reveal whether you’re meeting objectives.
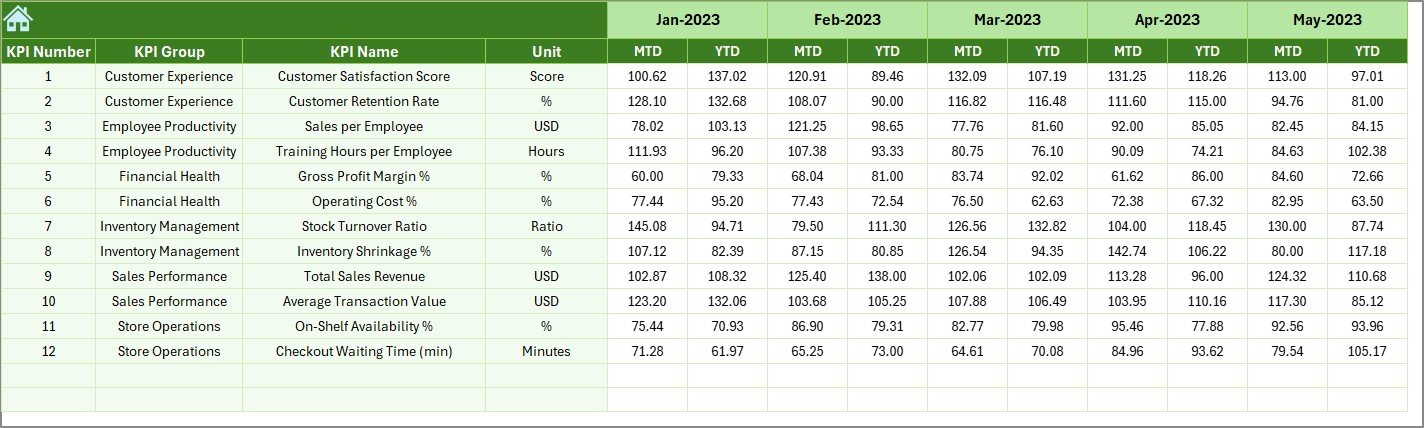
6️⃣ Previous Year Numbers Sheet – Benchmark Your Performance
Record last year’s figures to compare growth and evaluate long-term performance.
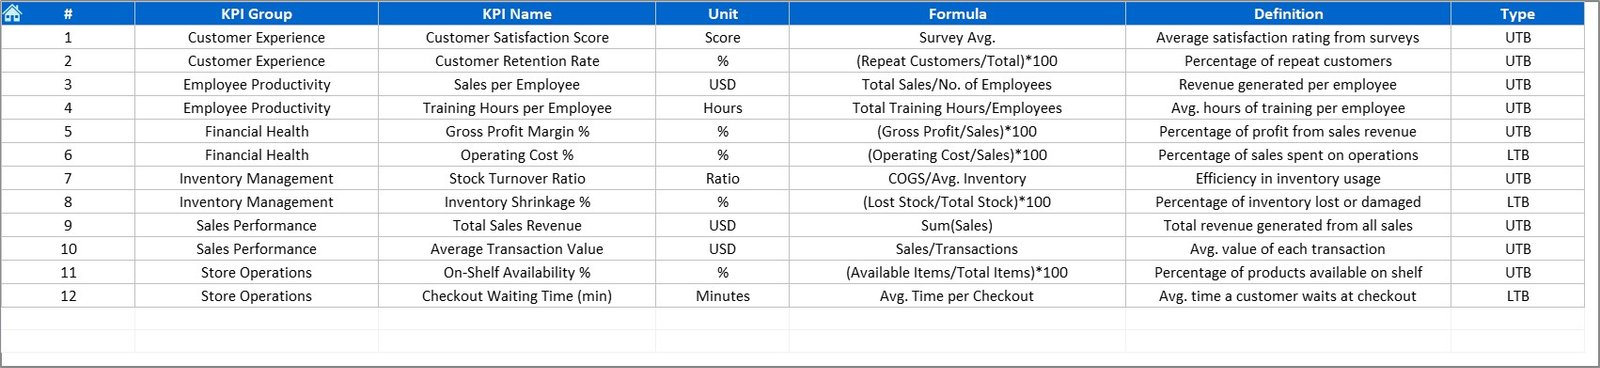
7️⃣ KPI Definition Sheet – Your Reference Guide
Includes KPI Name, Group, Unit, Formula, and Definition.
This ensures everyone interprets metrics the same way.
💡 Why Supermarkets Need This Dashboard
🏬 Real-Time Insights: Know your sales, inventory, and operations status instantly.
📊 Better Decisions: Base strategies on data —not guesswork.
💼 Team Accountability: Assign KPIs to departments for ownership.
⚙️ Process Optimization: Identify bottlenecks and reduce waste.
💰 Profit Improvement: Track margins and optimize promotions faster.
This dashboard is built to drive operational efficiency and enhance profitability through data-driven action.
🌟 Advantages of the Supermarkets KPI Dashboard in Excel
✅ Comprehensive View: All key retail metrics in one place.
✅ Customizable: Add new KPIs or departments as your store grows.
✅ Automation: Eliminate manual data aggregation with auto-calculations.
✅ Visualization: Arrows and color codes make trends easy to understand.
✅ Benchmarking: Compare performance year over year.
✅ Time Efficiency: Reduce hours of reporting into minutes.
🧭 How to Use the Dashboard
1️⃣ Update the KPI Definition Sheet with your business metrics.
2️⃣ Enter monthly data into Actual, Target, and Previous Year sheets.
3️⃣ Go to the Dashboard tab and select the desired month.
4️⃣ Analyze the visuals and KPI trends to understand performance.
5️⃣ Refine your strategy to maximize sales and customer retention.
👥 Who Can Benefit from This Template
-
Supermarket Owners 🛒
-
Retail Store Managers 🏬
-
Sales & Operations Heads 📈
-
Finance Teams 💰
-
Inventory Analysts 📦
Perfect for small shops, large retail chains, and franchise businesses alike.
🧠 Conclusion
The Supermarkets KPI Dashboard in Excel is your all-in-one performance management tool.
It combines sales tracking, inventory control, customer analytics, and profitability reporting into a single interactive dashboard.
With its intuitive design and automated insights, you’ll save time, reduce errors, and make more informed business decisions.
Start using it today and take your retail performance to the next level 🚀.


Reviews
There are no reviews yet.