
In the high-stakes world of hedge funds, precision is everything. Every trade, every return, and every risk assessment must be backed by data-driven insight — not guesswork. But tracking multiple performance metrics manually can lead to confusion, delays, and inconsistent reporting.
That’s where the Hedge Funds KPI Dashboard in Excel becomes an essential game-changer 📊💹.
This ready-to-use Excel template is designed for fund managers, analysts, and investors who want a comprehensive, automated, and visual tool to monitor key performance indicators (KPIs). From returns and volatility to AUM, drawdowns, and Sharpe ratios — every metric you need is consolidated into one powerful, interactive dashboard.
With real-time updates, trend analysis, and visual comparisons, this dashboard empowers hedge-fund professionals to make smarter, faster, and more informed decisions.
⚙️ Key Features of the Hedge Funds KPI Dashboard in Excel
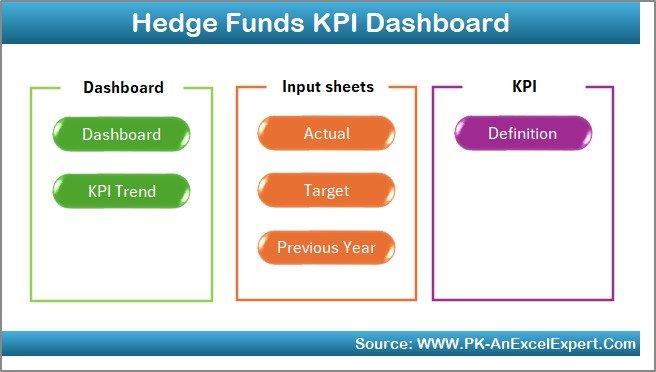
📊 7 Structured Worksheet Tabs – Home, Dashboard, KPI Trend, Actual Numbers, Target, Previous Year, and KPI Definition.
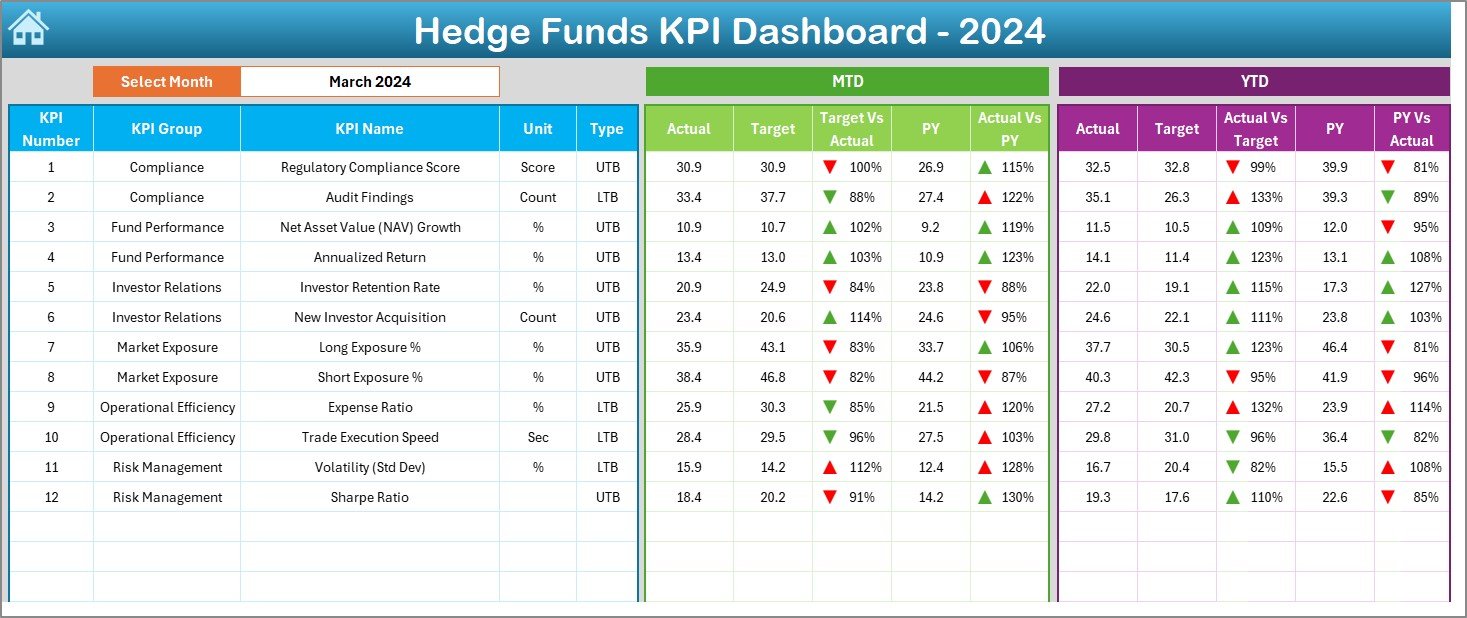
🎯 MTD & YTD Tracking – Monitor Month-to-Date and Year-to-Date data for instant clarity.
📈 Dynamic Dropdowns – Select any month or KPI to auto-update visuals.
🟢 Performance Indicators – Conditional formatting with ↑ ↓ arrows for quick insights.
💼 Comprehensive Metrics – Track returns, risk, fund flows, drawdowns, Sharpe ratio, and volatility.
📊 Automated Charts & Formulas – Linked data ensures accurate and real-time updates.
💡 Fully Customizable – Add, edit, or remove KPIs to match your strategy.
💰 No Complex Tools Needed – 100% Excel-based solution — efficient, affordable, and easy to use.
📦 What’s Inside the Dashboard Template
1️⃣ Home Sheet – Central Navigation Hub
A clean index page with six navigation buttons for seamless movement across sheets.
-
Save time with one-click access.
-
Professional layout for quick orientation.
-
Ideal for managers handling multiple reports simultaneously.
2️⃣ Dashboard Sheet – Performance Command Center
This is the visual heart of your workbook.
-
Choose a month (cell D3) to instantly refresh all KPIs.
-
Compare Actual, Target, and Previous-Year (PY) performance for both MTD & YTD.
-
Visual icons highlight over- and under-performance.
-
Covers all key hedge-fund metrics — from AUM and returns to liquidity and leverage.
📊 It’s your complete fund-performance snapshot at a glance.
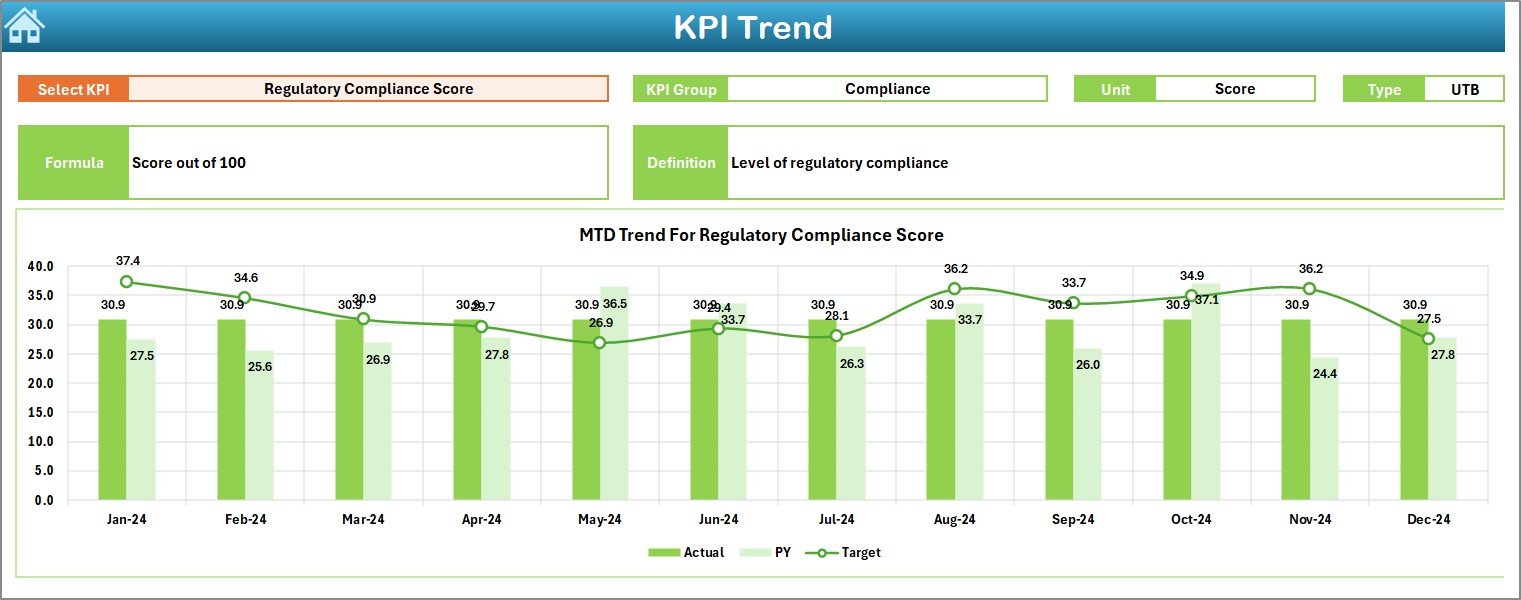
3️⃣ KPI Trend Sheet – Deep-Dive Analytics
Analyze trends and identify emerging patterns:
-
Select any KPI from the dropdown (cell C3).
-
View KPI Group, Unit, Type (UTB/LTB), Formula, and Definition.
-
Auto-generated trend charts display Actual vs Target vs PY for MTD & YTD.
Perfect for spotting volatility shifts and growth opportunities 📈.
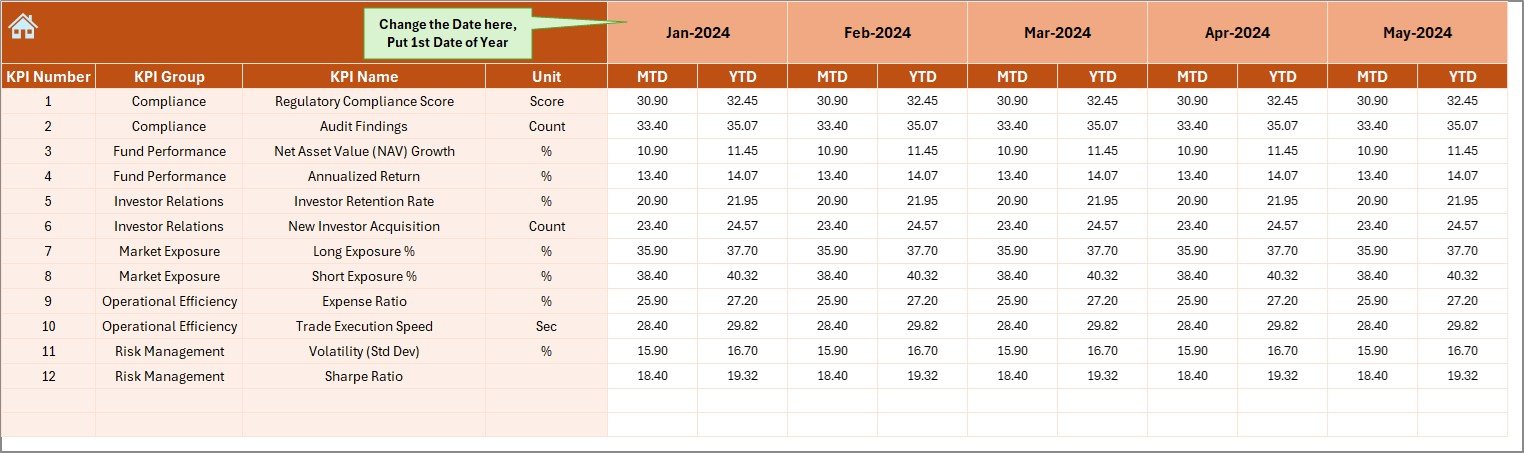
4️⃣ Actual Numbers Sheet – Core Data Input
Enter MTD and YTD figures for each KPI.
-
Set the fiscal start month (cell E1).
-
Automatic linkage ensures dashboards refresh instantly.
-
Maintain data integrity across all tabs.
5️⃣ Target Sheet – Define Benchmarks
Set and adjust monthly or annual MTD & YTD goals.
These serve as comparison baselines for performance evaluation and investor reporting.
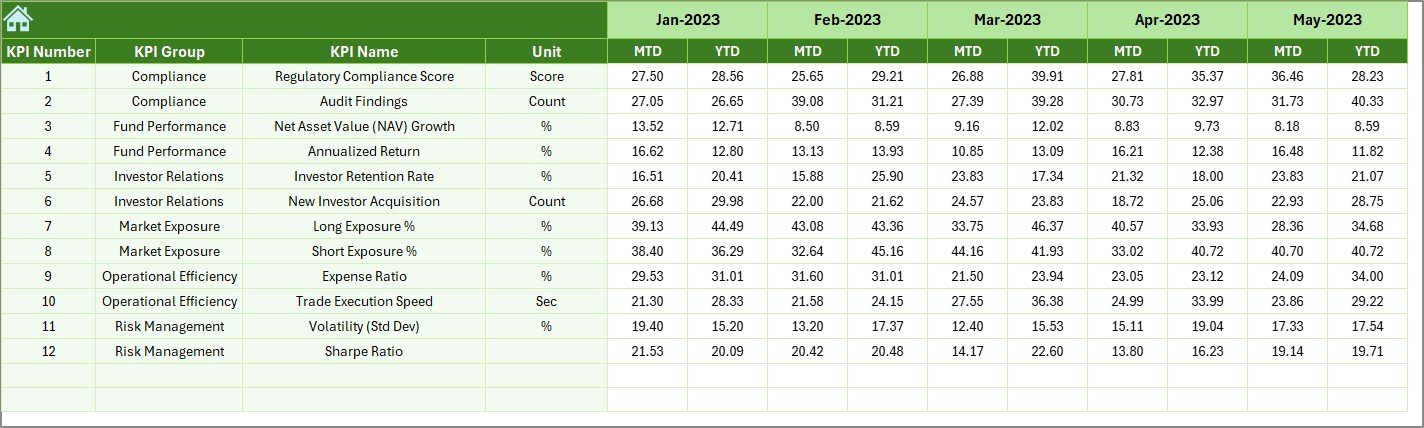
6️⃣ Previous Year Sheet – Historical Tracking
Record last year’s KPI data to measure growth or decline.
The dashboard auto-calculates PY vs Actual metrics for trend analysis.
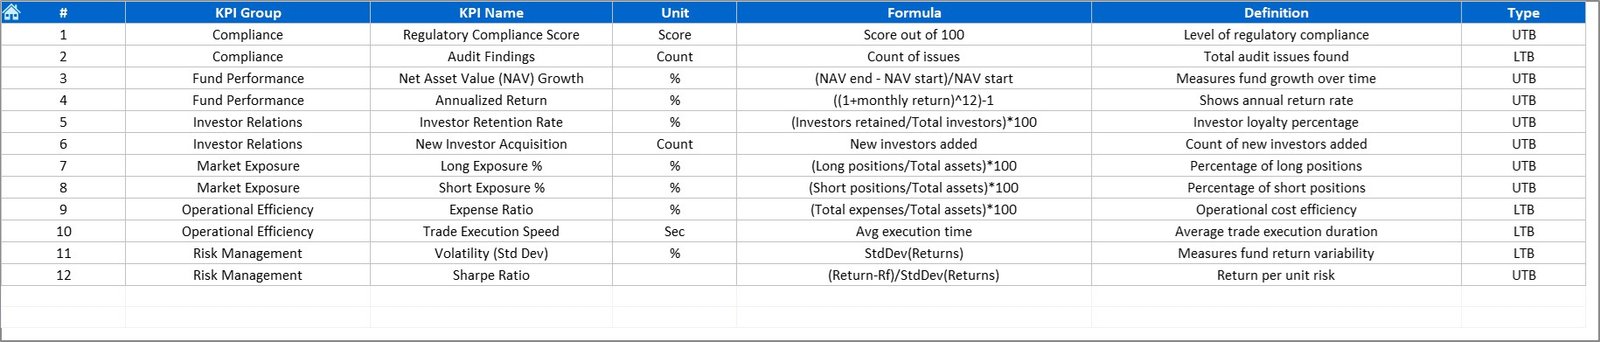
7️⃣ KPI Definition Sheet – Consistency in Reporting
Define KPI names, groups, units, and formulas.
Ensures every team member interprets metrics the same way.
💡 Why Hedge Funds Need This Dashboard
Hedge-fund operations juggle returns, risks, and compliance daily. Without centralized monitoring, inefficiencies go unnoticed.
The Hedge Funds KPI Dashboard in Excel solves this by giving you:
📈 Real-Time Visibility – Evaluate performance immediately as data updates.
🧾 Accurate Reporting – Automated formulas minimize errors.
💬 Actionable Insights – Understand exactly where and why performance shifts.
💹 Operational Efficiency – Eliminate repetitive manual reporting.
💼 Investor Confidence – Present clear, visual results in meetings and reviews.
🌟 Advantages of the Hedge Funds KPI Dashboard
✅ Instant Updates: Real-time visuals refresh as soon as you enter data.
✅ Simplified Analysis: Charts, arrows, and colors make trends easy to interpret.
✅ Flexible Customization: Modify KPIs to fit any hedge-fund strategy.
✅ Centralized Management: Consolidate all financial and operational data in one file.
✅ Compliance Support: Maintain structured and auditable records.
✅ Low-Cost Solution: Professional functionality without expensive BI tools.
✅ Scalable Design: Works for single or multiple fund portfolios.
🧭 How to Use the Dashboard
1️⃣ Define KPIs: Add your fund’s metrics in the KPI Definition tab.
2️⃣ Input Data: Enter Actual, Target, and PY values in their respective sheets.
3️⃣ Select Month: In the Dashboard sheet, pick a month to update all visuals.
4️⃣ Analyze Trends: Use the KPI Trend tab to review historical performance.
5️⃣ Take Action: Identify underperforming areas and execute timely improvements.
👥 Who Can Benefit
-
Hedge-Fund Managers 🏦
-
Portfolio Analysts 📊
-
Risk & Compliance Officers ⚖️
-
Financial Consultants 💼
-
Investor Relations Teams 🤝
🧠 Conclusion
The Hedge Funds KPI Dashboard in Excel delivers everything a modern fund manager needs — automation, accuracy, and actionable analytics.
It transforms static spreadsheets into a live, visual command center that highlights opportunities, tracks performance, and ensures accountability.
With this tool, you can analyze trends, compare targets, and manage fund performance like a pro — all without relying on complex or costly software.
Start leveraging your data today and bring unmatched transparency to hedge-fund performance management! 💰📈


Reviews
There are no reviews yet.