


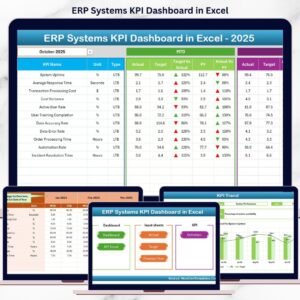
The Startup Growth KPI Dashboard in Excel is an invaluable tool for entrepreneurs and business owners looking to track and analyze the growth and performance of their startup. Designed specifically for startups, this Excel template helps you monitor key performance indicators (KPIs) that are crucial to scaling and succeeding in the early stages of your business.
This user-friendly and customizable dashboard provides insights into vital metrics such as revenue growth, customer acquisition, cash flow, and operational efficiency, allowing you to make informed, data-driven decisions. Whether you’re tracking product development, sales performance, or financial health, this dashboard helps you visualize your startup’s performance in real-time, ensuring you’re on the right track for growth and success.
Key Features of the Startup Growth KPI Dashboard
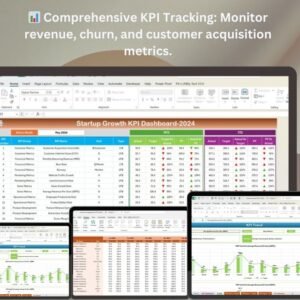
📊 Comprehensive KPI Tracking
Monitor essential KPIs such as monthly revenue, customer acquisition cost (CAC), churn rate, cash flow, and sales performance. Track key business indicators to measure startup success and growth.
⚡ Real-Time Data Updates
Stay updated on key metrics as your startup grows. The dashboard allows you to enter real-time data and compare it against your targets, enabling you to make necessary adjustments quickly.
📈 Financial Performance Insights
Track revenue growth, cash flow, and expenses, and get a clear picture of your startup’s financial health. This allows you to manage your budget, avoid overspending, and improve profitability.
📅 Customer Metrics Monitoring
Keep track of customer acquisition, churn rates, and customer lifetime value (CLTV). Understanding these metrics helps you focus on acquiring and retaining customers to drive business growth.
🖥️ Interactive and Customizable Interface
The dashboard is easy to customize based on your startup’s specific KPIs. Visualize your data through interactive charts and graphs, making it simple to analyze and understand business performance.
Why You’ll Love the Startup Growth KPI Dashboard
✅ Track Key Metrics for Business Growth
Easily monitor the metrics that matter most to your startup’s success, such as revenue, cash flow, customer acquisition, and retention. Stay on top of your progress and identify areas for improvement.
✅ Optimize Financial Health and Cash Flow
Monitor your financial metrics, such as cash flow and expenses, to ensure that your startup maintains a healthy balance sheet while growing.
✅ Measure Customer Acquisition and Retention
Track important customer metrics such as customer acquisition cost (CAC), churn rate, and lifetime value (CLTV) to enhance your customer acquisition and retention strategies.
✅ Visualize Startup Performance
Use interactive charts and graphs to visualize your startup’s growth over time. Quickly assess performance trends, make data-driven decisions, and take action where needed.
✅ Make Data-Driven Decisions for Startup Growth
Use the insights from your KPI data to make informed, strategic decisions that will help scale your startup, improve profitability, and optimize operations.
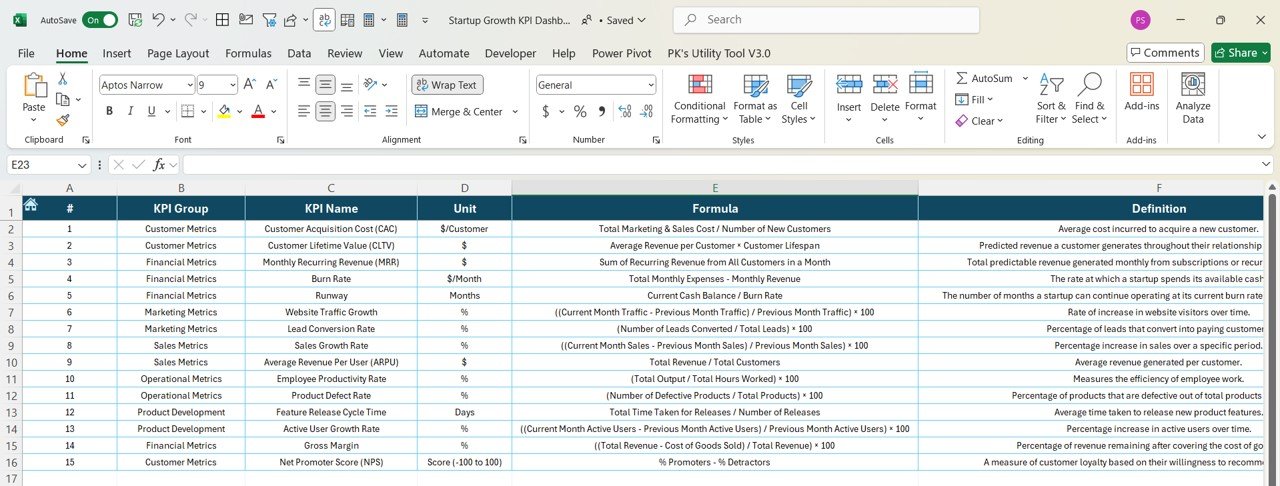
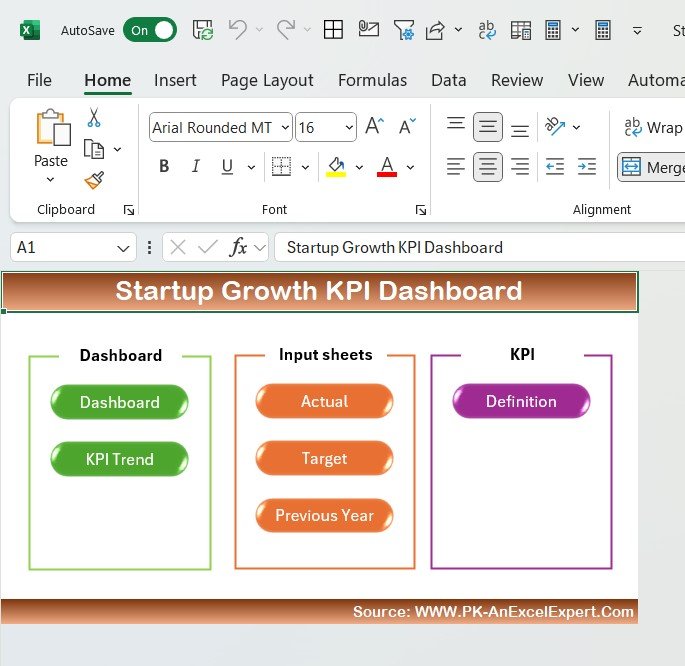
What’s Inside the Startup Growth KPI Dashboard Template?
- KPI Tracking: Track revenue growth, customer acquisition, churn rate, CAC, CLTV, cash flow, and more.
- Financial Insights: Monitor key financial metrics to assess your startup’s financial health.
- Customer Metrics: Track customer acquisition, retention, and lifetime value to optimize growth.
- Performance Visualization: Use interactive charts and graphs to track your startup’s growth over time.
- Customizable Dashboard: Tailor the dashboard to track the specific KPIs relevant to your startup’s unique goals.
How to Use the Startup Growth KPI Dashboard
1️⃣ Download the Template: Get instant access to your Startup Growth KPI Dashboard.
2️⃣ Enter Your Data: Input financial and customer data, including revenue, costs, and customer acquisition metrics.
3️⃣ Track Key Metrics: Use the dashboard to monitor KPIs, such as revenue growth and customer retention, and track your startup’s performance.
4️⃣ Analyze & Optimize: Use the insights to refine strategies, optimize cash flow, improve customer acquisition, and scale your business.
Who Can Benefit from the Startup Growth KPI Dashboard?
🔹 Startup Founders & Entrepreneurs
🔹 Small Business Owners
🔹 Investors Monitoring Startup Performance
🔹 Startup Consultants and Advisors
🔹 Anyone Managing or Scaling a Startup Business
Track, analyze, and optimize your startup’s growth with the Startup Growth KPI Dashboard in Excel. Stay on top of critical metrics, make data-driven decisions, and scale your startup with confidence.
Click here to read the Detailed blog post
Visit our YouTube channel to learn step-by-step video tutorials
Youtube.com/@PKAnExcelExpert


Reviews
There are no reviews yet.