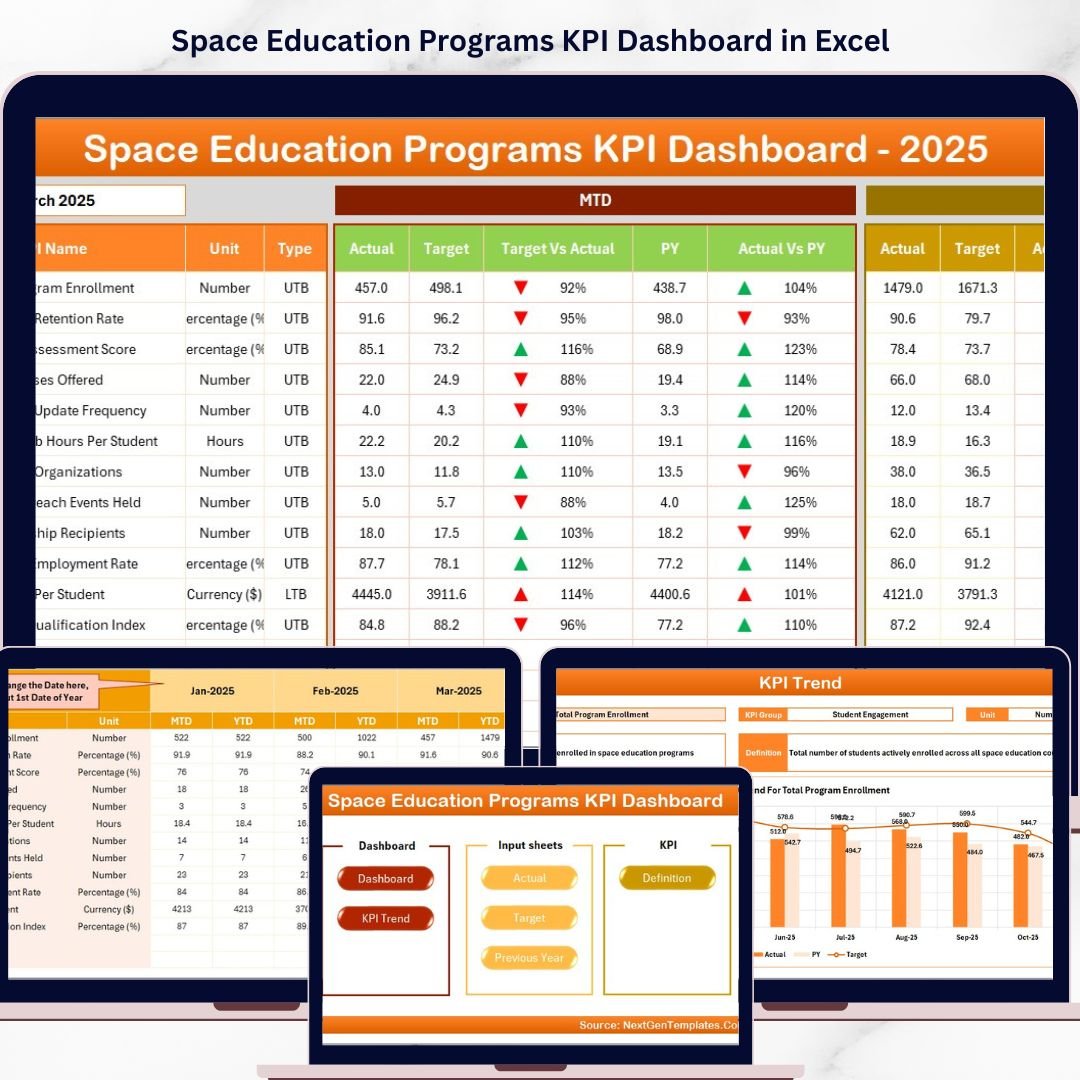
Key Features of Space Education Programs KPI Dashboard
Introducing the Space Education Programs KPI Dashboard – a powerful, intuitive digital tool designed to help you track, analyze, and optimize the performance of your space education initiatives with precision and ease. This comprehensive dashboard is crafted for educators, program managers, and data analysts who want to make data-driven decisions and showcase key performance indicators (KPIs) clearly and effectively.
This dashboard includes 7 meticulously designed worksheets that cover every aspect of KPI management:
- 🏠 Home Sheet: The central hub with 6 easy-to-use buttons for quick navigation to all essential sheets, providing a seamless user experience.
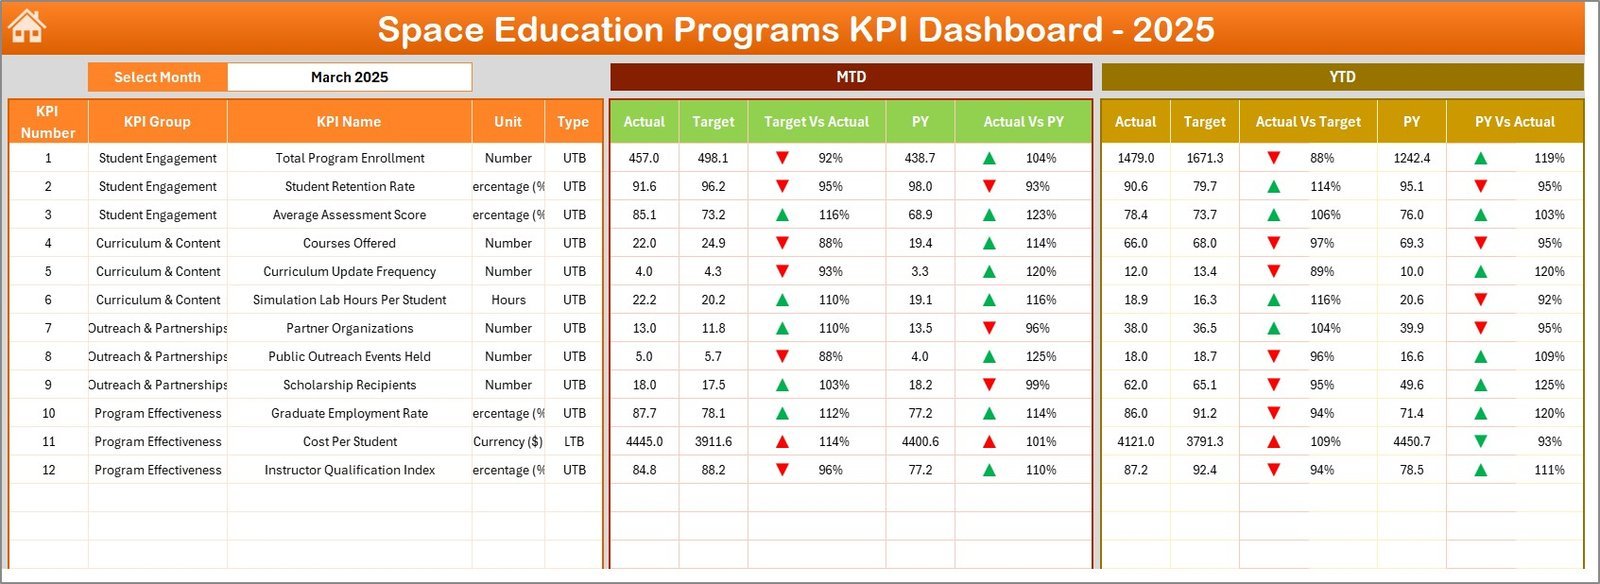
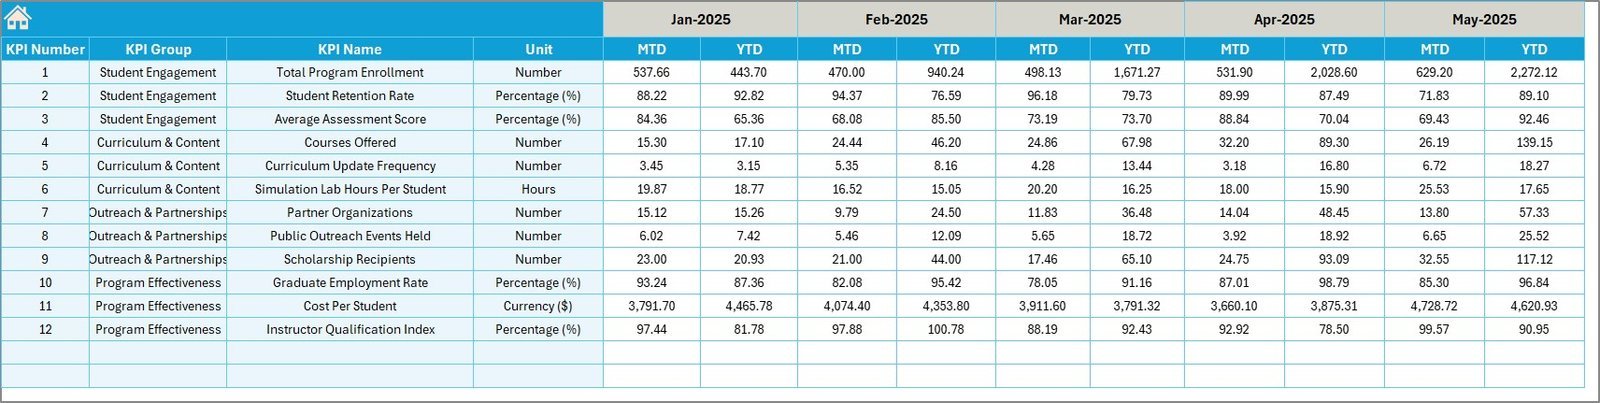
- 📊 Dashboard Sheet: The core of the product where you can select any month from a drop-down menu to view MTD (Month-To-Date) and YTD (Year-To-Date) actuals, targets, and previous year data with dynamic conditional formatting arrows to instantly spot performance trends.
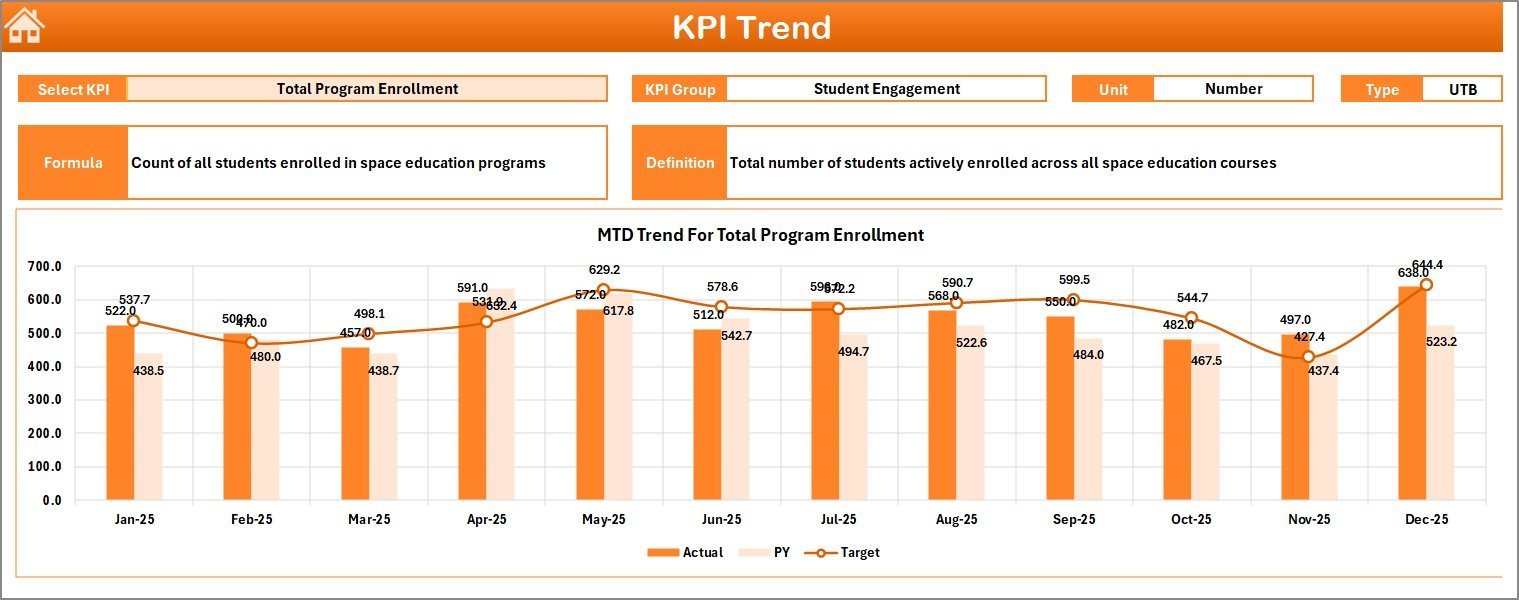
- 📈 KPI Trend Sheet: Track monthly and yearly trends for each KPI. Select any KPI from the drop-down to display detailed info including KPI Group, Unit, Type (Lower the Better or Upper the Better), Formula, definition, and trend charts for Actual, Target, and Previous Year data.
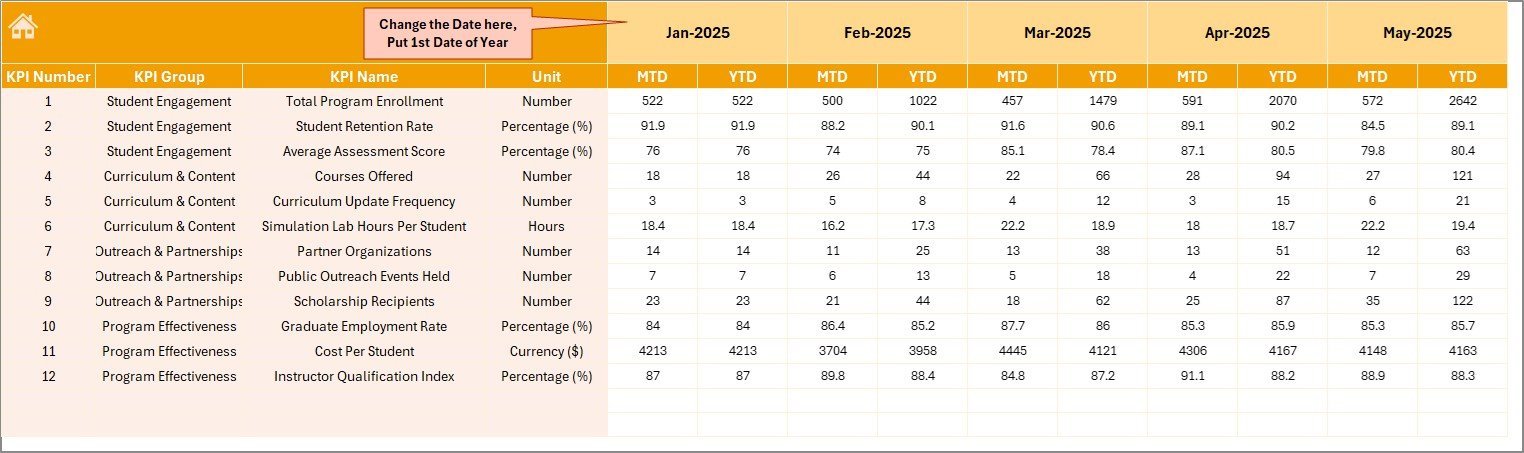
- ✍️ Actual Numbers Input Sheet: Input your actual monthly and yearly data easily by selecting the starting month of the year.
- 🎯 Target Number Input Sheet: Set your monthly and yearly target values for each KPI to benchmark your performance effectively.
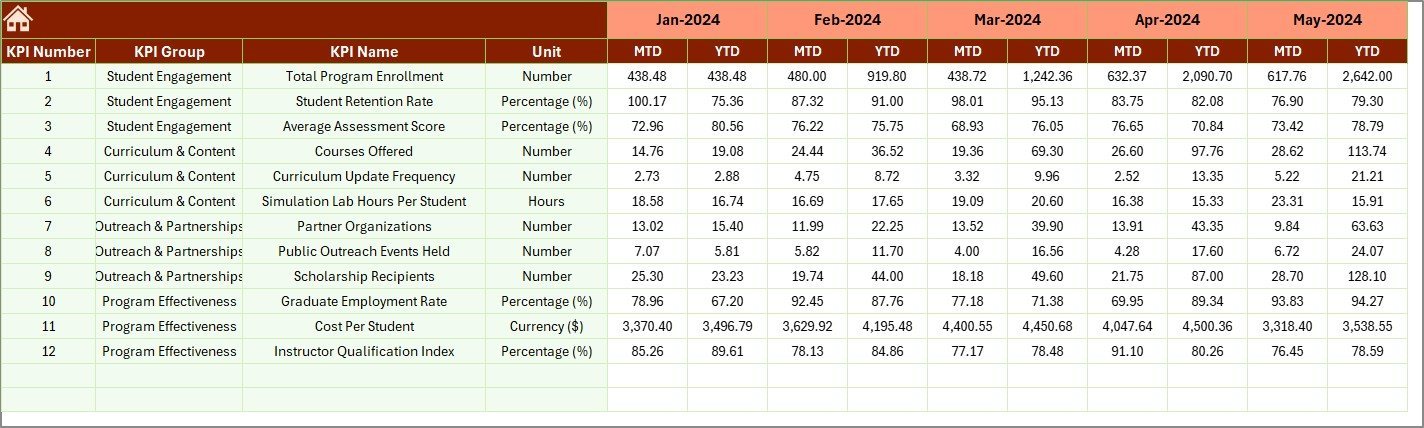
- 📅 Previous Year Number Sheet: Maintain a historical perspective by entering last year’s data for comparative analysis.
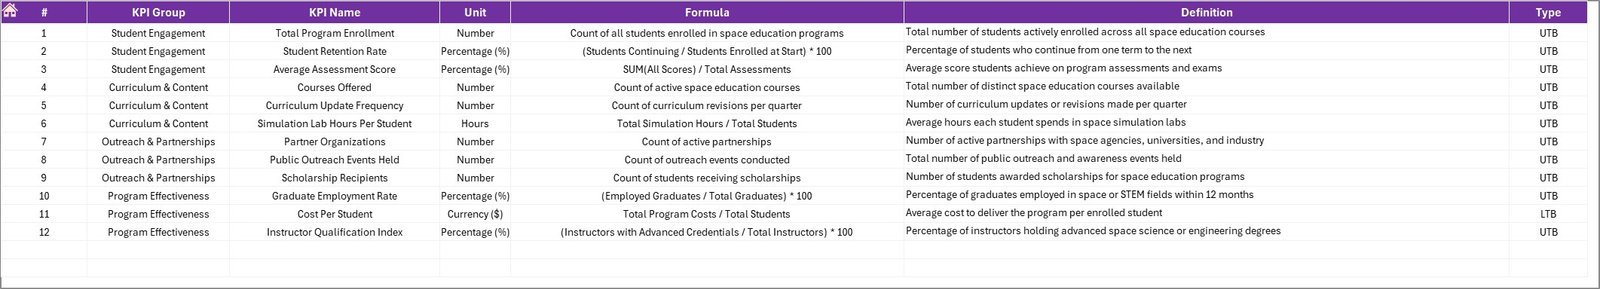
- 📚 KPI Definition Sheet: Define each KPI clearly with its name, group, unit, formula, and type to ensure consistent understanding and accurate reporting.
What’s Inside the Space Education Programs KPI Dashboard
This all-in-one digital product comes fully equipped with interactive features and easy-to-navigate worksheets that streamline your KPI tracking process:
- 🚀 Dynamic Month Selector: Filter KPIs by month, allowing for precise monthly and YTD performance insights.
- 📉 Conditional Formatting: Visual up/down arrows highlight your targets vs actuals and previous year comparisons, so you can quickly identify areas of success or concern.
- 📊 Comprehensive Trend Charts: Visualize performance trends over time to understand patterns and adjust strategies accordingly.
- 🗂️ Organized Data Input Sheets: Separate sheets for actuals, targets, and previous year data ensure your inputs remain organized and error-free.
- 📝 KPI Definitions & Formulas: A dedicated sheet to input and document detailed KPI information for clarity and team alignment.
- 💡 User-Friendly Navigation: Intuitive home sheet with clickable buttons to jump between all key areas of the dashboard effortlessly.
How to Use the Space Education Programs KPI Dashboard
Using this KPI dashboard is straightforward and designed for users of all skill levels. Simply follow these steps:
- 📅 Start by setting the Year’s first month in the Actual Numbers Input sheet to align data timelines.
- ✍️ Input your monthly actual numbers and target values for each KPI in their respective sheets.
- 📅 Enter previous year data to enable year-over-year comparisons and trend analysis.
- 🏠 Navigate to the Dashboard sheet to select your desired month and instantly view MTD and YTD results alongside performance indicators with clear visual cues.
- 📈 Explore the KPI Trend sheet to analyze detailed trends, compare KPI performance over time, and understand the behavior of each metric.
- 📝 Use the KPI Definition sheet to document and update KPI details, ensuring clarity and consistency.
- 🔄 Regularly update the input sheets to keep your dashboard current and actionable.
Who Can Benefit from This Space Education Programs KPI Dashboard
Whether you’re a program manager, educator, or analyst, this dashboard is designed to help you excel:
- 👩🏫 Educators and Trainers: Easily track student engagement, program effectiveness, and learning outcomes.
- 📊 Program Managers: Monitor KPIs to improve program delivery and meet strategic goals.
- 👨💻 Data Analysts: Analyze trends and generate reports that drive decision-making.
- 🏢 Space Education Institutions: Keep stakeholders informed with clear, actionable insights.
- 📈 Consultants & Auditors: Validate program performance with reliable data visualizations.
Click here to read the Detailed blog post.
Visit our YouTube channel to learn step-by-step video tutorials.


Reviews
There are no reviews yet.