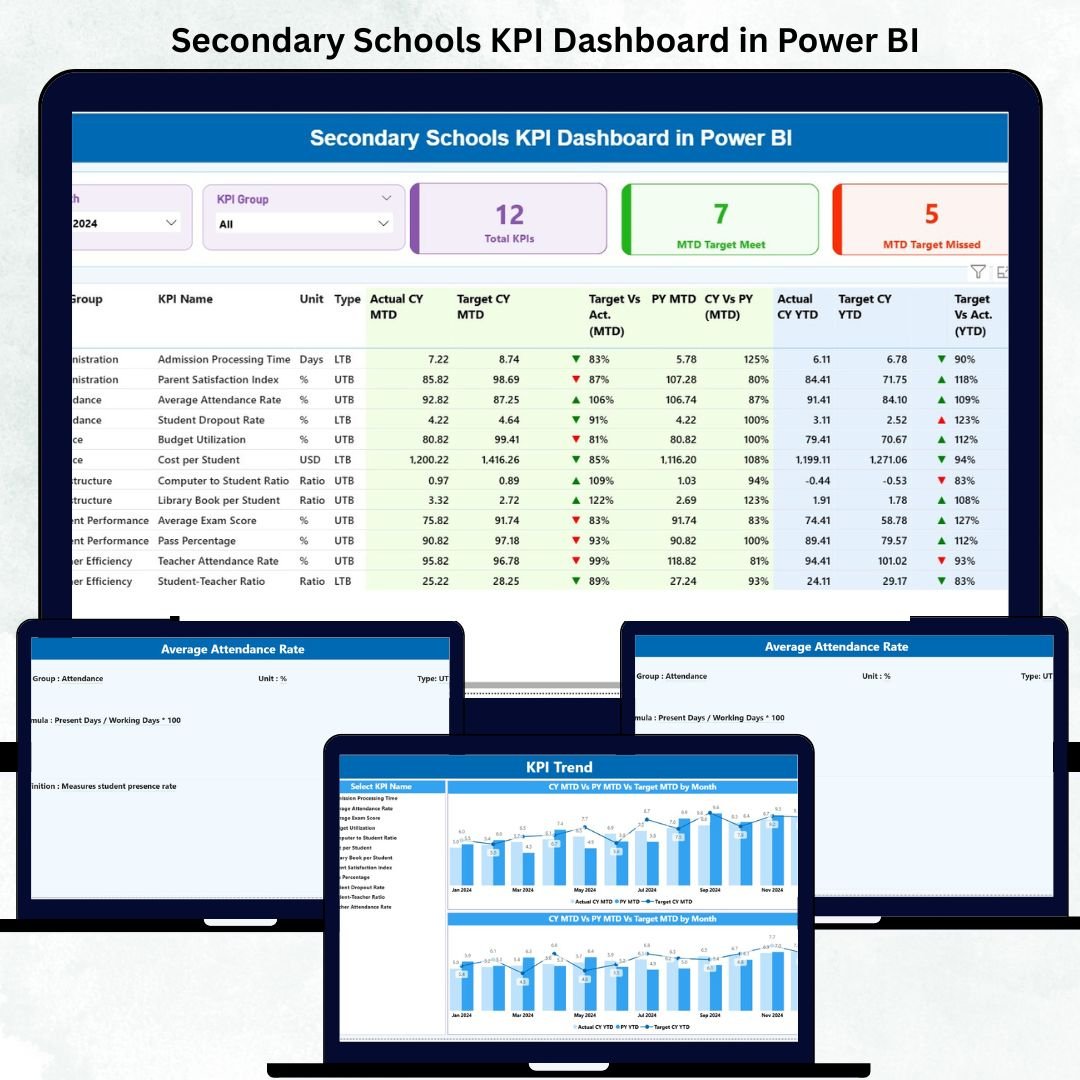
Education leaders today rely on data more than ever before. 🎓📊 The Secondary Schools KPI Dashboard in Power BI provides a modern, visual way to track academic, operational, and financial performance — all in one place.
This ready-to-use Power BI dashboard empowers principals, administrators, and teachers to make data-driven decisions by consolidating KPIs such as student attendance, teacher performance, exam results, and fee collection into interactive visuals.
Whether you manage one school or an entire district, this dashboard gives you real-time insights to measure progress, identify gaps, and improve outcomes with confidence.
✨ Key Features of Secondary Schools KPI Dashboard in Power BI
✅ Three Interactive Pages: Summary Page | KPI Trend Page | KPI Definition Page
✅ Dynamic MTD & YTD Analysis: Compare Month-to-Date and Year-to-Date results against targets.
✅ Excel Data Source: Easily update actual and target KPI data from Excel without changing the Power BI design.
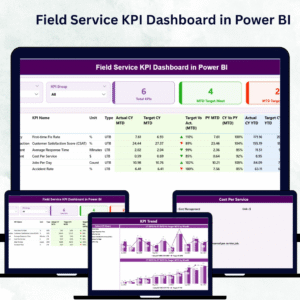
✅ Target vs Actual Indicators: Green ▲ for achieved and Red ▼ for missed goals.
✅ Automatic Trend Charts: Visualize Actual vs Target vs Previous Year data automatically.
✅ Drill-Through KPI Definitions: Understand each KPI’s formula, unit, and definition instantly.
✅ KPI Group & Month Slicers: Filter results interactively by month or category.
✅ Customizable Design: Add your logo, color theme, or new KPIs anytime.
With its intuitive layout, this Power BI template turns school performance data into actionable insights — no advanced analytics knowledge required!
📂 What’s Inside the Secondary Schools KPI Dashboard
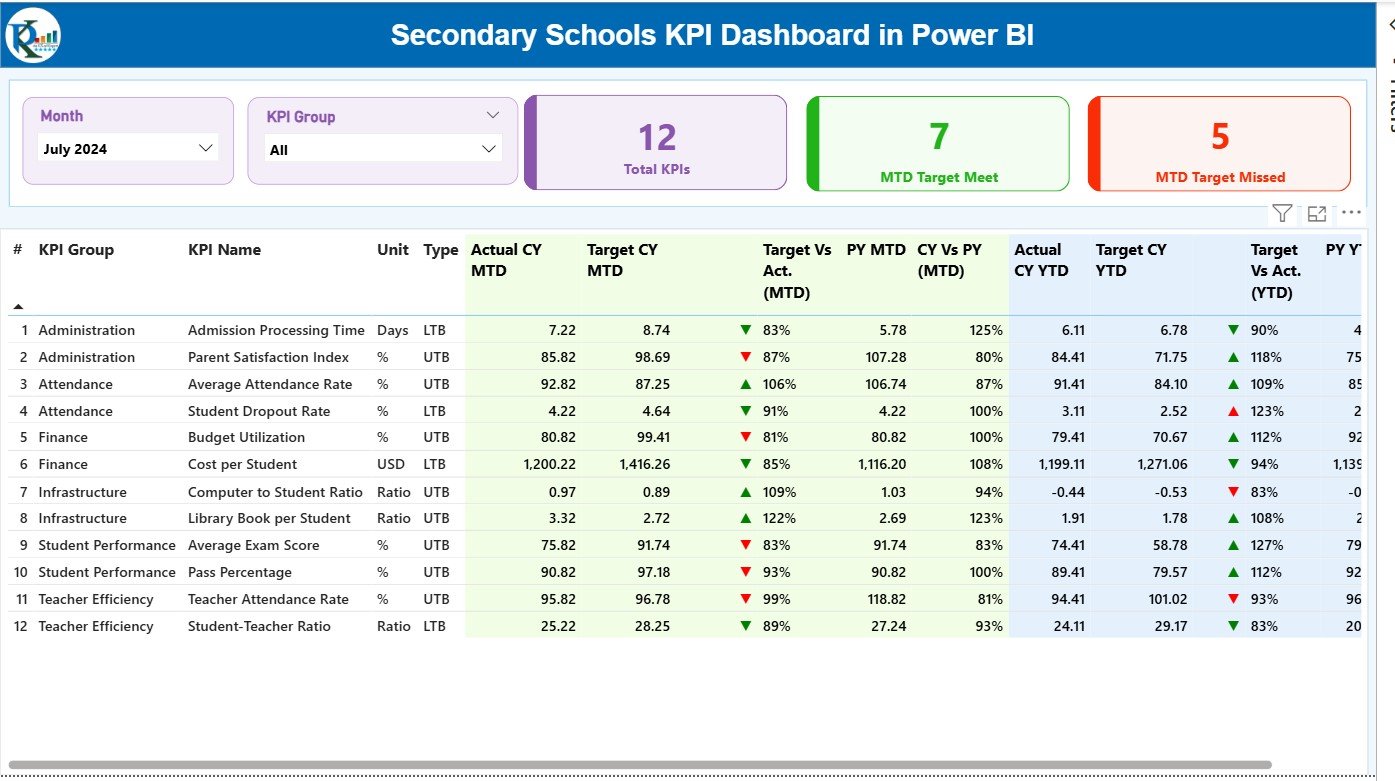
📊 1️⃣ Summary Page – Your Main Performance Hub
-
Month & KPI Group slicers for flexible filtering.
-
KPI Cards showing Total KPIs Count, MTD Target Met, and MTD Target Missed.
-
Detailed Table View listing:
-
KPI Number | KPI Group | KPI Name | Unit | Type (LTB/UTB)
-
Actual vs Target values for MTD and YTD
-
CY vs PY comparisons and achievement percentages
-
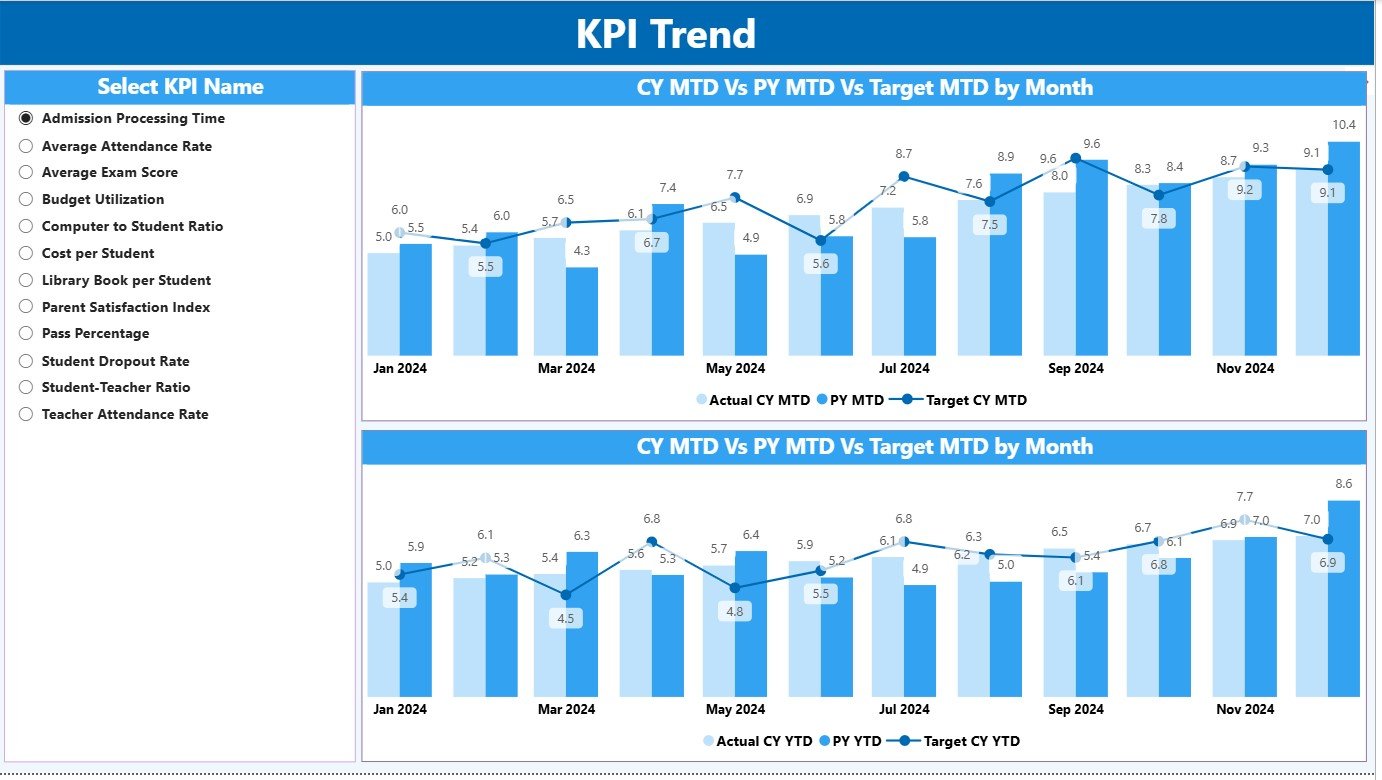
📈 2️⃣ KPI Trend Page – Understand Performance Patterns
-
Select any KPI from the slicer to view month-by-month Actual vs Target vs Previous Year performance.
-
Combo charts reveal patterns and seasonal trends.
-
Perfect for academic planning and data reviews.
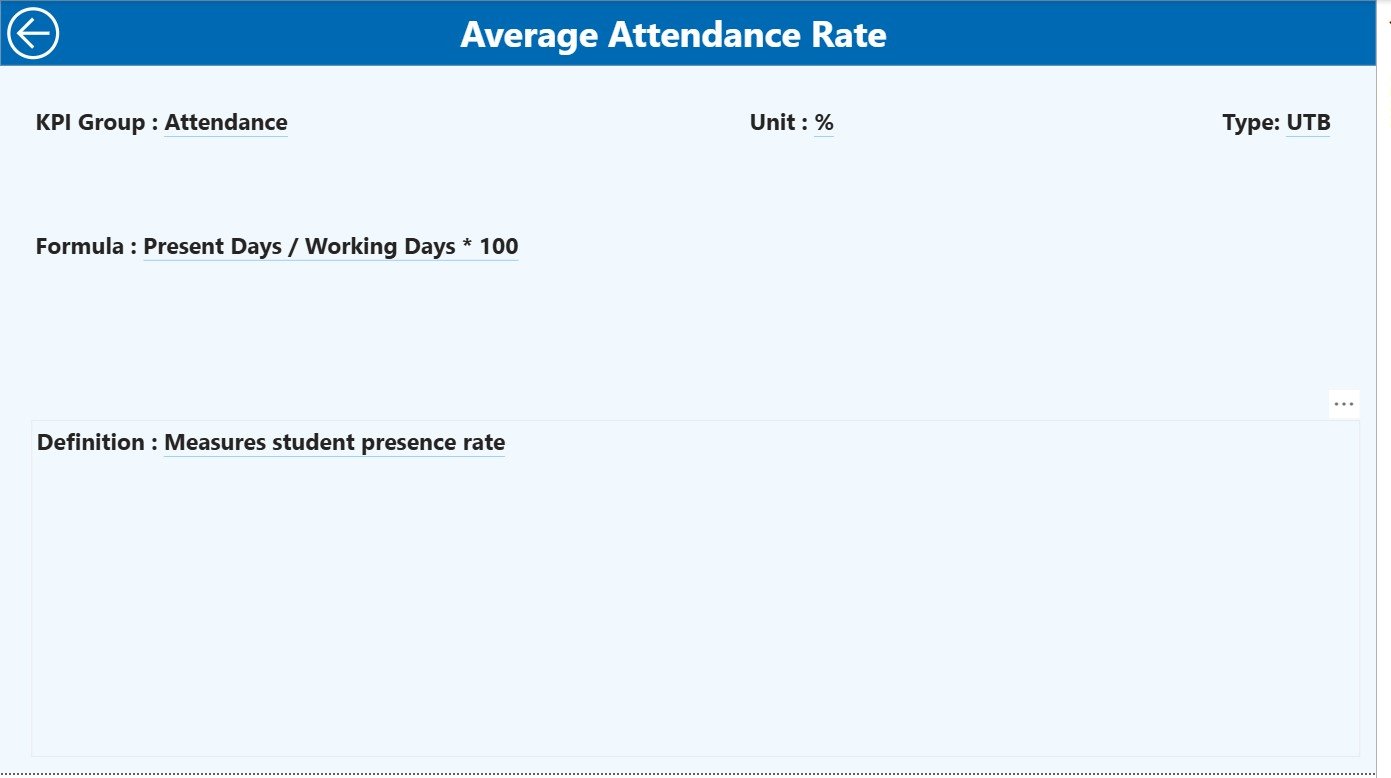
📘 3️⃣ KPI Definition Page – Complete Transparency
-
Drill-through page containing every KPI’s formula, definition, and type.
-
“Back” button returns you to the Summary Page.
-
Ensures all users interpret metrics consistently.
📊 Excel Data Source Structure:
-
Input_Actual: Enter monthly Actual MTD & YTD data.
-
Input_Target: Enter monthly Target MTD & YTD values.
-
KPI Definition: List each KPI’s Number, Group, Unit, Formula, Definition, and Type.
🎯 Common KPIs Tracked in the Dashboard
Academic: Average Exam Score %, Pass Rate %, Top Performer Count
Teacher: Attendance %, Lesson Plan Completion %, Training Hours per Teacher
Student: Attendance %, Homework Submission %, Extracurricular Participation
Financial: Fee Collection Rate %, Operational Cost per Student (USD)
Administrative: Parent Meeting Attendance %, Staff-to-Student Ratio, Facility Requests
🧭 How to Use the Secondary Schools KPI Dashboard
1️⃣ Prepare Excel Data – Fill in KPI definitions, actuals, and targets.
2️⃣ Open Power BI – Load the Excel file and refresh the model.
3️⃣ Analyze Results – Use Month and KPI Group filters on the Summary Page.
4️⃣ Drill Through – Right-click any KPI for definition details.
5️⃣ Export Reports – Generate PDF summaries or share interactive Power BI links.
Within minutes, you’ll see live school performance visualized beautifully.
👥 Who Can Benefit from This Dashboard
🎓 Principals & Administrators: Monitor overall academic and financial performance.
👩🏫 Teachers & HODs: Track attendance and lesson plan completion.
💰 Finance & HR Teams: Analyze cost efficiency and staffing metrics.
🏫 Education Boards: Compare multiple schools on a single standardized template.
This dashboard simplifies school performance analysis for everyone — from principals to policy makers.


Reviews
There are no reviews yet.