Every high-performing sales organization relies on a clear, measurable sales funnel. Leads enter at the top, opportunities progress through stages, and deals close at the bottom. However, when sales data remains scattered across CRMs, spreadsheets, and emails, teams lose visibility. Bottlenecks go unnoticed, conversion rates drop, and revenue growth slows.
That is exactly why the Sales Funnel KPI Dashboard in Google Sheets becomes a critical sales management tool.
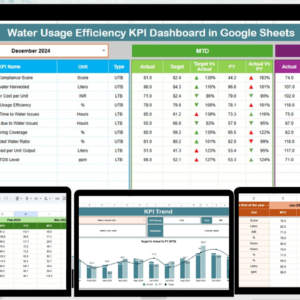
This ready-to-use dashboard converts raw sales numbers into structured KPIs, comparisons, and trends that show exactly how your funnel performs. It helps sales leaders, managers, and revenue teams track performance at every stage—from lead generation to deal closure—without relying on expensive BI tools or complex systems. With clear visuals, automated calculations, and comparison logic, the dashboard replaces guesswork with data-driven insights.
Because it is built entirely in Google Sheets, the dashboard is easy to use, collaborative, and accessible from anywhere.
✨ Key Features of the Sales Funnel KPI Dashboard in Google Sheets
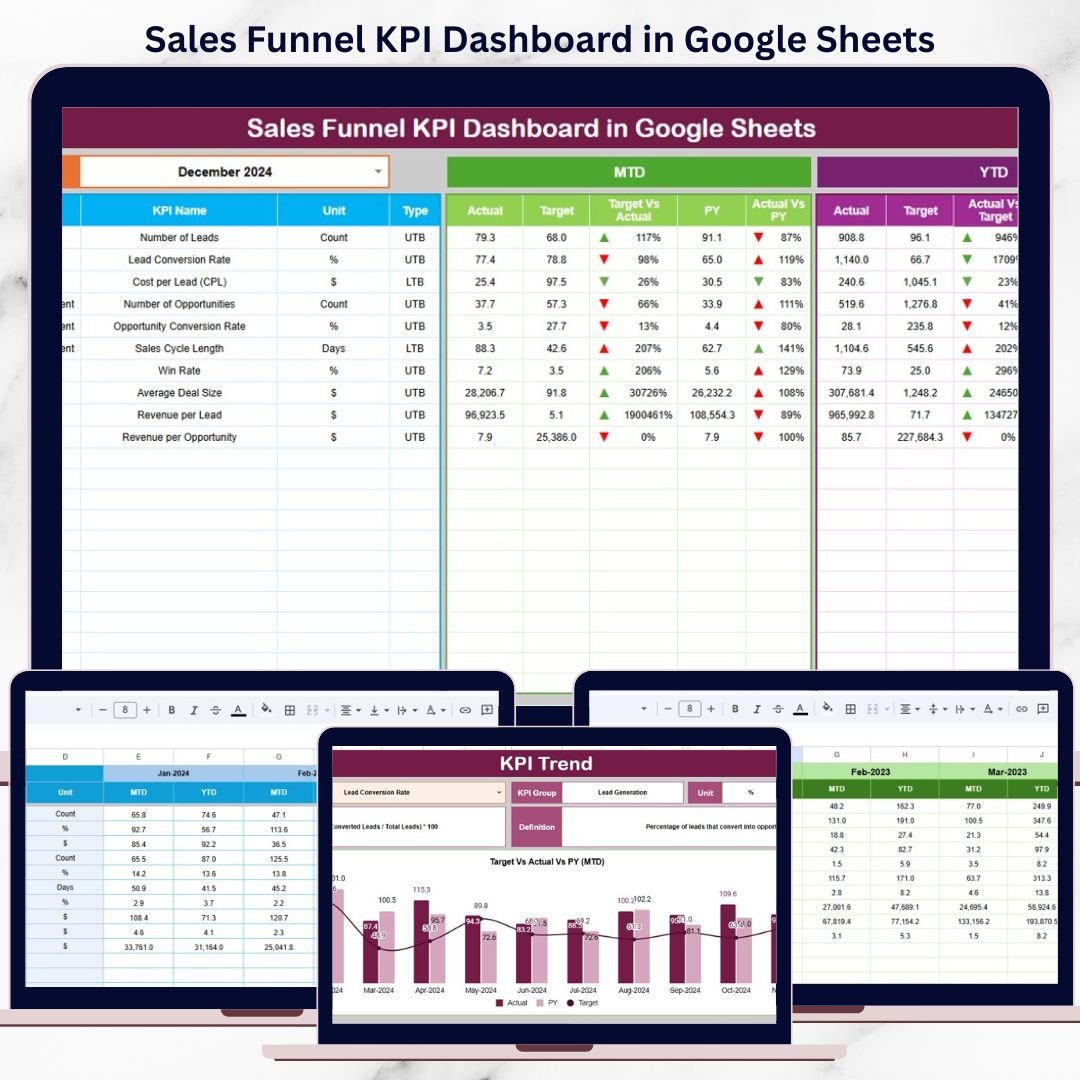
📊 1. MTD & YTD Funnel Performance Tracking
Monitor Month-to-Date and Year-to-Date KPIs for every stage of the sales funnel. A single month selection refreshes the entire dashboard instantly.
🎯 2. Target vs Actual & Previous-Year Comparison
Compare actual sales performance against targets and last year’s benchmarks to understand growth, gaps, and momentum.
📈 3. Visual Performance Indicators
Conditional formatting arrows provide instant clarity:
-
🟢 Green arrow → performance improvement
-
🔴 Red arrow → decline or slowdown
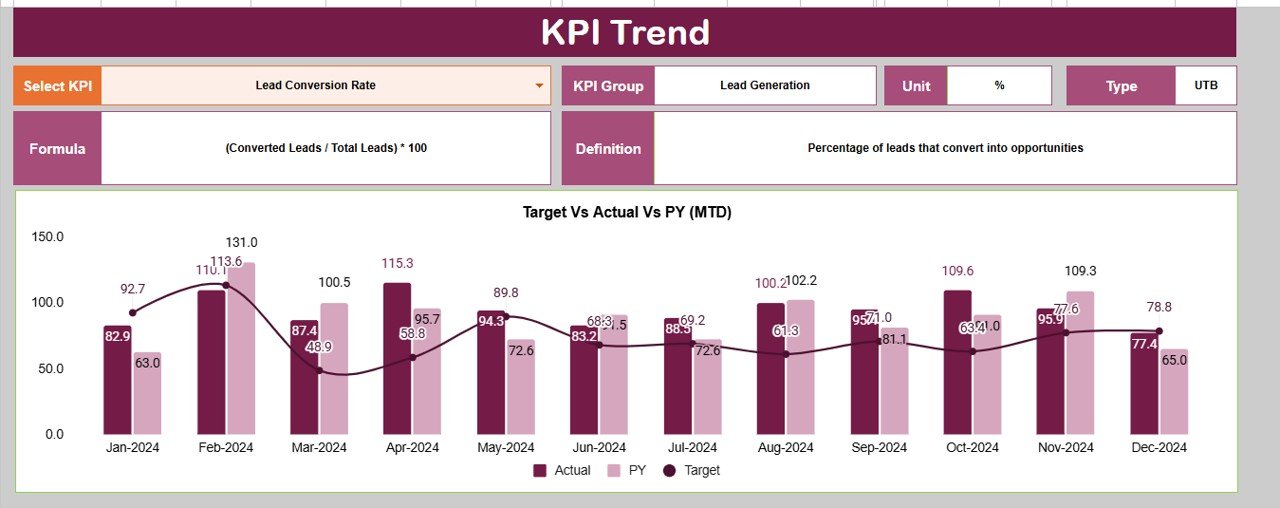
📉 4. KPI Trend Analysis
Track month-wise KPI movement to identify drop-off points, conversion issues, and long-term funnel health.
☁️ 5. Google Sheets-Based & Collaborative
Enable real-time collaboration across sales, operations, and leadership teams with one shared source of truth.
📦 What’s Inside the Sales Funnel KPI Dashboard in Google Sheets
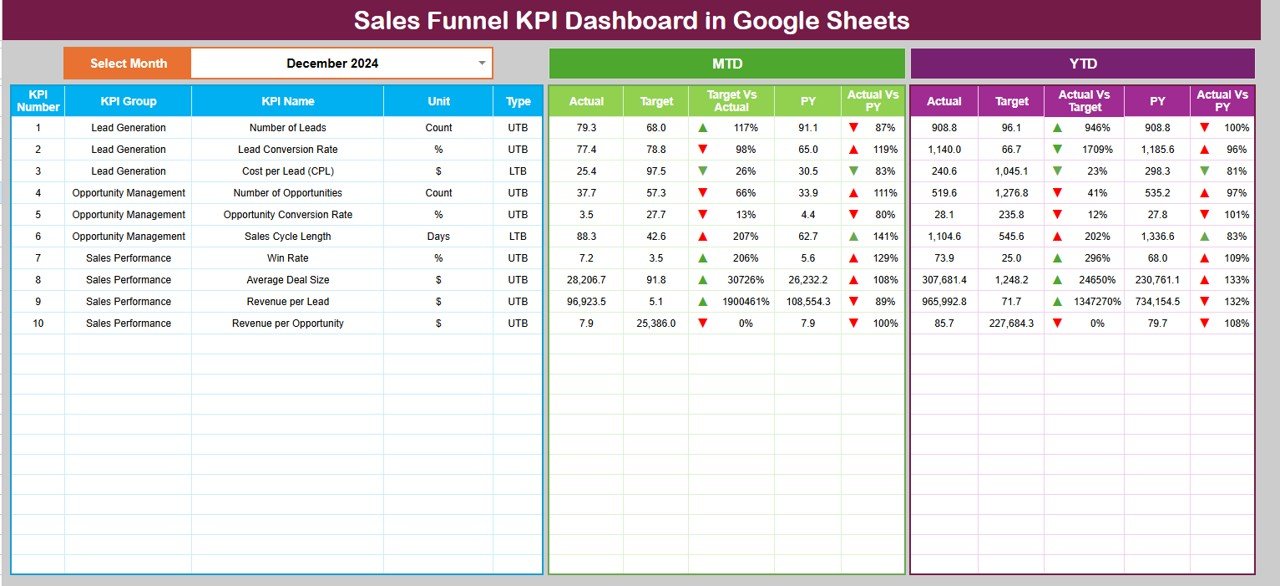
🖥️ Dashboard Sheet Tab (Main Control Center)
This is the executive view used during sales reviews and leadership meetings.
Month Selector
-
Located in cell D3
-
Automatically updates all KPIs
MTD Metrics Displayed
-
Actual
-
Target
-
Previous Year
-
Target vs Actual
-
Previous Year vs Actual
YTD Metrics Displayed
-
Actual
-
Target
-
Previous Year
-
Target vs Actual
-
Previous Year vs Actual
This structure gives a complete short-term and long-term performance snapshot in seconds.
📊 KPI Trend Sheet Tab
This sheet supports deep analysis of individual sales KPIs.
How It Works
-
Select a KPI from the dropdown in cell C3
Details Displayed
-
KPI Group
-
KPI Unit
-
KPI Type (UTB / LTB)
-
KPI Formula
-
KPI Definition
Trend Visualization
-
Month-wise KPI movement
-
Conversion pattern changes
-
Funnel performance gaps
This sheet is ideal for diagnosing why deals slow down or drop off.
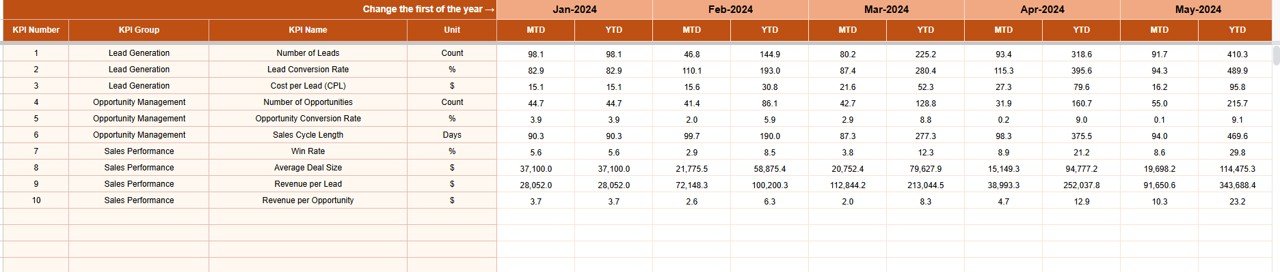
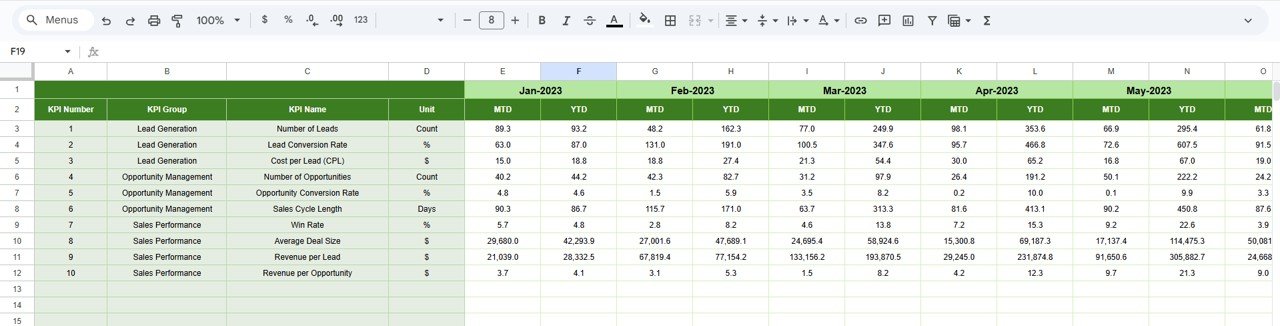
📋 Actual Number Sheet Tab
This is the structured data-entry sheet for real sales results.
-
Enter MTD Actual values
-
Enter YTD Actual values
-
Set the first month of the year in cell E1
All calculations and dashboard visuals update automatically.
🎯 Target Sheet Tab
This sheet stores sales goals and benchmarks.
-
Monthly (MTD) targets
-
Annual (YTD) targets
Targets keep sales teams aligned with revenue objectives and accountability.
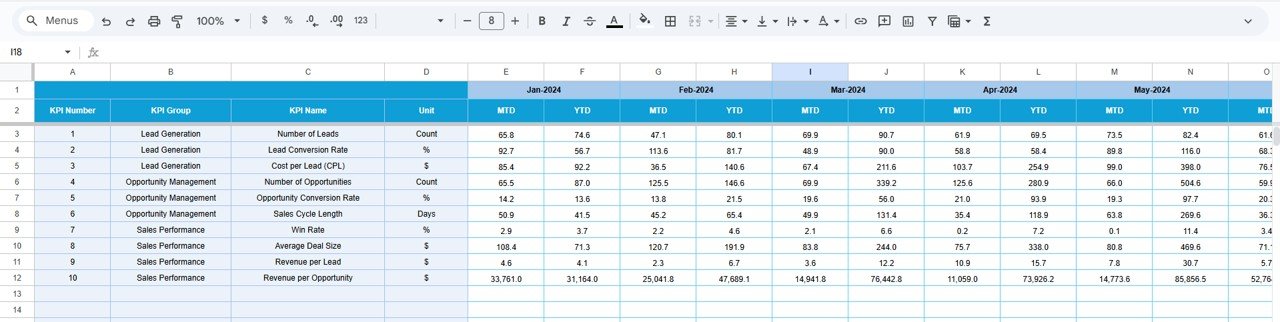
📆 Previous Year Number Sheet Tab
Stores last year’s sales funnel performance data to enable:
-
Year-over-year growth analysis
-
Seasonal performance comparison
-
Long-term trend evaluation
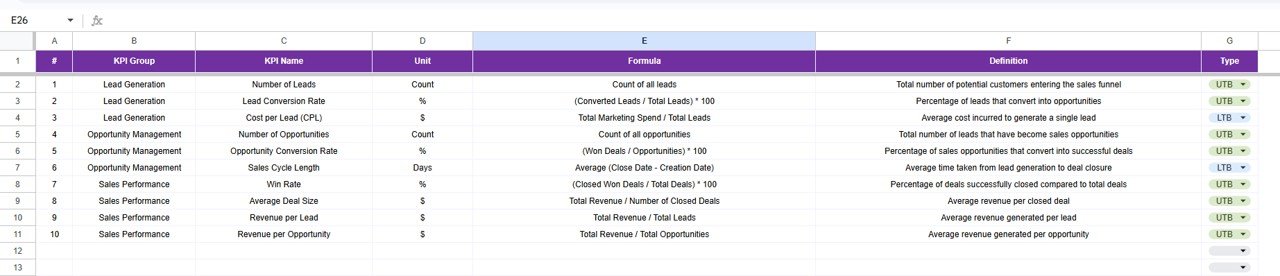
📘 KPI Definition Sheet Tab
This is the governance layer of the dashboard.
It contains:
-
KPI Name
-
KPI Group
-
Unit
-
Formula
-
KPI Definition
-
KPI Type (UTB / LTB)
This ensures consistent interpretation across sales teams.
🎯 Who Can Benefit from This Sales Funnel KPI Dashboard
📈 Sales Managers & Leaders
Track funnel health, conversion rates, and revenue progress clearly.
💼 Business Owners & Founders
Understand pipeline strength and growth without CRM complexity.
🚀 Revenue & Growth Teams
Identify bottlenecks early and improve deal velocity.
📊 Sales Operations Teams
Standardize sales reporting and KPI tracking.
🏢 Organizations of Any Size
Improve sales visibility without costly BI tools.
### Click here to read the Detailed blog post
Watch the step-by-step video tutorial:


Reviews
There are no reviews yet.