


Revenue is the backbone of every business decision. Pricing strategies, sales planning, marketing investments, and expansion plans all depend on how well organizations understand their revenue performance. However, many businesses still rely on scattered spreadsheets, manual calculations, and static reports. As a result, leaders struggle to identify revenue leaks, underperforming products, or regions missing targets.
That is exactly where the Revenue Analysis Dashboard in Google Sheets becomes a powerful and practical solution.
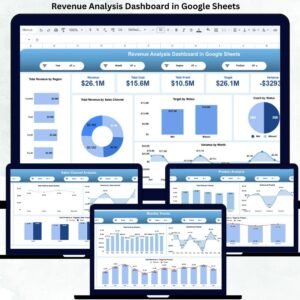
This ready-to-use dashboard transforms raw revenue, cost, and target data into clear, visual, and actionable insights. It helps organizations track revenue, cost, profit, targets, and variance across products, regions, sales channels, and time periods—all in one centralized view. Instead of switching between multiple files, decision-makers gain instant clarity on what drives growth and what needs correction.
Because the dashboard is built entirely in Google Sheets, it is cloud-based, collaborative, flexible, and cost-effective. Teams can access it anytime, update data in real time, and collaborate without purchasing expensive BI tools or complex software.
🚀 Key Features of the Revenue Analysis Dashboard
-
📊 Centralized revenue, cost, and profit tracking
-
🎯 Target vs actual performance comparison
-
📉 Variance analysis for early issue detection
-
📦 Product-wise revenue and profit insights
-
🌍 Region-wise performance analysis
-
🛒 Sales channel effectiveness tracking
-
📆 Monthly trend analysis for forecasting
-
🔍 Smart search by keyword & field name
-
🤝 Real-time collaboration in Google Sheets
-
⚙️ Fully customizable structure
📦 What’s Inside the Revenue Analysis Dashboard
The dashboard is designed with multiple analytical sections, each focused on a specific business perspective.
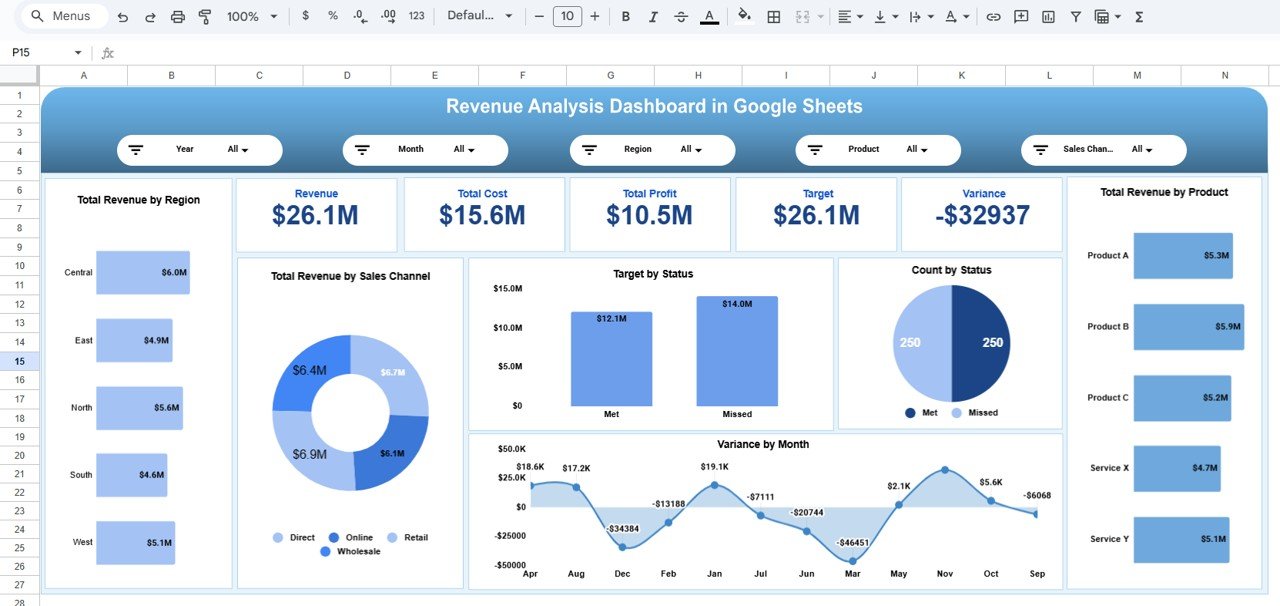
📌 Overview Sheet Tab – Executive Summary
This is the main decision-making page for leadership.
KPI Cards Displayed
-
Revenue – Total revenue generated
-
Total Cost – Combined operational and sales costs
-
Total Profit – Revenue minus cost
-
Target – Planned revenue goal
-
Variance – Difference between actual revenue and target
Charts Included
-
📦 Total Revenue by Product
-
🎯 Target Met Count by Status
-
📉 Variance by Month
-
📊 Target vs Actual by Status
-
🛒 Total Revenue by Sales Channel
-
🌍 Total Revenue by Region
This page answers one critical question instantly: Are we meeting revenue expectations or not?
🌍 Region Analysis Section
This section highlights geographical performance differences.
Key Insights
-
✔️ Target Met Count by Region
-
💰 Total Cost by Region
-
📈 Total Profit by Region
-
🎯 Revenue vs Target by Region
-
📉 Variance by Region
Leaders can quickly identify high-performing and underperforming regions and take corrective actions.
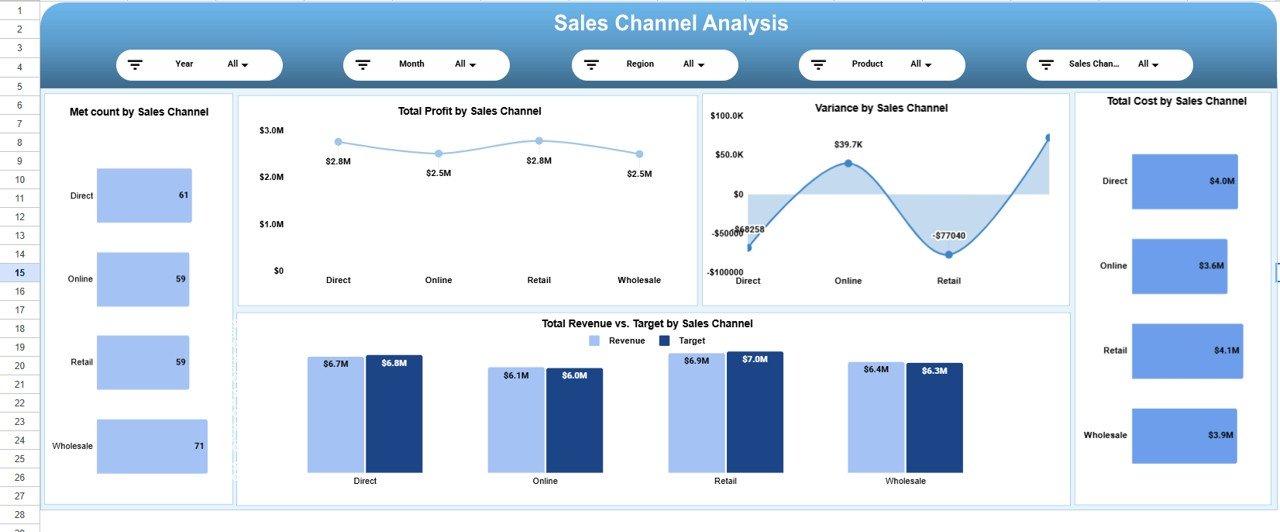
🛒 Sales Channel Analysis Section
Sales channels often determine profitability. This section evaluates channel efficiency.
Charts Included
-
✔️ Target Met Count by Sales Channel
-
📈 Total Profit by Sales Channel
-
📉 Variance by Sales Channel
-
💰 Total Cost by Sales Channel
-
🎯 Revenue vs Target by Sales Channel
This analysis helps businesses optimize marketing spend and focus on high-ROI channels.
📦 Product Analysis Section
Products define revenue success. This section focuses on product-level performance.
Key Charts
-
✔️ Target Met Count by Product
-
📈 Total Profit by Product
-
📉 Variance by Product
-
💰 Total Cost by Product
-
🎯 Revenue vs Target by Product
With this insight, teams can refine pricing, promotions, and product strategy.
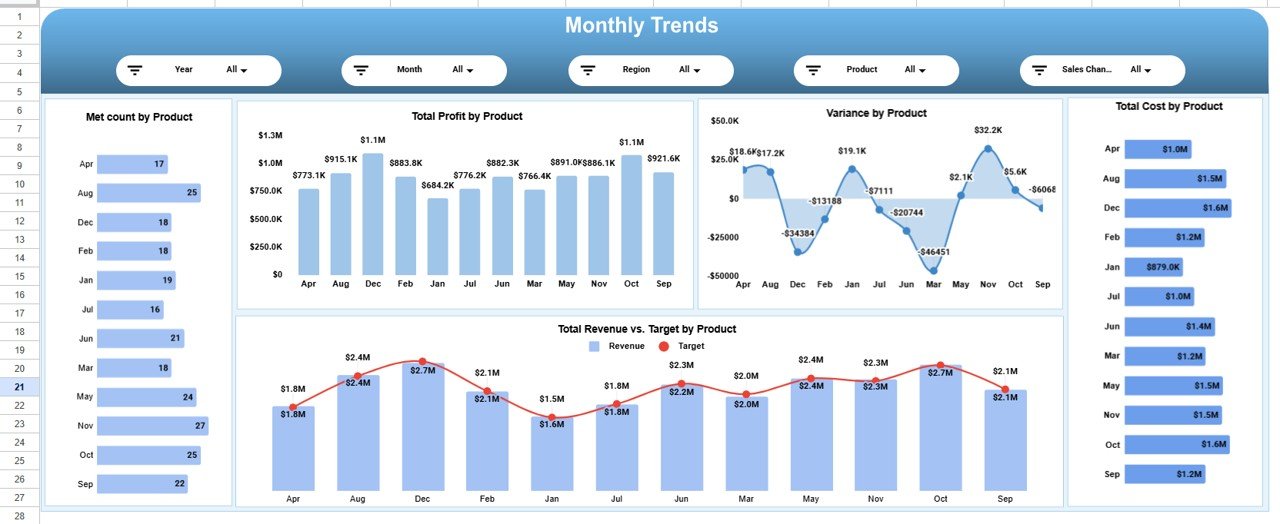
📆 Monthly Trends Section
Understanding trends is essential for forecasting and planning.
Trend Charts
-
✔️ Target Met Count by Month
-
📈 Total Profit by Month
-
📉 Variance by Month
-
🎯 Revenue vs Target by Month
-
💰 Total Cost by Month
This section reveals seasonality, volatility, and growth patterns.
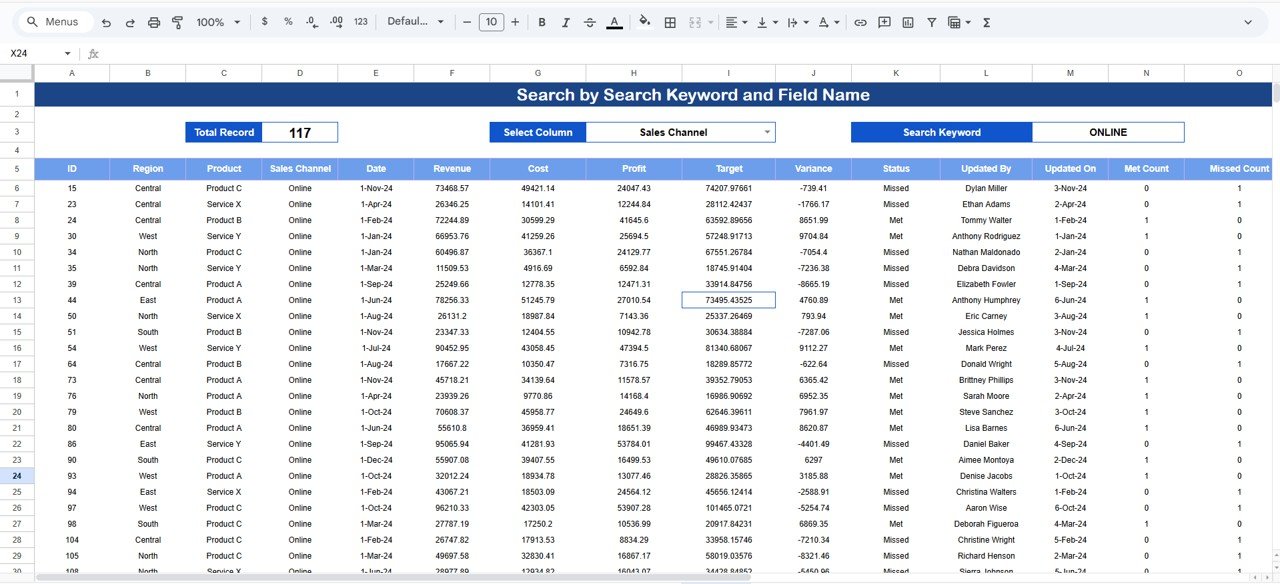
🔍 Search Functionality – Smart & Fast Analysis
The dashboard includes a powerful search panel.
You can search by:
-
Product
-
Region
-
Sales Channel
-
Status
-
Month
Simply enter a Search Keyword and select a Field Name, and the dashboard instantly filters relevant records—saving hours of manual work.
🛠️ How to Use the Revenue Analysis Dashboard
1️⃣ Update revenue, cost, and target data
2️⃣ Review KPI cards for quick insights
3️⃣ Analyze variance and profit drivers
4️⃣ Drill down by product, region, or channel
5️⃣ Track monthly trends for forecasting
6️⃣ Use search during reviews and audits
👥 Who Can Benefit from This Dashboard
-
🧑💼 Business Owners & Founders
-
💼 Finance & Accounting Teams
-
📊 Sales & Revenue Managers
-
📈 Strategy & Planning Teams
-
🏢 Leadership & Executives
### Click here to read the Detailed blog post
Watch the step-by-step video tutorial:


Reviews
There are no reviews yet.