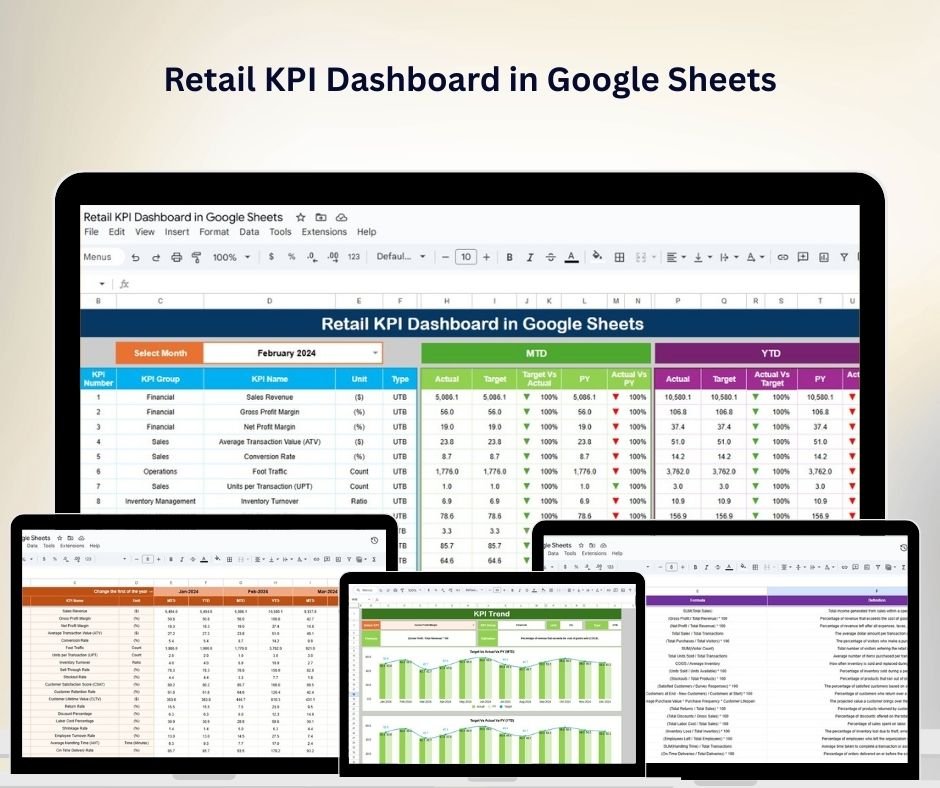
The Retail KPI Dashboard in Google Sheets is a powerful, customizable tool designed to help retail businesses efficiently monitor, analyze, and optimize their key performance indicators (KPIs). Whether you’re tracking sales, managing inventory, or understanding customer behavior, this dashboard centralizes critical data to help you make informed decisions that improve business performance and drive growth.
With real-time updates and easy-to-use features, this dashboard allows retail managers, analysts, and business owners to keep a close eye on the most important metrics. The Retail KPI Dashboard in Google Sheets simplifies the process of monitoring daily, monthly, and yearly sales figures, while also providing valuable insights into stock levels, profit margins, customer acquisition costs, and more.

Key Features of the Retail KPI Dashboard:
📊 Comprehensive KPI Tracking:
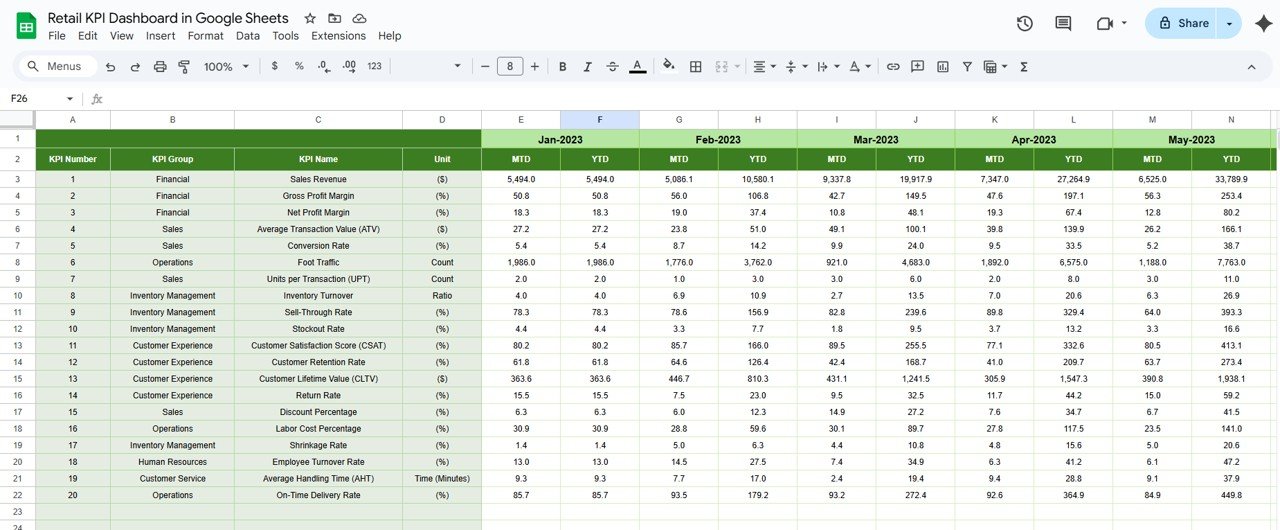
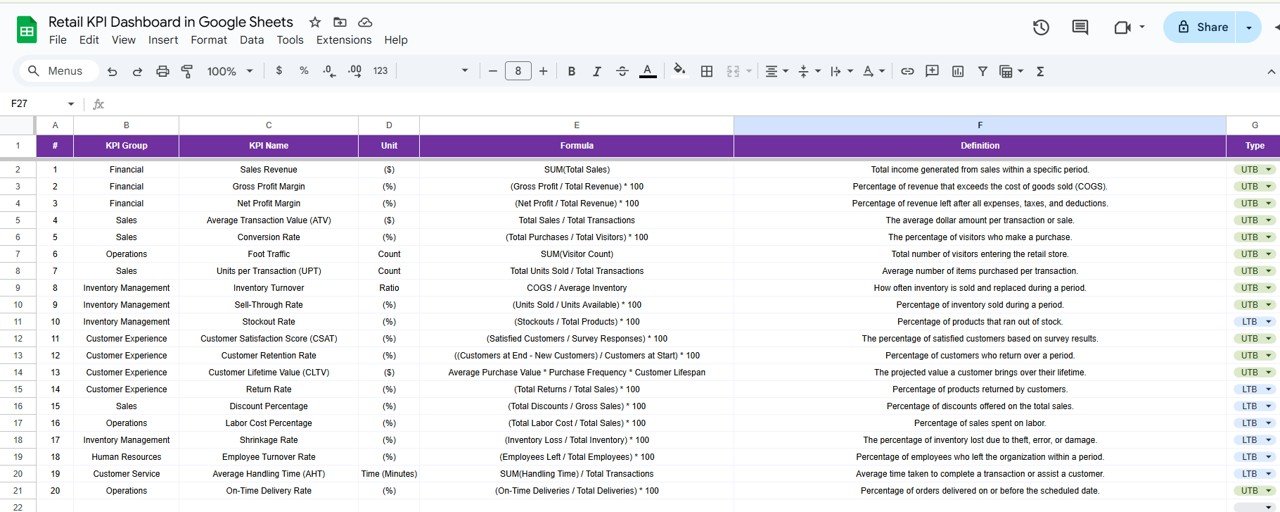
Track a wide range of essential retail KPIs including:
-
Sales Revenue & Profit Margin – Understand the financial health of your business.
-
Inventory Turnover – Monitor how efficiently products are sold and replaced.
-
Customer Acquisition Costs (CAC) – Evaluate the cost-effectiveness of your marketing campaigns and customer acquisition strategies.
-
Sales Conversion Rates – Analyze how well your marketing and sales efforts are converting leads into customers.
-
Average Order Value (AOV) – Keep track of the average spend per customer to identify opportunities for upselling and cross-selling.
📈 Real-Time Data Integration:
Seamlessly integrate your retail data into the dashboard, ensuring that metrics are updated automatically. By connecting to your existing sales and inventory management systems, you can ensure that the information presented is always up-to-date, providing you with a real-time view of your business performance.
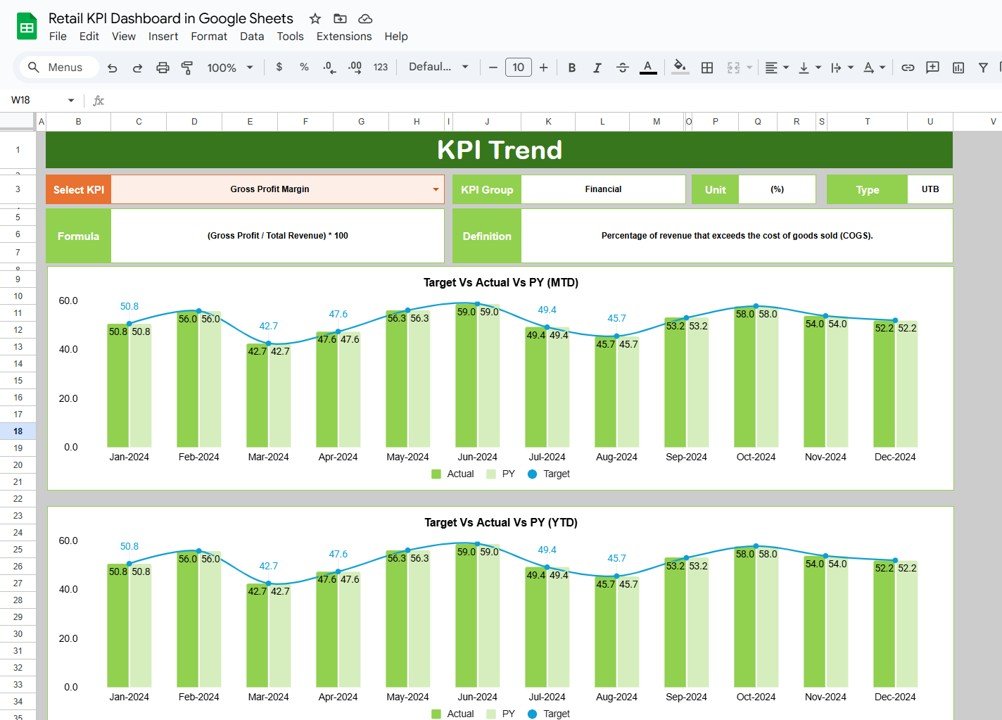
📊 Visual Data Representation:
Data can be overwhelming, but with this dashboard, you can easily visualize trends, patterns, and anomalies through charts, graphs, and visual indicators. These include line charts, bar charts, pie charts, and more, which simplify the process of identifying important insights and making data-driven decisions.
🛠️ Customizable Dashboard:
The dashboard is highly customizable, allowing you to adjust which KPIs are tracked based on your specific business needs. Whether you want to focus more on sales performance, customer engagement, or inventory management, this dashboard can be tailored to reflect your business goals and priorities.
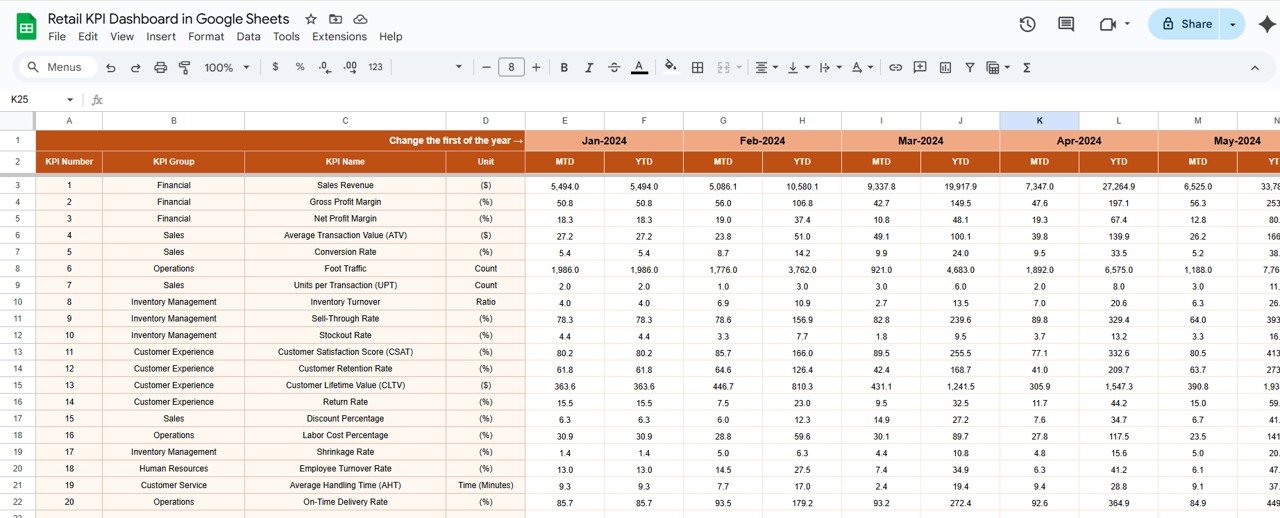
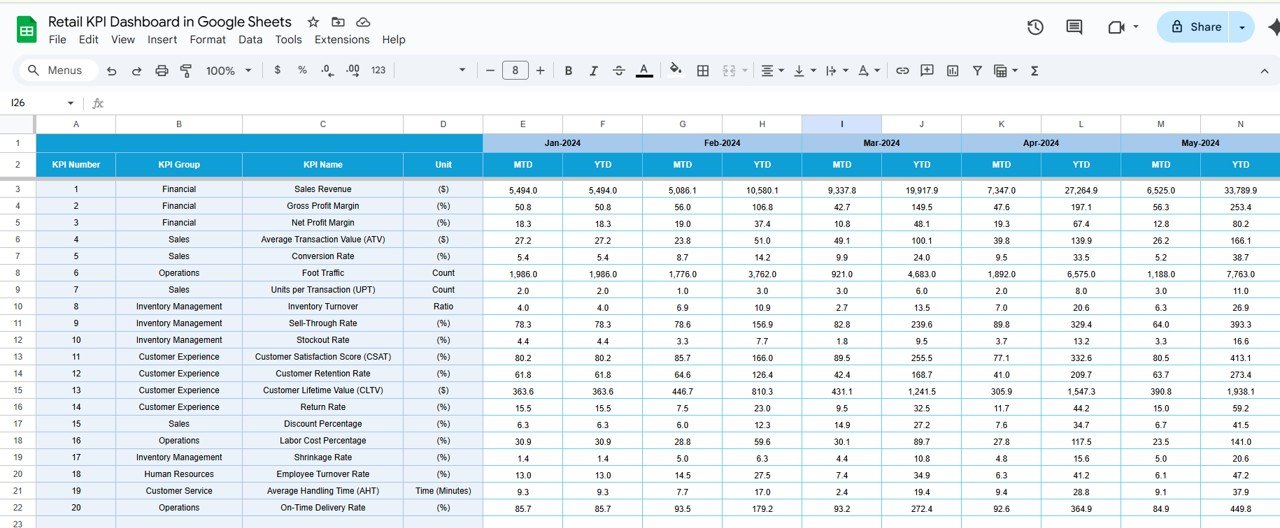
📅 Monthly and Yearly Overview:
Get a quick snapshot of your sales and performance for both current and previous periods, allowing you to analyze trends over time and identify areas of strength or concern. The ability to compare monthly and yearly performance helps with forecasting and setting realistic sales targets.
📉 Performance Insights & Alerts:
The dashboard provides visual performance alerts to quickly identify areas that need attention. If sales fall below targets or inventory is running low, you’ll receive immediate visual cues so you can act promptly and make necessary adjustments to improve performance.
Benefits of Using the Retail KPI Dashboard:
-
Enhanced Performance Monitoring:
Stay on top of your retail operations with a centralized view of all the critical metrics that drive your business forward. Whether it’s sales performance, customer behavior, or stock levels, you’ll have the insights you need to monitor your retail success. -
Data-Driven Decision Making:
This dashboard gives you a clear, data-driven picture of your business operations, enabling better decisions in real time. From marketing strategy adjustments to sales goal setting, you’ll have the data you need to guide your decisions and improve overall performance. -
Optimized Resource Allocation:
By tracking KPIs related to sales, inventory, and marketing, the dashboard helps you identify underperforming areas where resources could be better allocated, reducing waste and increasing efficiency. -
Scalability:
Whether you’re running a small local shop or managing a large retail chain, the Retail KPI Dashboard in Google Sheets is scalable. You can adjust the dashboard as your business grows by adding new KPIs, adjusting metrics, and integrating additional data sources. -
Easy Setup and Use:
With an intuitive design, the dashboard is easy to set up and doesn’t require advanced technical skills. Even users with minimal experience in Google Sheets can navigate and get the most out of this tool.
How to Use the Retail KPI Dashboard in Google Sheets:
1️⃣ Download the Template:
Obtain the Retail KPI Dashboard and save it to your Google Drive for easy access.
2️⃣ Input Data:
Enter your sales, inventory, and marketing data into the respective sections of the dashboard. You can also link your existing data sources for automatic updates.
3️⃣ Customize Your KPIs:
Adjust the KPIs being tracked to align with your business priorities, whether that’s focusing on sales revenue, customer metrics, or inventory management.
4️⃣ Track Performance:
Use the visual charts and performance indicators to monitor sales trends, customer acquisition, inventory performance, and more.
5️⃣ Optimize and Plan:
With all your KPIs in one place, you can quickly spot opportunities for improvement, optimize inventory, adjust pricing strategies, and set achievable sales targets for future growth.
Who Can Benefit from This Dashboard?
-
Retail Managers:
Monitor and optimize sales performance, inventory turnover, and marketing efforts for maximum efficiency and profitability. -
Data Analysts:
Analyze sales trends, customer behavior, and operational performance to inform strategies and decision-making. -
Business Owners:
Use the dashboard to monitor your business at a high level, track progress towards goals, and make informed decisions based on real-time data. -
Marketing Teams:
Track customer acquisition costs and sales conversion rates to refine marketing strategies and improve ROI.
click here read to detailed blog post
Visit our YouTube channel to learn step-by-step video tutorials
Youtube.com/@NeotechNavigators


Reviews
There are no reviews yet.