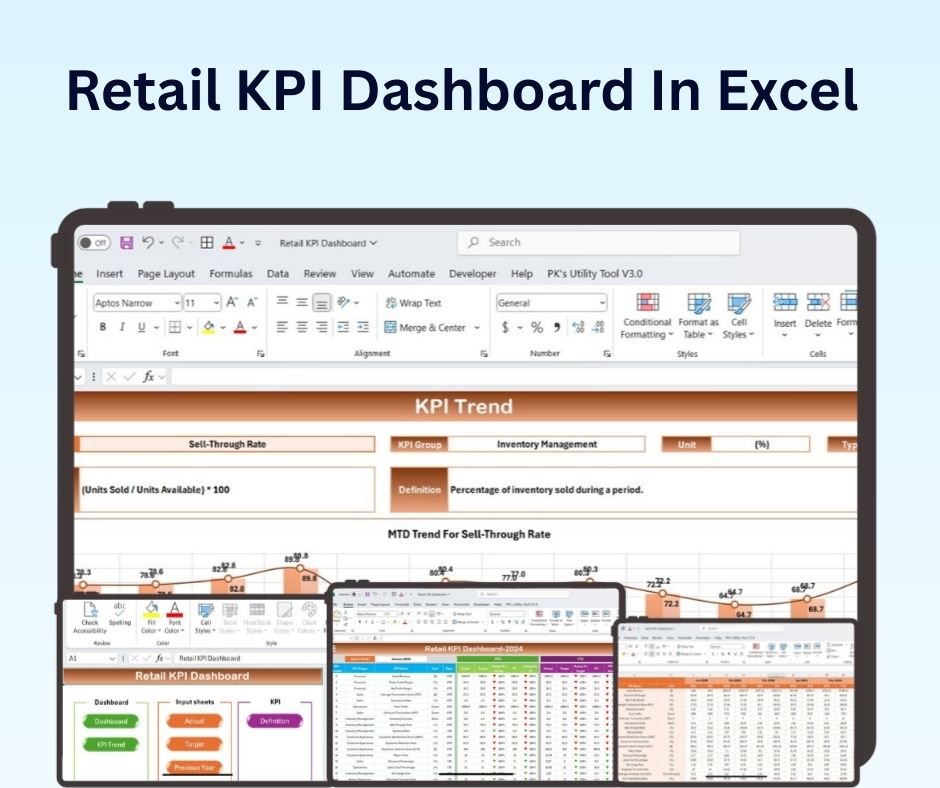
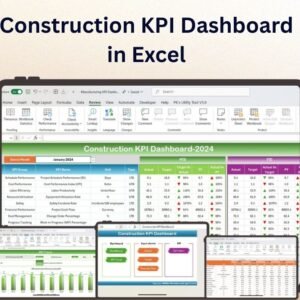
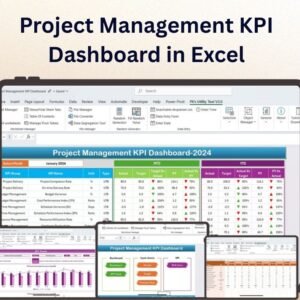
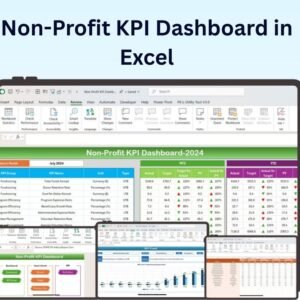
The Retail KPI Dashboard in Excel is a comprehensive and user-friendly tool designed to help retail businesses track and monitor their key performance indicators (KPIs). Whether you’re managing a small retail store or overseeing a large retail chain, this Excel-based dashboard allows you to visualize essential metrics such as sales performance, inventory turnover, customer satisfaction, and employee productivity.
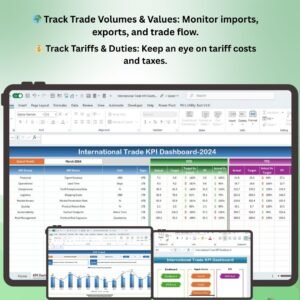
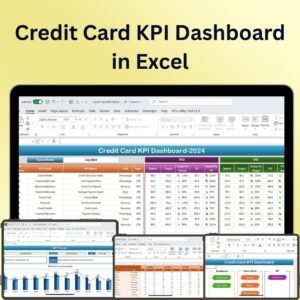
With real-time updates and customizable features, this dashboard helps retail managers, business owners, and analysts make data-driven decisions to improve store operations, optimize inventory levels, and enhance customer experiences. The dashboard is equipped with visual charts and graphs, making it easy to interpret complex data and identify trends, opportunities, and areas for improvement in retail performance.

Key Features of the Retail KPI Dashboard in Excel:
📊 Comprehensive Retail KPI Tracking
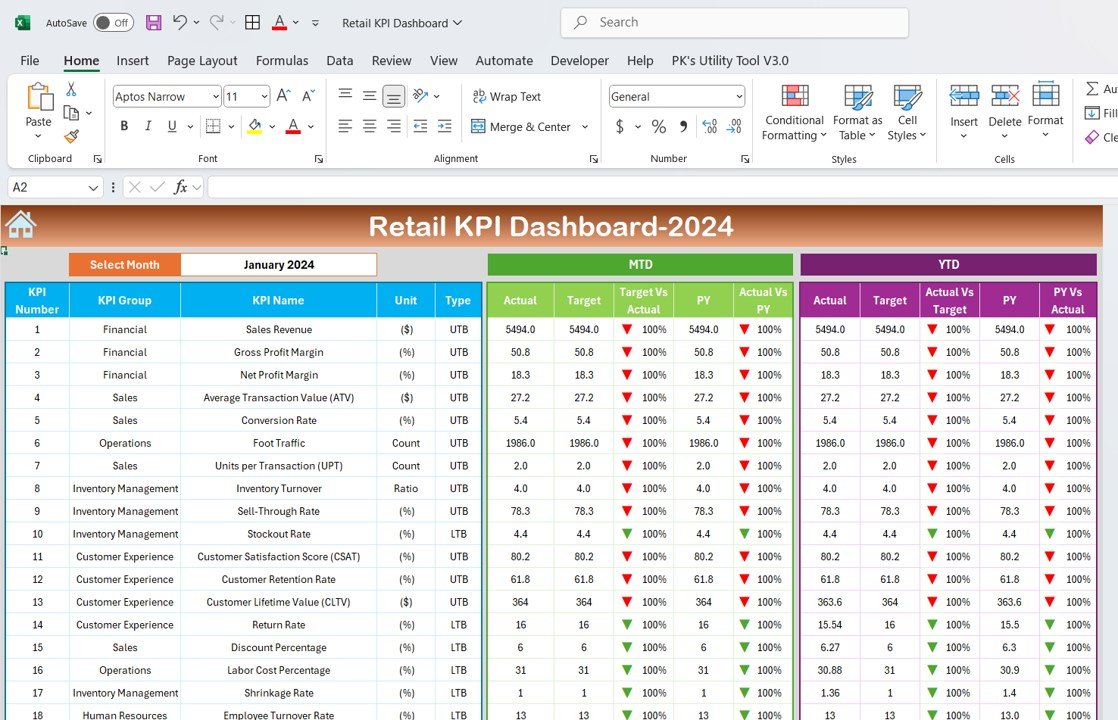
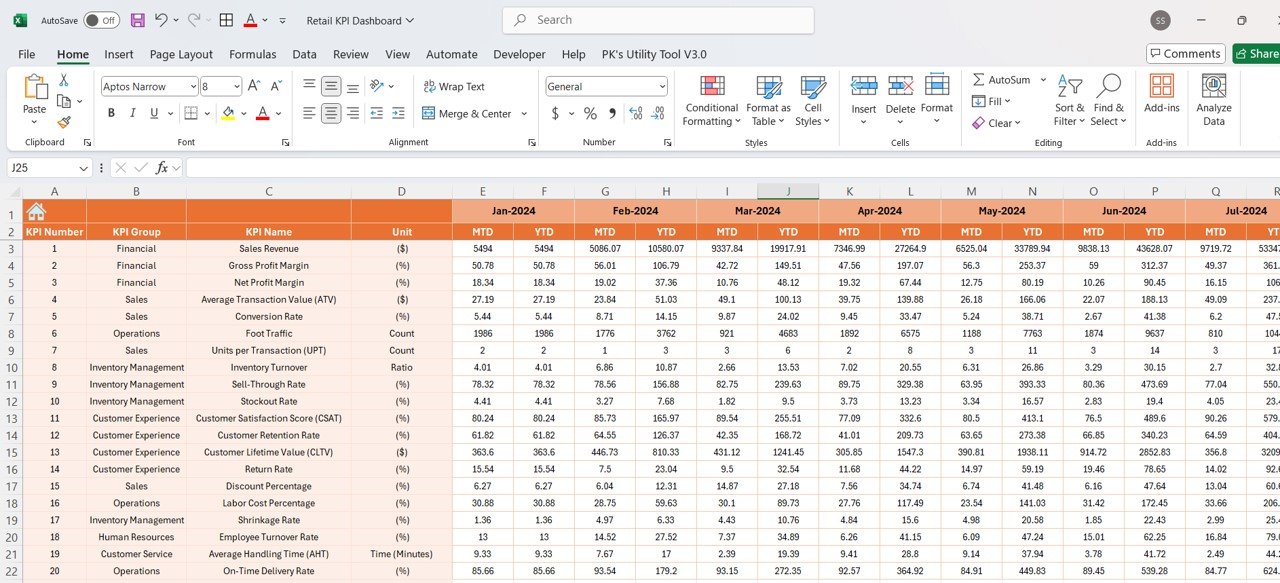
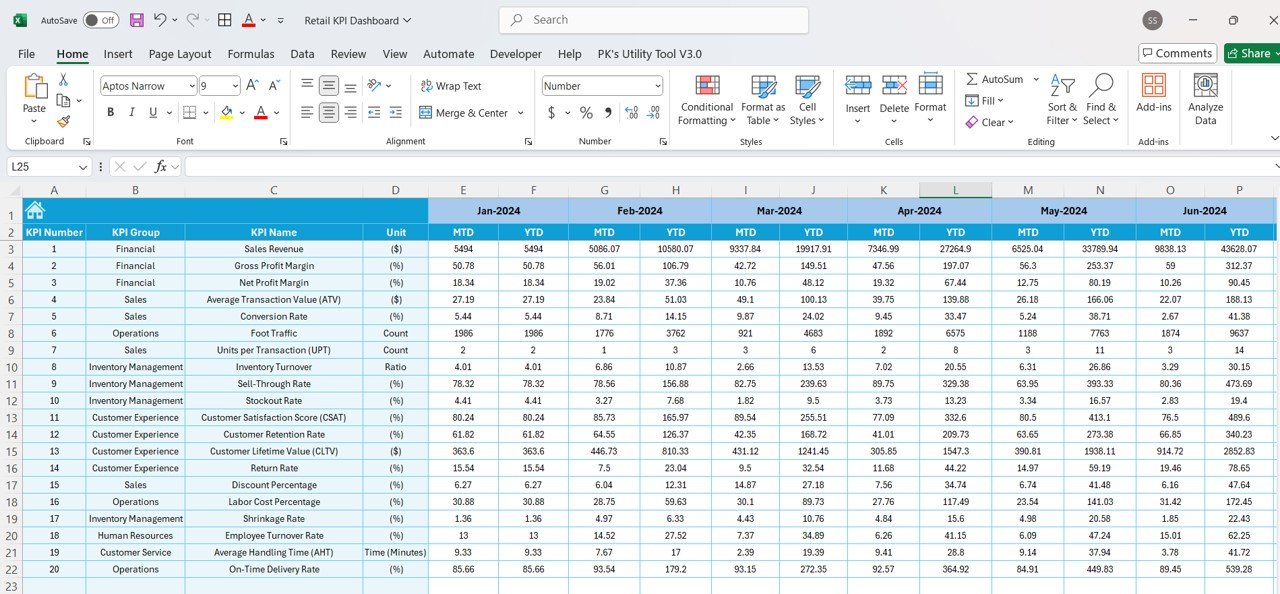
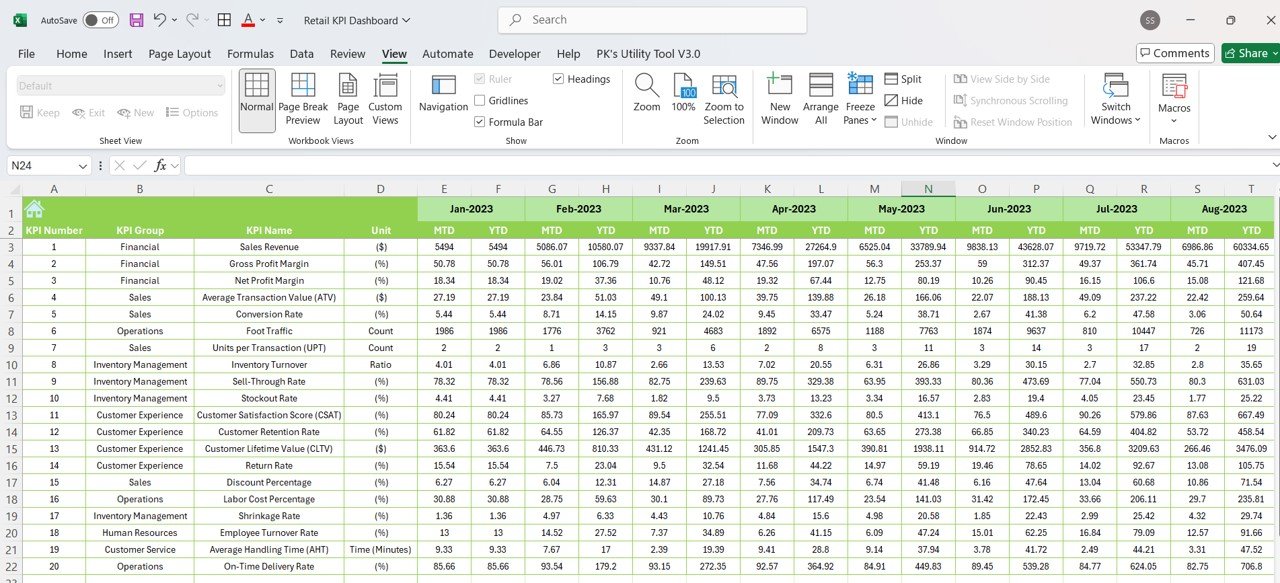
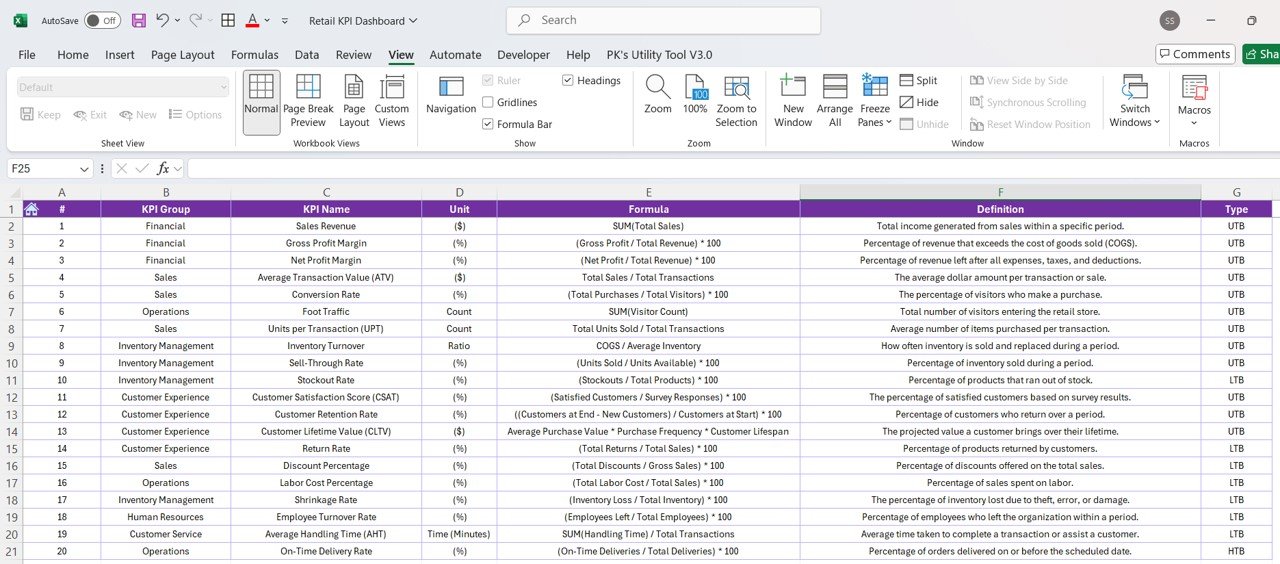
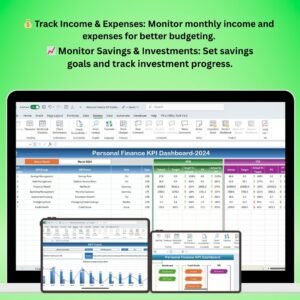
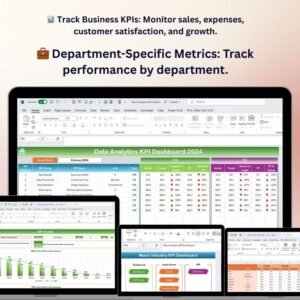
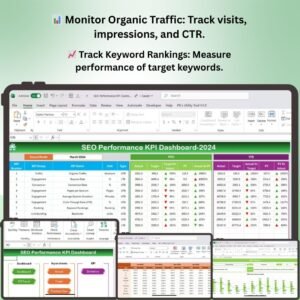
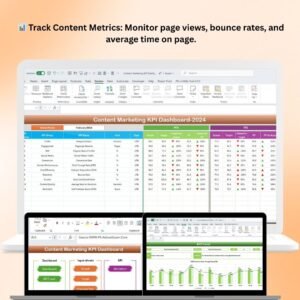
Track essential retail KPIs such as total sales, sales per square foot, inventory turnover, conversion rates, customer satisfaction, and employee performance.
📈 Real-Time Data Updates
Automatically update the dashboard as you enter new sales, inventory, and performance data, ensuring that you always have up-to-date insights.
📉 Sales and Inventory Monitoring
Keep a close eye on inventory levels, sales performance, and inventory turnover, helping you optimize stock levels and prevent overstocking or stockouts.
🛍️ Customer Satisfaction Tracking
Monitor customer satisfaction, feedback, and reviews to ensure that you’re meeting customer expectations and improving the customer experience.
🎨 Customizable Layout
Easily customize the dashboard to track the KPIs most relevant to your business, adjust data inputs, and modify the visual design to fit your store’s branding.
Why You’ll Love the Retail KPI Dashboard in Excel:
✅ Centralized Performance Monitoring – Track all key retail metrics in one place, making it easier to monitor sales, inventory, and customer satisfaction. ✅ Real-Time Monitoring – Stay informed with automatic data updates, ensuring that your insights are always up-to-date and accurate. ✅ Customizable for Your Business – Tailor the dashboard to reflect your specific KPIs, sales goals, and operational needs. ✅ Clear Visual Insights – Use intuitive charts, graphs, and progress indicators to easily analyze trends and identify areas for improvement. ✅ User-Friendly Design – The simple, clean layout ensures that anyone can use the dashboard, regardless of their Excel proficiency.
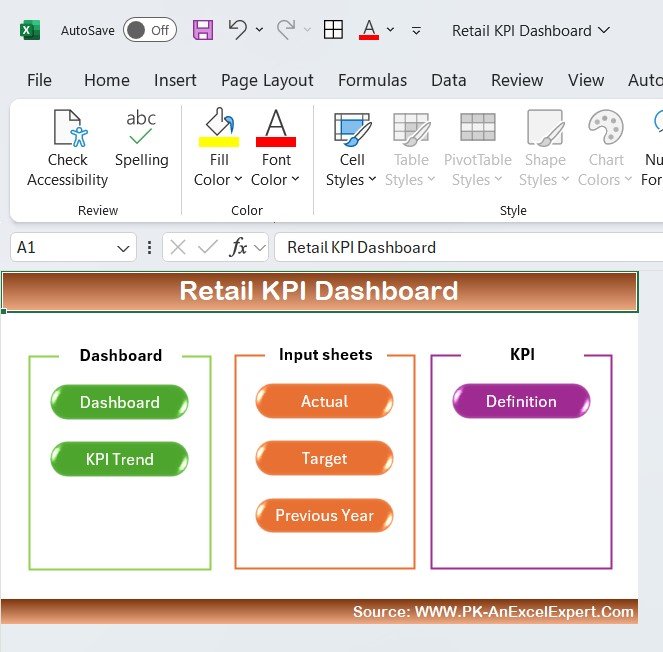
What’s Inside the Retail KPI Dashboard in Excel:
- Retail KPIs – Track important metrics such as total sales, sales per square foot, customer satisfaction, and employee performance.
- Sales and Inventory Monitoring – Keep track of sales performance, inventory turnover, and stock levels.
- Real-Time Updates – The dashboard updates as you input new data, ensuring that the insights are always current.
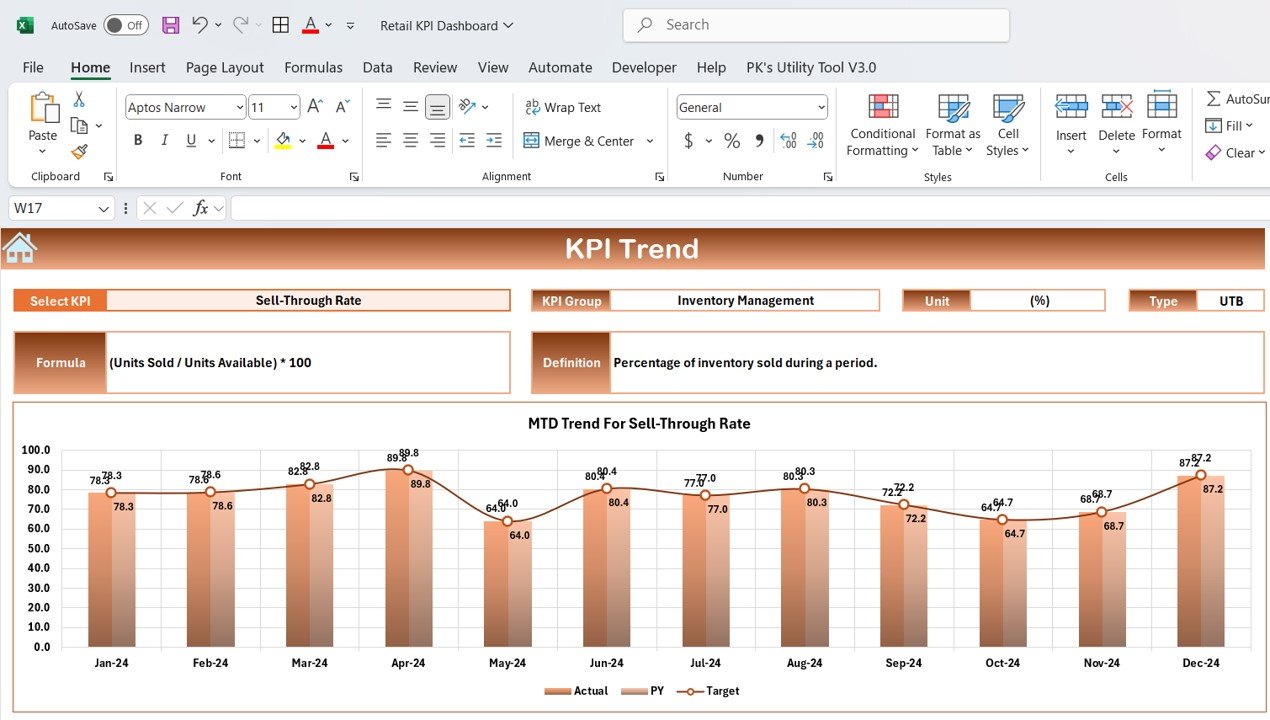
- Customizable Charts and Graphs – Use dynamic graphs, bar charts, and pie charts to visualize sales, inventory, and customer satisfaction data.
- Customer Satisfaction Tracking – Monitor customer feedback, reviews, and satisfaction to improve service and operations.
How to Use the Retail KPI Dashboard in Excel:
1️⃣ Download the Template – Get immediate access to the Excel file after purchase. 2️⃣ Input Your Retail Data – Enter sales, inventory, and customer satisfaction data into the provided fields. 3️⃣ Customize the Dashboard – Adjust the KPIs, layout, and design to match your retail business’s specific needs and goals. 4️⃣ Track Performance – Use the dashboard to monitor the performance of your retail business in real-time, including sales, inventory, and customer satisfaction. 5️⃣ Make Informed Decisions – Leverage the insights to optimize inventory, increase sales, improve customer service, and enhance employee productivity.
Who Can Benefit from the Retail KPI Dashboard in Excel:
- Retail Business Owners
- Retail Managers
- Inventory Managers
- Sales Teams
- Customer Service Teams
- Retail Analysts
- Anyone looking to track and improve retail performance
The Retail KPI Dashboard in Excel is the perfect tool for retail businesses that want to track their performance, optimize sales strategies, and improve operational efficiency. With its user-friendly design, real-time updates, and customizable features, this dashboard gives you everything you need to stay on top of your retail operations.
Click here to read the Detailed blog post
https://www.pk-anexcelexpert.com/retail-kpi-dashboard-in-excel/


Reviews
There are no reviews yet.