


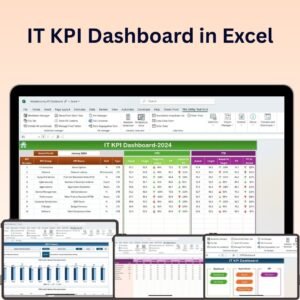
The IT KPI Dashboard in Excel is a comprehensive tool designed to help IT teams and managers track, monitor, and analyze their key performance indicators (KPIs) in real-time. This Excel-based dashboard provides a centralized view of various IT metrics, such as system uptime, network performance, incident response times, and service desk efficiency. With customizable features and easy-to-read visualizations, this dashboard helps IT professionals stay on top of their operations and ensure that their IT infrastructure is performing optimally.
The dashboard is designed to give you actionable insights into your IT operations, helping you track progress, identify trends, and make data-driven decisions. Whether you’re monitoring network performance, managing incidents, or analyzing service desk data, this tool allows you to streamline IT management and improve the overall efficiency of your team. It’s ideal for IT managers, system administrators, and anyone responsible for overseeing IT services and performance.

Key Features of the IT KPI Dashboard in Excel:
📊 Comprehensive KPI Tracking
Monitor critical IT KPIs, such as system uptime, incident response time, network performance, and service desk metrics, all in one place.
📉 Real-Time Data Updates
As you input new data, the dashboard automatically updates to give you the most current performance insights.
🖥️ Customizable Metrics
Easily tailor the dashboard to reflect the specific IT KPIs that matter most to your organization, allowing for flexible and relevant reporting.
📈 Visual Performance Tracking
Utilize dynamic graphs, charts, and visual indicators to easily track and communicate performance, identify trends, and pinpoint areas for improvement.
🎯 Goal Setting and Monitoring
Set performance goals for each KPI and track progress towards achieving them to ensure optimal IT operations.
Why You’ll Love the IT KPI Dashboard in Excel:
✅ Comprehensive IT Monitoring – Track and manage a wide range of IT metrics from one central location, making it easier to monitor system performance. ✅ Real-Time Tracking – Stay informed with automatic data updates, giving you up-to-the-minute insights into your IT performance. ✅ Customizable and Flexible – Customize the dashboard to fit your specific IT needs, whether you’re monitoring server uptime or incident resolution times. ✅ Data-Driven Decisions – Use the visual data and insights from the dashboard to guide IT strategies, improve processes, and optimize your infrastructure. ✅ Easy Setup – The user-friendly design makes it simple to input data and generate visual reports, even without advanced Excel skills.
What’s Inside the IT KPI Dashboard in Excel:
- Comprehensive IT Metrics – Track performance in areas such as server uptime, network performance, incident response, and more.
- Customizable Input – Easily adjust the dashboard to track the most relevant KPIs for your IT operations.
- Visual Data Insights – Present your data in easy-to-understand graphs, charts, and progress indicators.
- Real-Time Updates – Ensure that your dashboard is always current with the most recent data input.
- Goal Tracking – Set and track progress towards performance goals to improve IT operations.
How to Use the IT KPI Dashboard in Excel:
1️⃣ Download the Template – Access the Excel dashboard file after purchase. 2️⃣ Input Your Data – Enter the necessary data, such as incident response times, uptime, and service desk performance. 3️⃣ Customize the Dashboard – Tailor the metrics and visualizations to your organization’s specific IT KPIs. 4️⃣ Monitor and Track – Use the dashboard to keep track of key IT performance metrics and monitor progress in real time. 5️⃣ Make Data-Driven Decisions – Use the insights from the dashboard to inform your IT strategies and make operational improvements.
Who Can Benefit from the IT KPI Dashboard in Excel:
- IT Managers
- System Administrators
- Network Engineers
- IT Support Teams
- IT Directors
- Anyone responsible for monitoring and improving IT performance
The IT KPI Dashboard in Excel is an essential tool for IT teams and managers looking to streamline performance tracking and optimize their infrastructure. With its customizable features and real-time data updates, it provides everything you need to ensure your IT operations are running smoothly and efficiently.
Click here to read the Detailed blog post
https://www.pk-anexcelexpert.com/it-kpi-dashboard-in-excel/


Reviews
There are no reviews yet.