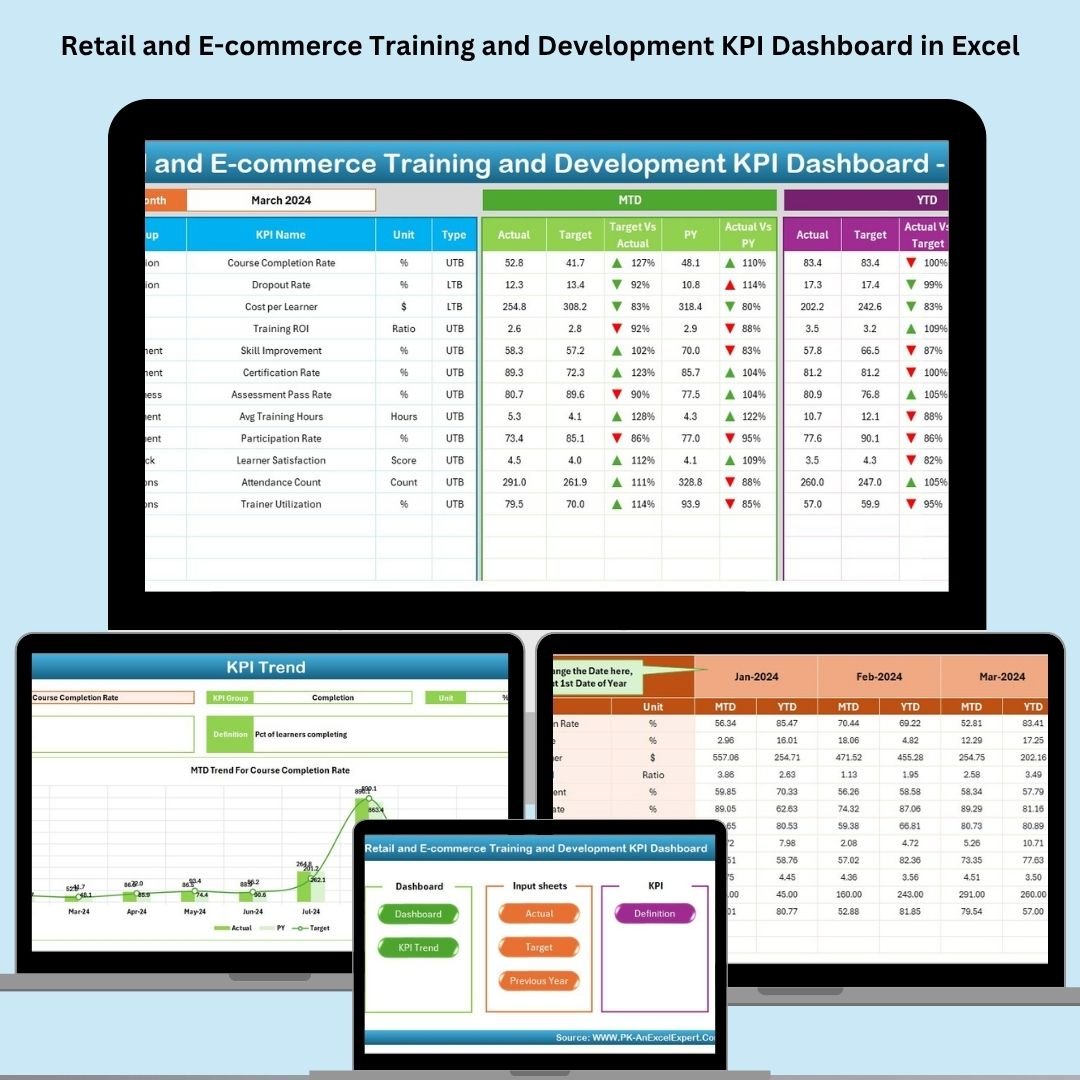
In the fast-paced world of retail and e-commerce, great training fuels great performance. But how do you know your training is working? That’s where the Retail and E-commerce Training and Development KPI Dashboard in Excel comes in—a powerful, plug-and-play Excel template that lets you track, measure, and improve every aspect of your employee training initiatives.
Designed for HR managers, trainers, and operations leaders, this dashboard gives you complete visibility into training KPIs—from completion rates to certification metrics—all with the click of a button. No more scattered spreadsheets, outdated charts, or guesswork. Just clear, actionable insights to drive your team forward.
🔑 Key Features of Retail and E-commerce Training and Development KPI Dashboard
🧭 Home Sheet with Navigation Buttons
Jump to any sheet instantly using six intuitive navigation buttons—no scrolling or searching required.
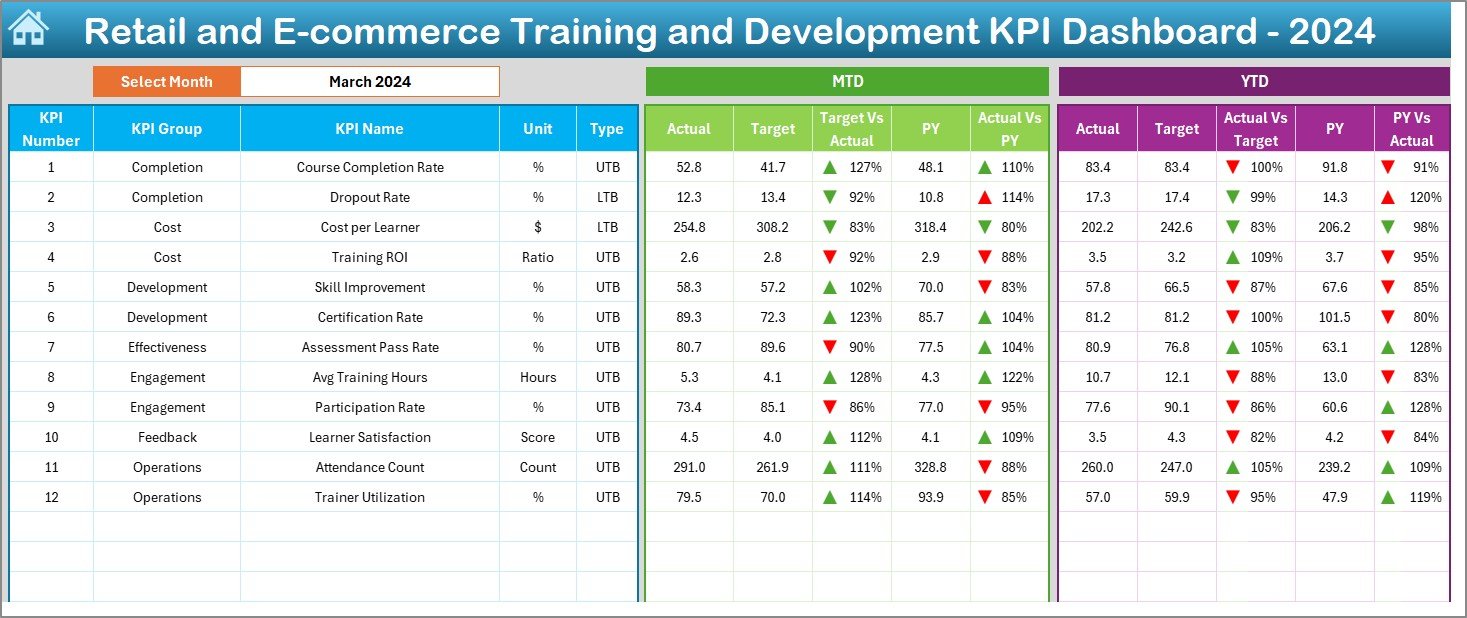
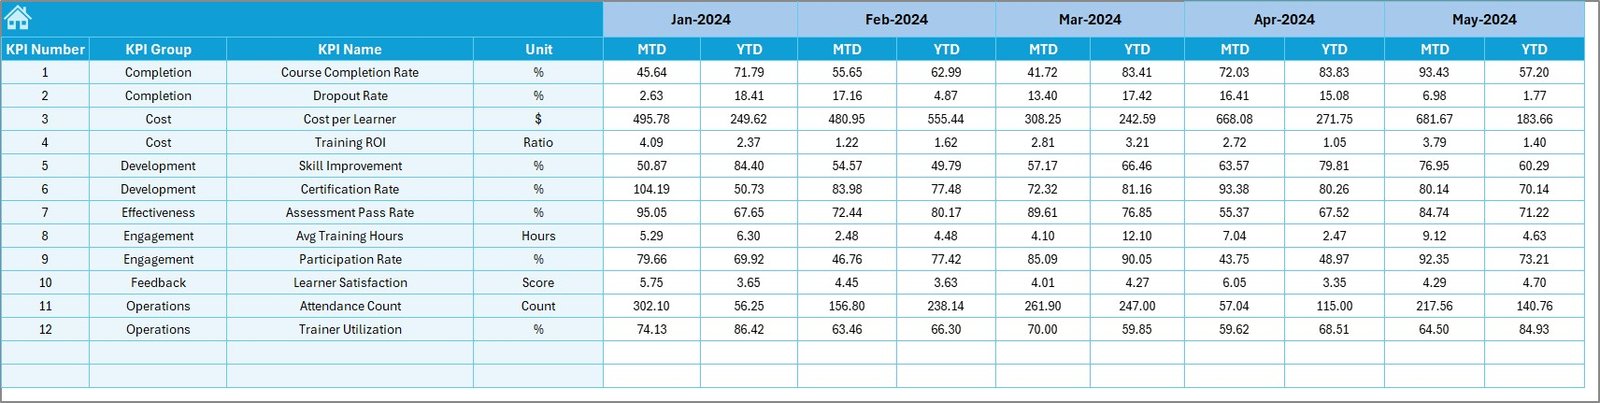
📊 Dynamic Dashboard Sheet
Change the month in one dropdown (cell D3) and instantly see:
-
MTD/YTD Actuals
-
Targets
-
Previous Year comparisons
With automatic conditional formatting to show performance with up/down arrows.
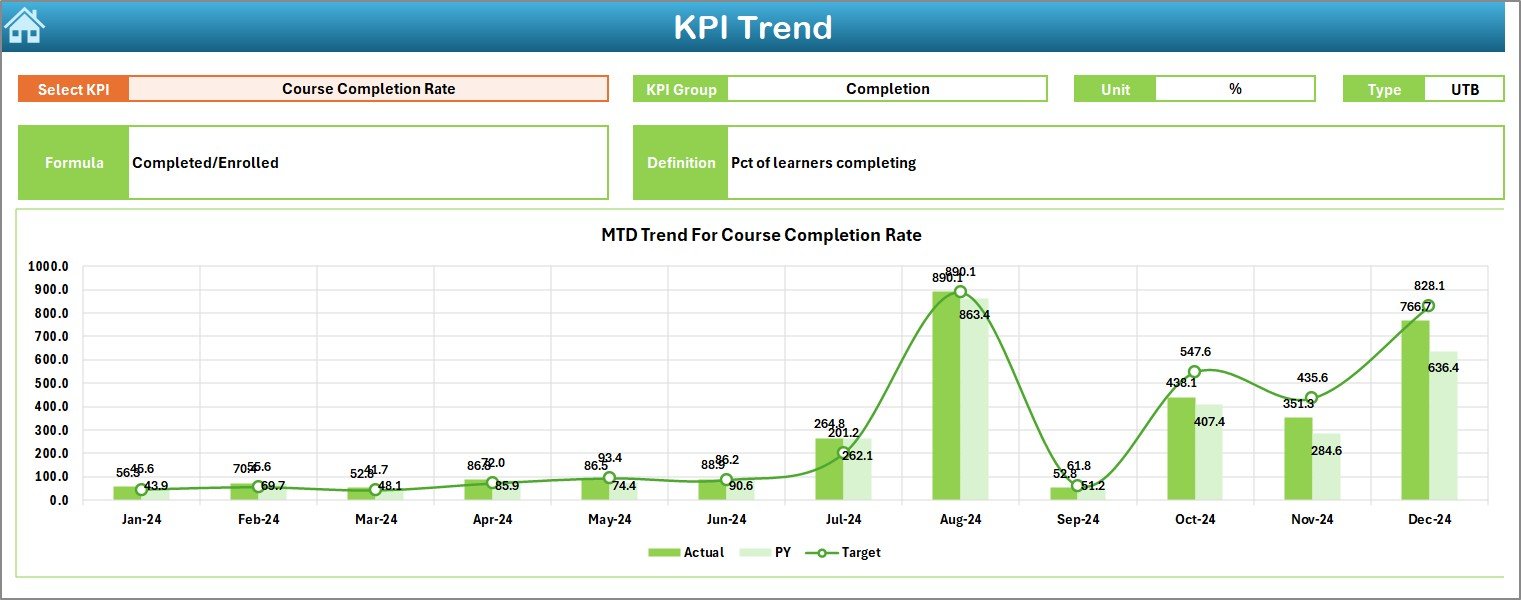
📈 KPI Trend Sheet
Track trends for any KPI:
-
Choose from a dropdown list
-
See MTD and YTD charts auto-update
-
View KPI definitions, units, and formulas in one place
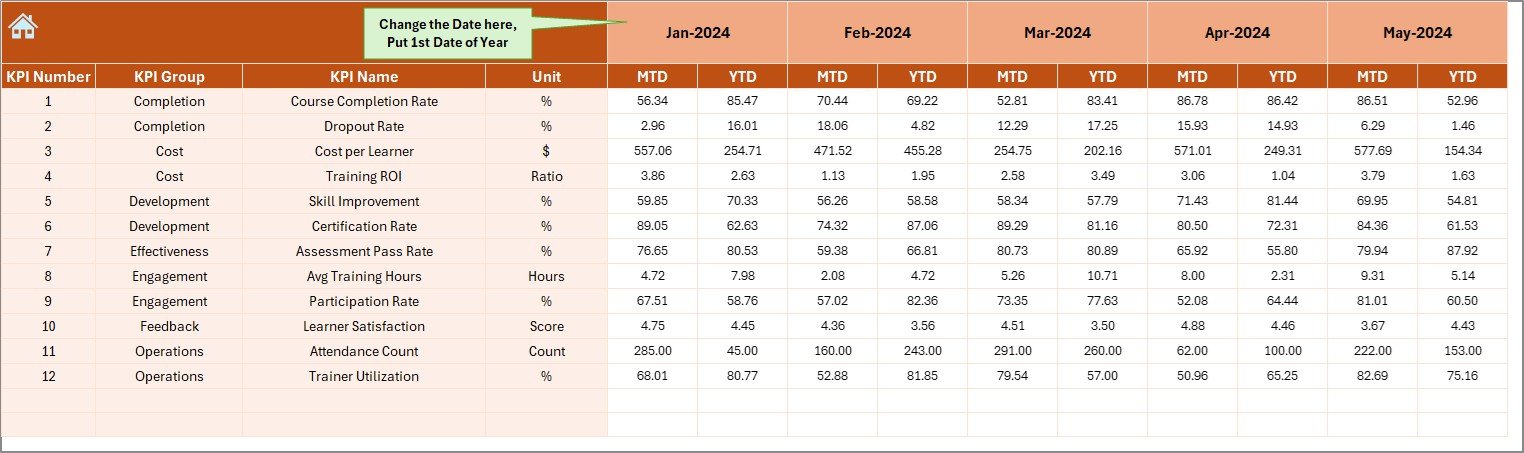
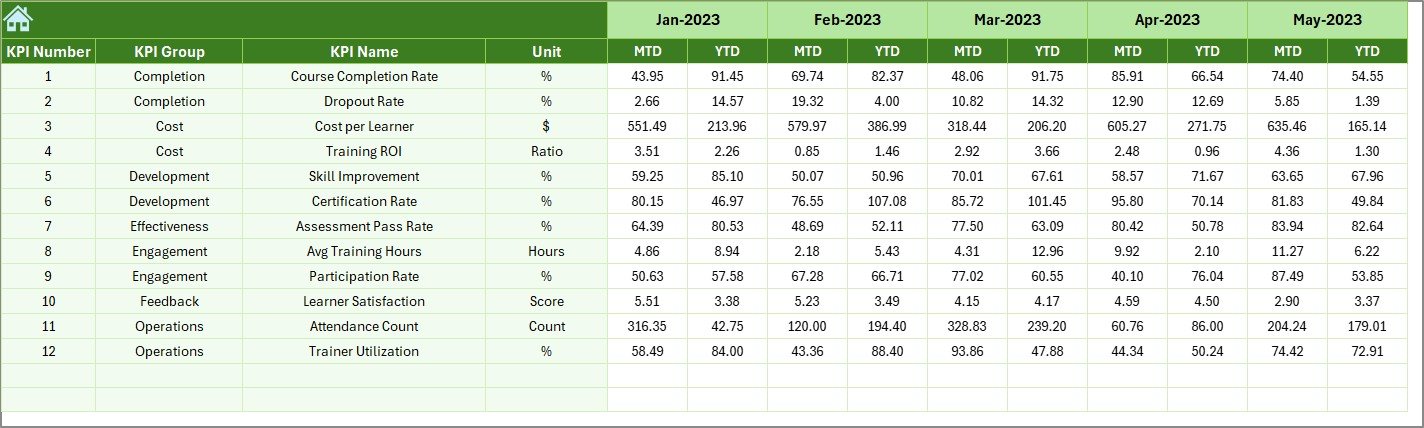
📝 Input Sheets: Actuals, Targets, PY Data
Separate sheets for:
-
Monthly Actuals
-
Targets
-
Previous Year data
Everything rolls up automatically into the dashboard.
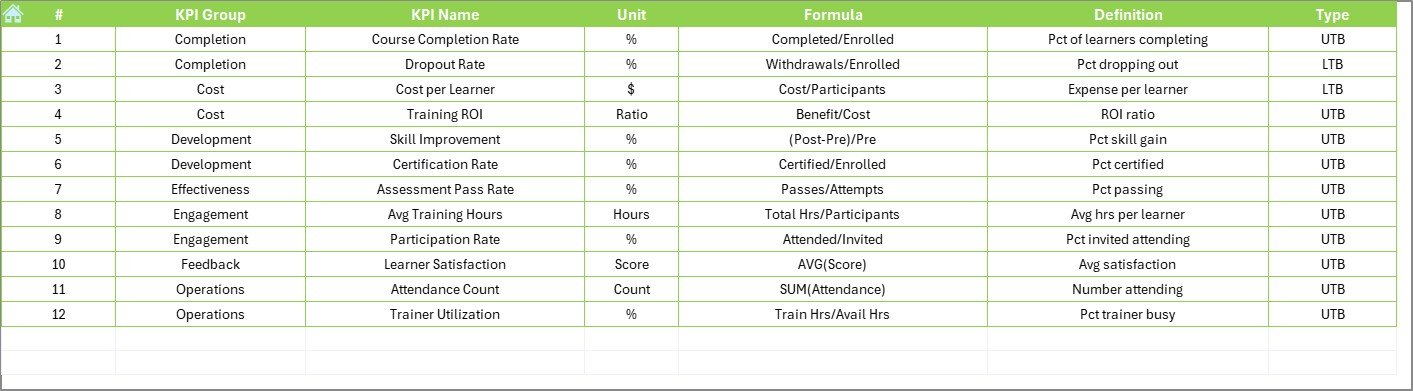
📚 KPI Definition Sheet
Document KPI Name, Group, Unit, Formula, and a brief definition—ensuring team-wide clarity.
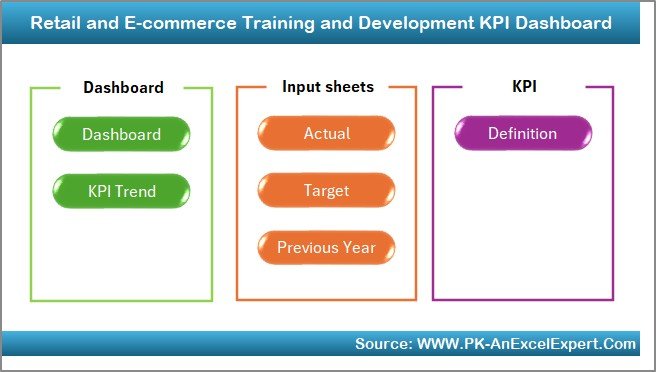
📦 What’s Inside the Dashboard?
This Excel file includes 7 fully formatted worksheets:
-
Home Sheet – Easy navigation to all parts of the dashboard
-
Dashboard Sheet – MTD and YTD visuals with variance arrows
-
KPI Trend Sheet – View monthly trends for each KPI
-
Actual Numbers Input Sheet – Enter monthly actual performance
-
Target Sheet – Set monthly and YTD training goals
-
Previous Year Numbers Sheet – Enter last year’s values for comparison
-
KPI Definition Sheet – Central reference for all KPI logic
No macros or advanced add-ins needed—just smart use of Excel’s native features.
🧩 How to Use the Dashboard
✅ Step 1: In the Actual Input Sheet, define your fiscal year starting month in cell E1
✅ Step 2: Fill in MTD/YTD actual values monthly
✅ Step 3: Enter training targets in the Target Sheet
✅ Step 4: Populate previous year’s numbers
✅ Step 5: Go to the Dashboard and select a month
✅ Step 6: Use arrows and charts to identify gaps, wins, and opportunities
✅ Step 7: Review KPI Trend Sheet for in-depth progress tracking
Perfect for monthly reporting and quarterly performance reviews!
👤 Who Can Benefit from This Dashboard?
🧠 L&D Teams – Monitor training effectiveness with KPI-driven insights
📦 Retail Managers – Track frontline onboarding, skills development & more
👨🏫 Corporate Trainers – Analyze certification & course completion trends
🧮 HR Professionals – Link training investment to business outcomes
🧾 E-commerce Operations – Ensure customer service teams are upskilled in real-time
📈 Executives – Make better decisions with data-backed dashboards
If you track training KPIs—this Excel tool is built for you!
🔗 Click here to read the Detailed blog post
🔗 Visit our YouTube channel to learn step-by-step video tutorials


Reviews
There are no reviews yet.