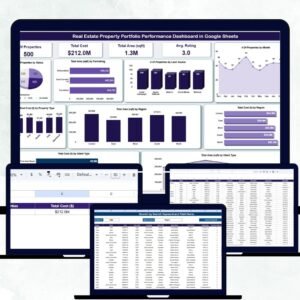
Managing multiple real estate properties can be complex — balancing investment costs, occupancy, and client relations requires clarity and control. The Real Estate Property Portfolio Performance Dashboard in Google Sheets is a ready-to-use, automated solution designed for real estate investors, property managers, and brokers to track portfolio performance, analyze costs, and optimize asset utilization.
This smart, visual, and data-driven tool transforms raw property data into actionable insights, giving you a complete overview of your portfolio’s financial and operational health — all within the convenience of Google Sheets.
Whether you manage residential apartments, commercial buildings, or mixed-use developments, this dashboard helps you make informed, data-backed decisions to maximize ROI.
🔑 Key Features of the Real Estate Property Portfolio Performance Dashboard in Google Sheets
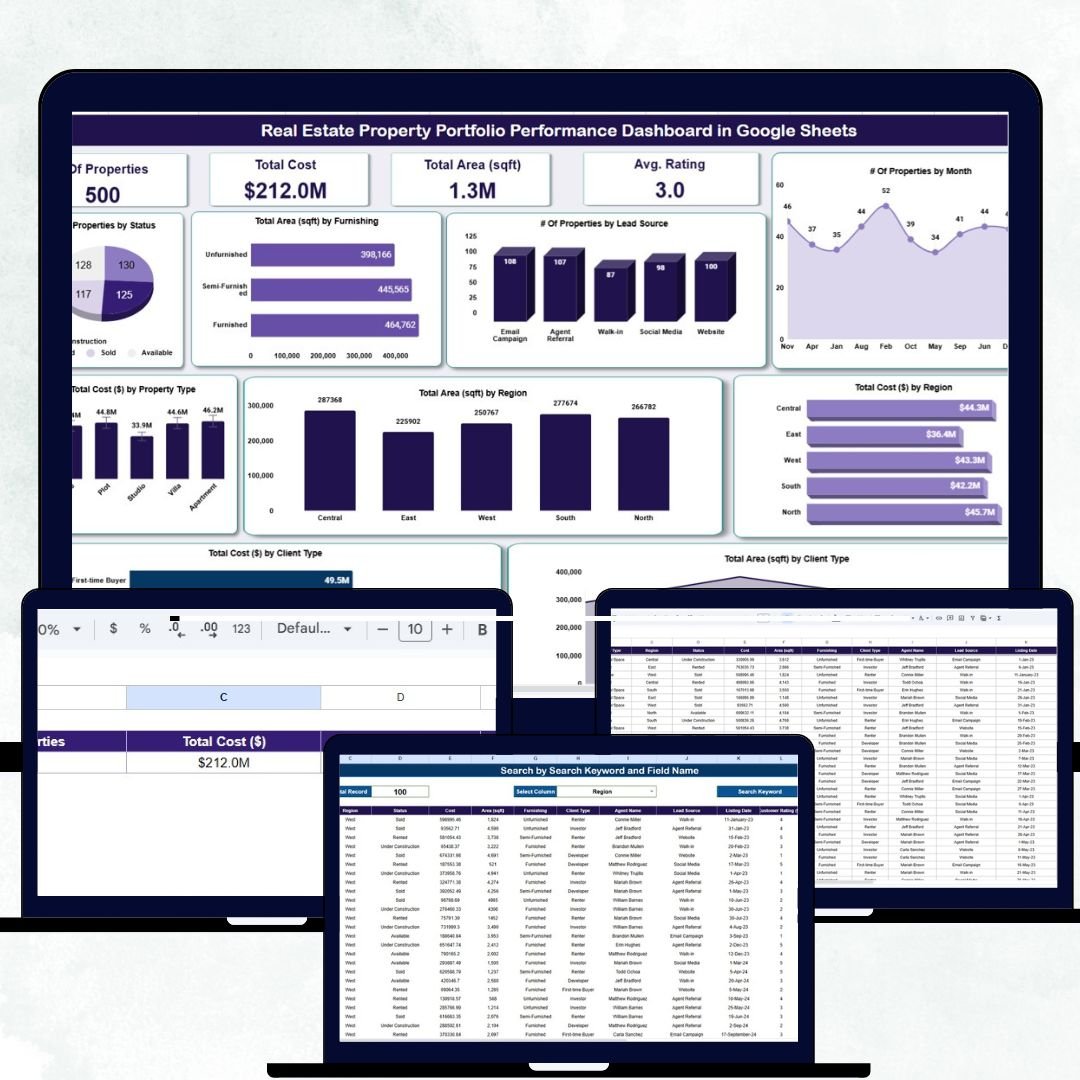
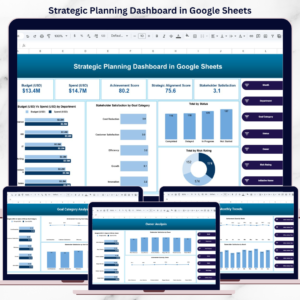
📋 Dashboard Sheet Tab (Main Analytics Page)
Your central hub for visualizing the complete portfolio at a glance.
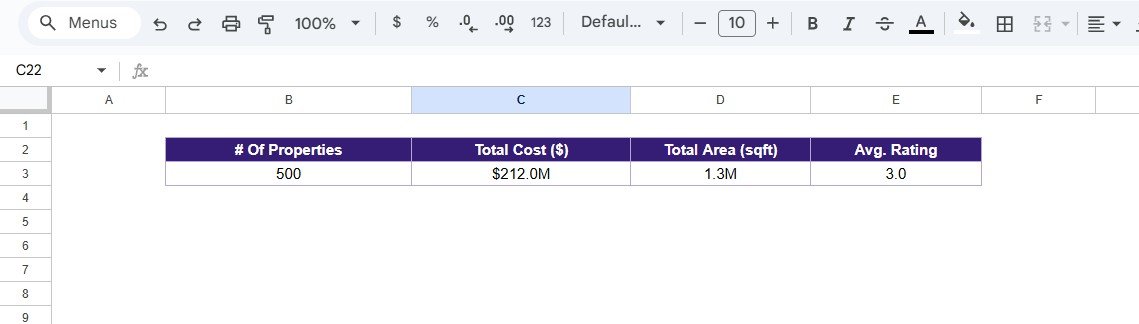
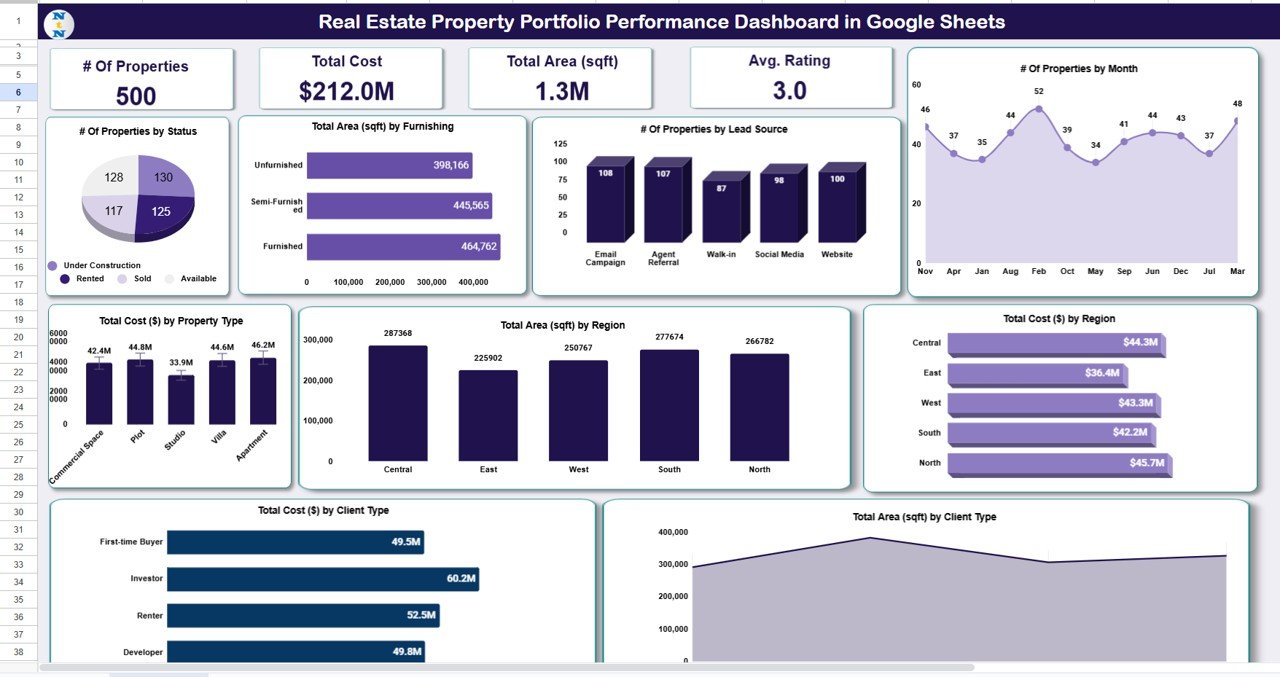
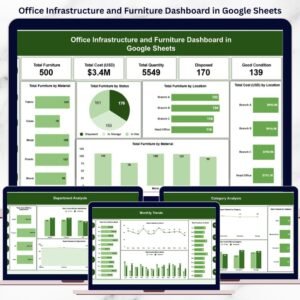
KPI Cards:
🏘 # of Properties: Displays the total number of properties in your portfolio.
💰 Total Cost ($): Aggregates the total purchase or construction cost.
📏 Total Area (sqft): Shows the cumulative built-up or usable area.
⭐ Average Rating: Reflects overall satisfaction or performance ratings.
Charts Included:
📊 # of Properties by Status: Categorizes properties as Available, Sold, Leased, or Under Construction.
🏢 Total Area (sqft) by Furnishing: Compares area across Furnished, Semi-Furnished, and Unfurnished units.
👥 # of Properties by Lead Source: Tracks where inquiries come from (e.g., Ads, Agents, Referrals).
📆 # of Properties by Month: Visualizes new acquisitions or deals monthly.
🌍 Total Cost ($) by Region: Identifies regions with high investment concentration.
📈 Total Area (sqft) by Region: Compares regional property footprints.
🏠 Total Cost ($) by Property Type: Breaks down spending across Apartments, Villas, Offices, or Retail Units.
🤝 Total Cost ($) by Client Type: Analyzes cost contribution from Individuals, Corporates, and Investors.
📐 Total Area (sqft) by Client Type: Displays client group-wise property occupancy.
All charts auto-refresh when data is entered or modified in the Data Sheet — ensuring real-time visibility.
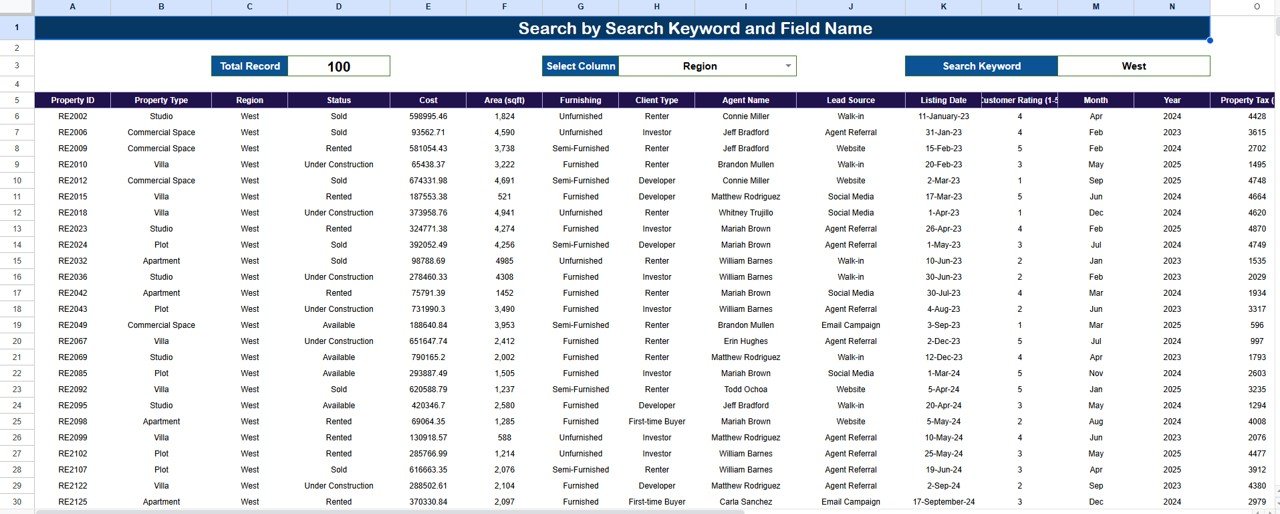
🔍 Search Sheet Tab (Smart Lookup Page)
Easily find any property or client record using the built-in search feature.
How It Works:
-
Search by Keyword: e.g., “Villa” or “Downtown” to locate related entries.
-
Search by Field Name: e.g., “Status,” “Region,” or “Client Type” for targeted results.
Examples: -
Searching “Corporate” filters all corporate-owned properties.
-
Searching “Leased” shows all active leased properties.
Perfect for quick analysis, audits, and client reporting.
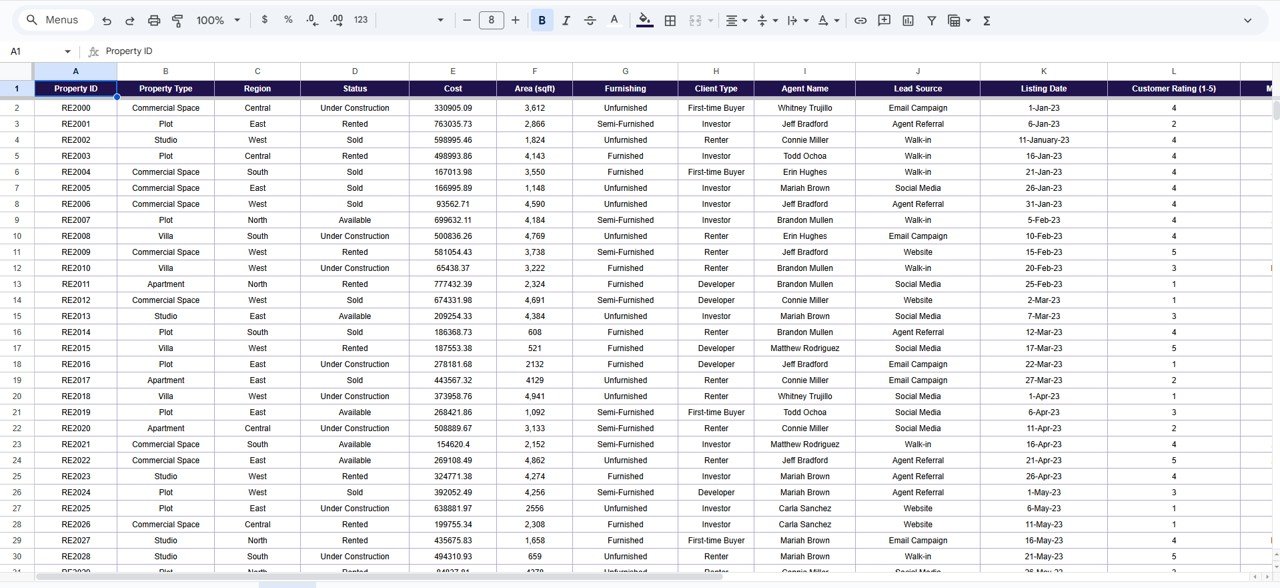
📊 Data Sheet Tab (Database)
The foundation of your dashboard — stores all property records in a structured format.
Includes columns for:
-
Property Name / ID
-
Region
-
Property Type
-
Status
-
Client Type
-
Lead Source
-
Total Area (sqft)
-
Cost ($)
-
Rating / Feedback
This structured setup feeds all charts and KPIs seamlessly.
⚙️ Support Sheet Tab
Contains dropdown lists, formulas, and data validation settings that power automation and maintain consistency.
📦 What’s Inside the Dashboard
✅ Fully functional Google Sheets dashboard file
✅ 10+ auto-updating charts and KPI cards
✅ Smart search tab for instant lookups
✅ Editable data and dropdown fields
✅ Real-time collaboration for multiple users
✅ 100% customizable for any real estate business
✅ Plug-and-play — no coding or add-ons required
🧑💼 Who Can Benefit from This Dashboard
🏘 Real Estate Agents – Track property listings and client activity.
🏢 Property Managers – Manage leasing, maintenance, and costs efficiently.
💰 Investors & Developers – Monitor capital distribution and project progress.
📊 Financial Teams – Evaluate property profitability and performance metrics.
🌍 Brokerage Firms – Centralize all property and client data for portfolio insights.
It’s the perfect all-in-one tool for anyone managing multiple properties across different locations.
🧪 How to Use the Real Estate Property Portfolio Performance Dashboard
1️⃣ Enter property details into the Data Sheet.
2️⃣ Watch all KPIs and charts auto-update in real time.
3️⃣ Use filters or the Search Tab to find specific data points.
4️⃣ Review portfolio performance by region, client type, or property status.
5️⃣ Update records monthly for consistent trend analysis.
💡 Pro Tip: Add your sales or rental data to create a full Profit vs. Cost performance view.
🌟 Why Choose This Dashboard
-
🏡 Complete visibility into property portfolio performance
-
📈 Smart automation with dynamic charts and analytics
-
👥 Team collaboration via Google Sheets
-
⚙️ Fully editable for different property types
-
🚀 Ready to use — no complex setup required
The Real Estate Property Portfolio Performance Dashboard in Google Sheets turns property data into business intelligence — helping you save time, make smarter decisions, and drive long-term profitability. 🌟
🔗 Click here to read the Detailed blog post
Watch the step-by-step video Demo:


Reviews
There are no reviews yet.