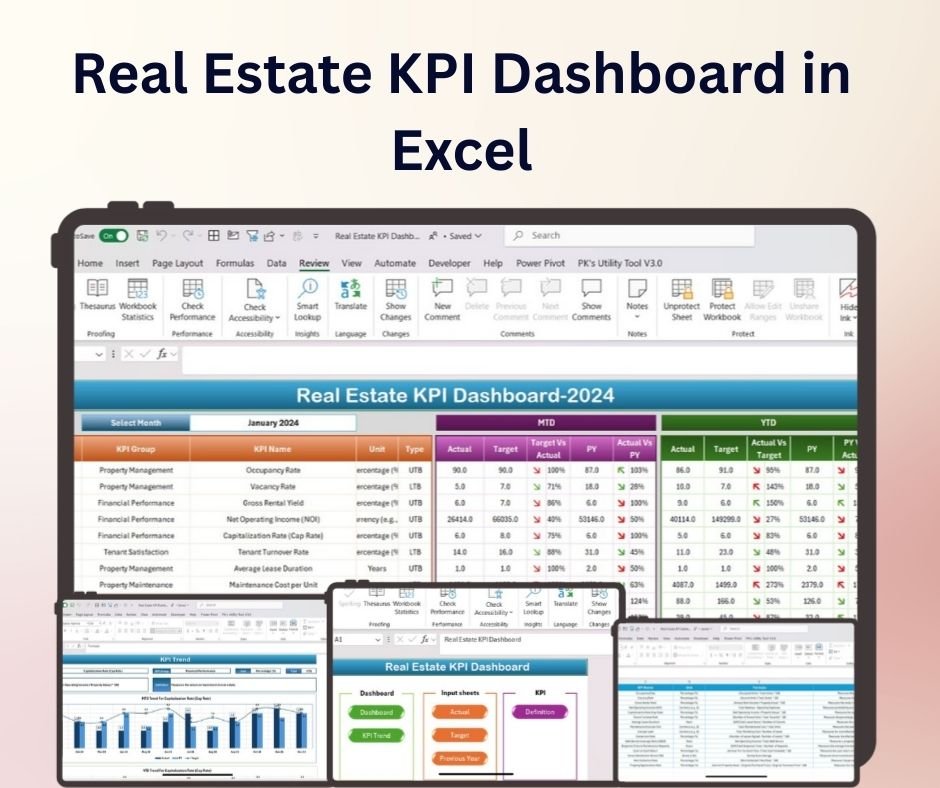

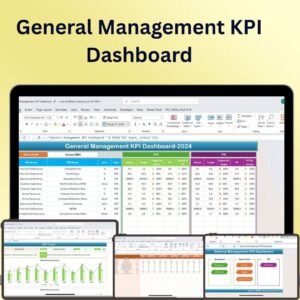
The Real Estate KPI Dashboard in Excel is an essential tool designed for real estate professionals, property managers, and investors to track, analyze, and monitor key performance indicators (KPIs) related to their properties, sales, and investments. This Excel-based dashboard provides a comprehensive view of vital real estate metrics such as property performance, occupancy rates, sales revenue, market trends, and more.
With easy-to-read graphs, charts, and real-time data updates, this dashboard helps users stay on top of market performance, track rental income, monitor sales, and optimize investment strategies. Whether you’re managing a single property, a real estate portfolio, or an entire agency, this dashboard offers actionable insights to help you make informed decisions and drive profitability. Customizable to suit your specific goals, the Real Estate KPI Dashboard offers a detailed overview of all the important aspects of real estate performance.

Key Features of the Real Estate KPI Dashboard in Excel:
🏠 Comprehensive KPI Tracking
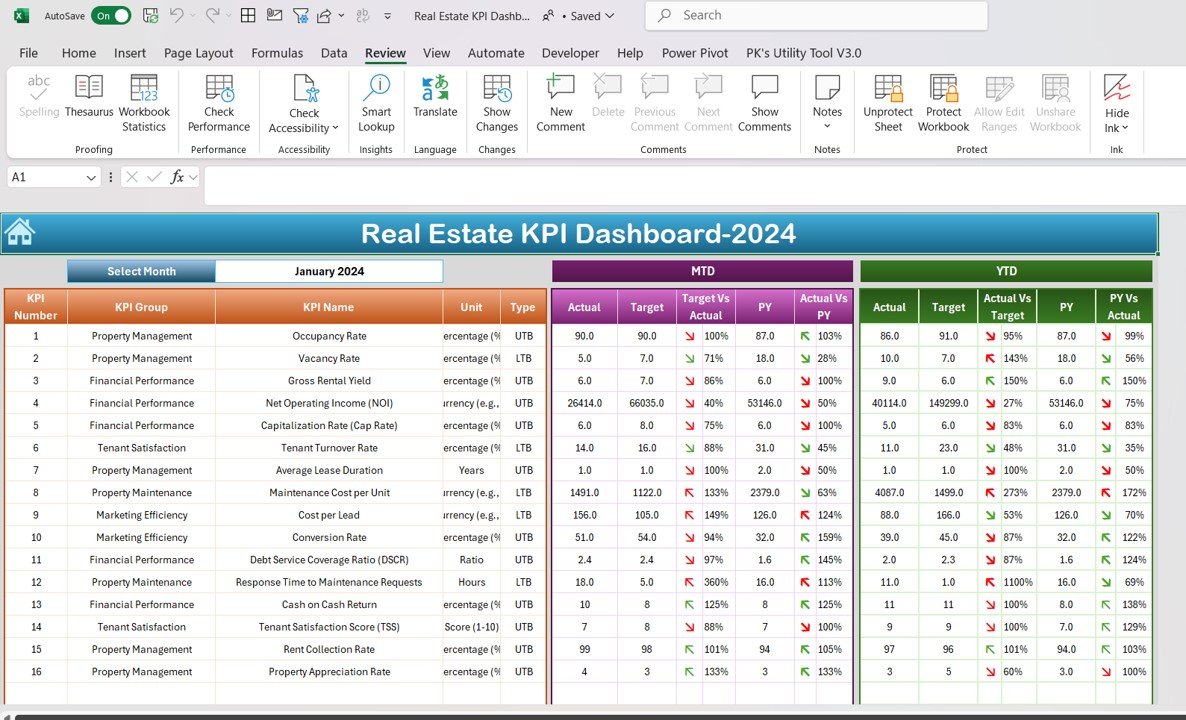
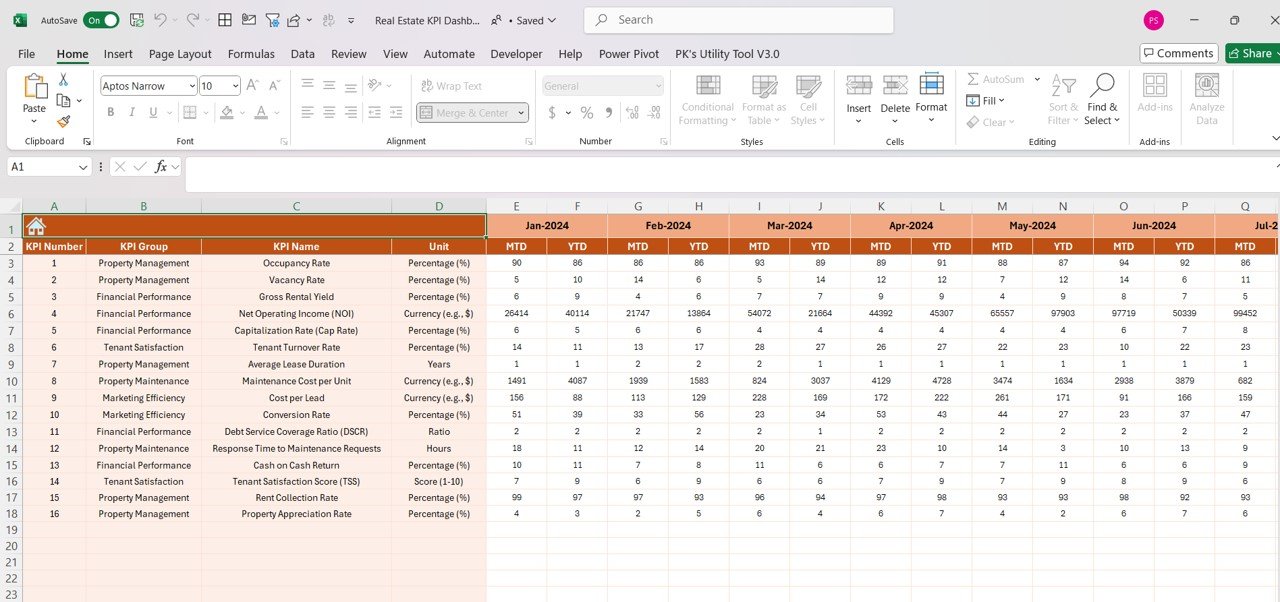
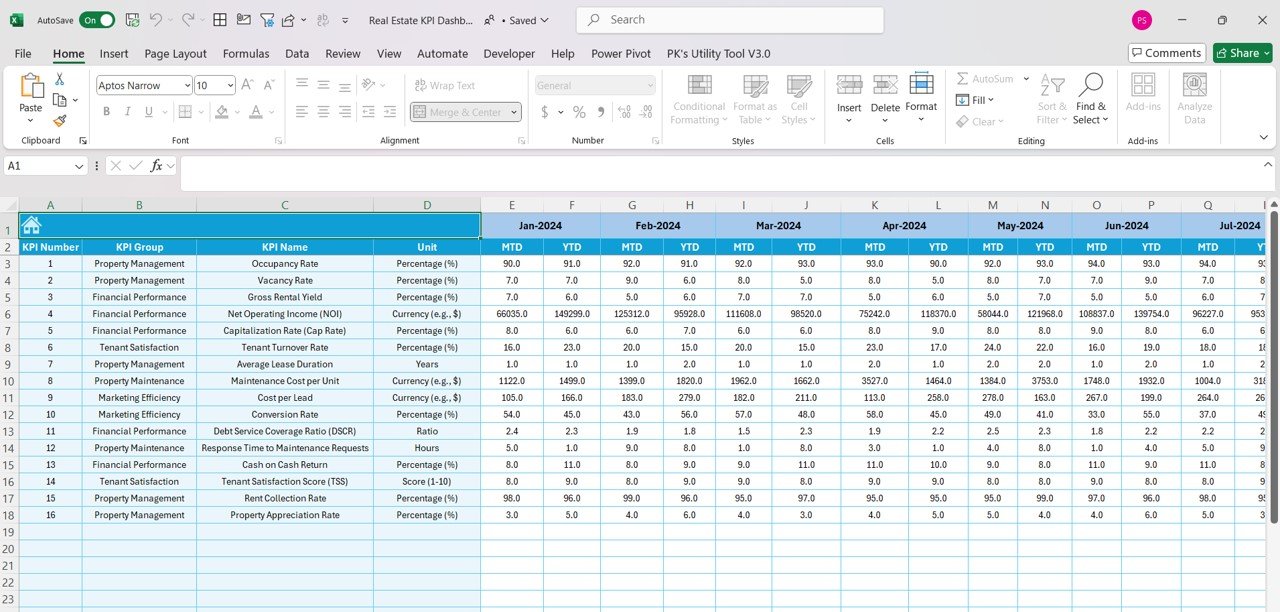
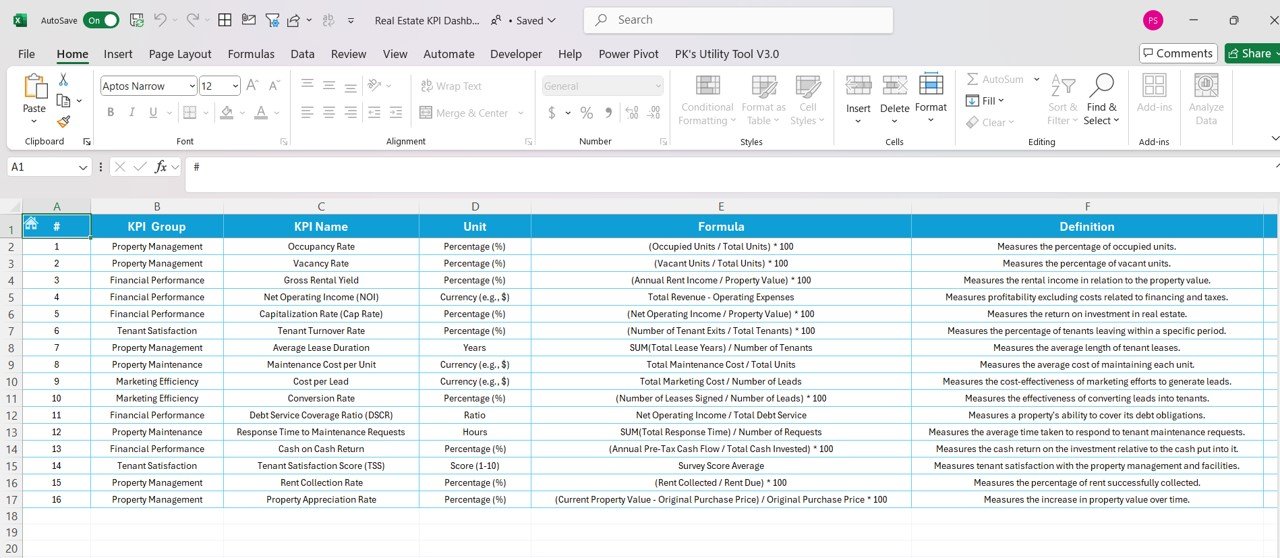
Track essential real estate KPIs such as occupancy rates, rental income, sales revenue, property value appreciation, and market trends to understand your property’s financial performance.
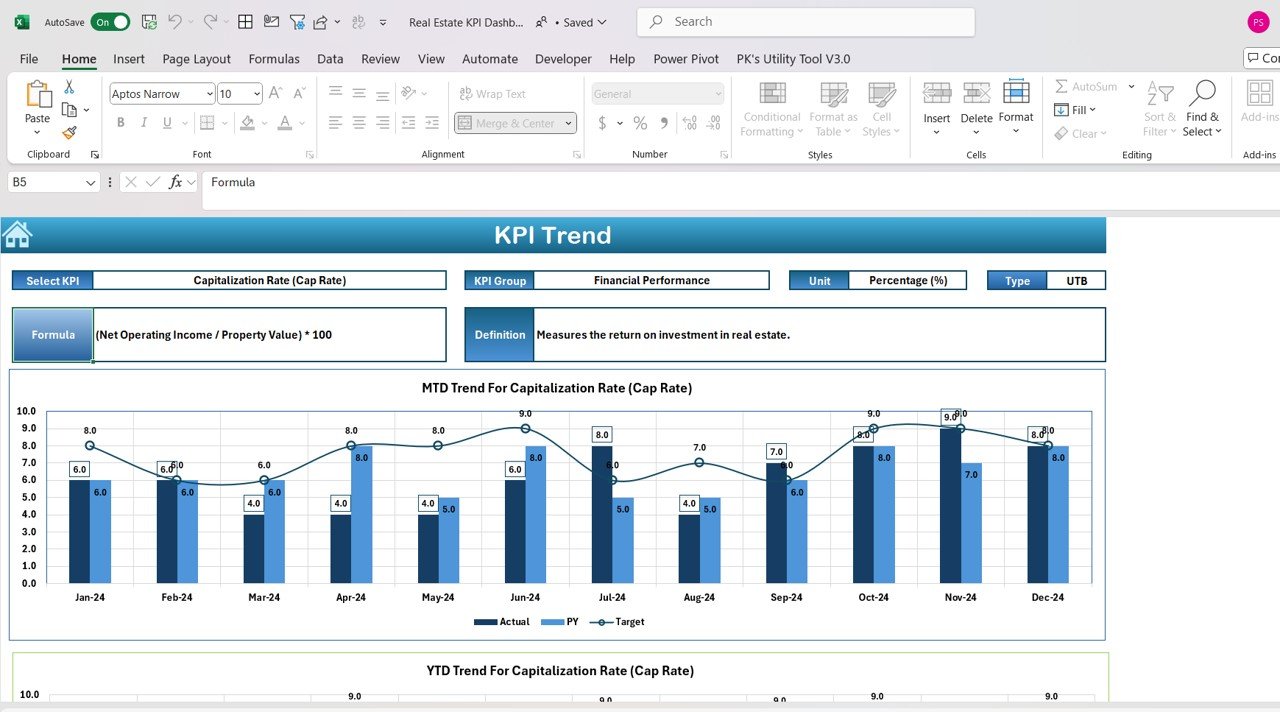
📉 Market Trend Analysis
Analyze the latest market trends, including price changes and property values, to make data-driven decisions for property investments or sales strategies.
📈 Real-Time Data Updates
As you input new data, the dashboard updates automatically, providing you with the latest insights into your properties’ performance and the broader real estate market.
📊 Customizable Metrics and Layout
Tailor the dashboard to track the specific KPIs that are important to your real estate business, adjusting for property types, rental vs. sale data, and investment goals.
🎨 Visual Data Representation
Use charts, graphs, and progress indicators to easily visualize important real estate metrics and make data more digestible for decision-making.
Why You’ll Love the Real Estate KPI Dashboard in Excel:
✅ Comprehensive Monitoring – Keep track of all your real estate KPIs in one central dashboard, including property performance, sales, rental income, and market trends. ✅ Real-Time Updates – Automatically update the dashboard as you enter new property data, ensuring you have up-to-the-minute insights. ✅ Customizable for Your Needs – Tailor the dashboard to reflect your real estate goals and track the metrics that matter most to you, whether you’re managing properties or analyzing investments. ✅ Visual Insights – Visualize complex data with easy-to-read charts and graphs, simplifying analysis and making it easier to interpret performance. ✅ User-Friendly – Designed for ease of use, this dashboard is accessible even for users with minimal Excel knowledge, making it easy to manage real estate KPIs.
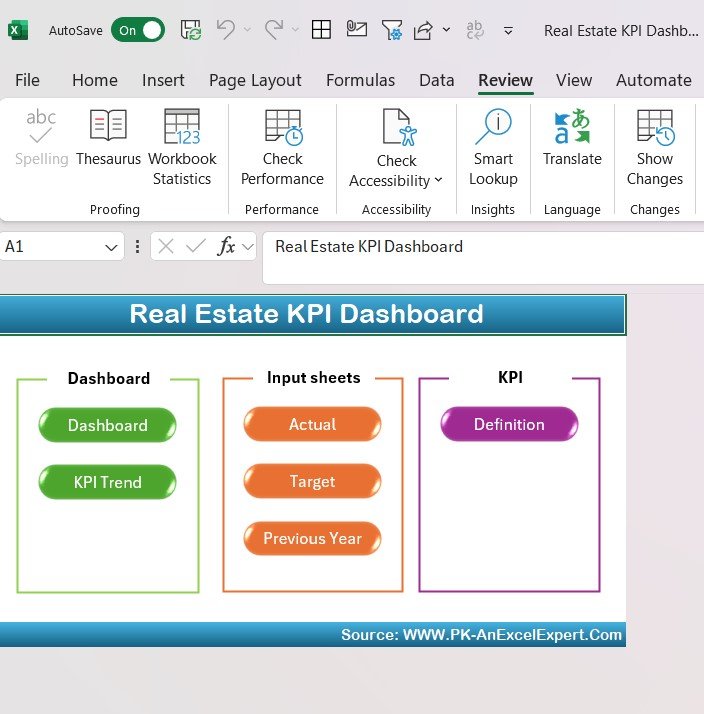
What’s Inside the Real Estate KPI Dashboard in Excel:
- Real Estate KPIs – Track key metrics like occupancy rates, rental income, property appreciation, and market trends.
- Customizable Metrics – Adjust the dashboard to monitor your specific investment goals, property types, or sales targets.
- Market Trend Tracking – Visualize property market trends and price changes over time to make informed decisions.
- Financial Tracking – Monitor rental income, sales revenue, and property-related expenses to track profitability.
- Visual Representation – Use pie charts, bar graphs, and line graphs to represent data, providing a clear overview of performance.
How to Use the Real Estate KPI Dashboard in Excel:
1️⃣ Download the Template – Get immediate access to the Excel file upon purchase. 2️⃣ Input Your Real Estate Data – Enter your data such as rental income, sales revenue, occupancy rates, and property values. 3️⃣ Customize the Dashboard – Adjust the KPIs, layout, and charts to fit your real estate business and investment goals. 4️⃣ Monitor Performance – Use the dashboard to track property performance, investment trends, and profitability in real time. 5️⃣ Make Informed Decisions – Leverage the insights from the dashboard to adjust your investment strategy, optimize property management, and improve returns.
Who Can Benefit from the Real Estate KPI Dashboard in Excel:
- Real Estate Managers
- Property Investors
- Realtors
- Property Managers
- Real Estate Analysts
- Anyone managing real estate portfolios or seeking to track property performance
The Real Estate KPI Dashboard in Excel is an indispensable tool for anyone looking to track, analyze, and optimize their real estate investments and property management. With customizable features, real-time data updates, and visual representations, it helps you make smarter decisions and optimize your portfolio’s performance.
Click here to read the Detailed blog post
https://www.pk-anexcelexpert.com/real-estate-kpi-dashboard-in-excel/


Reviews
There are no reviews yet.