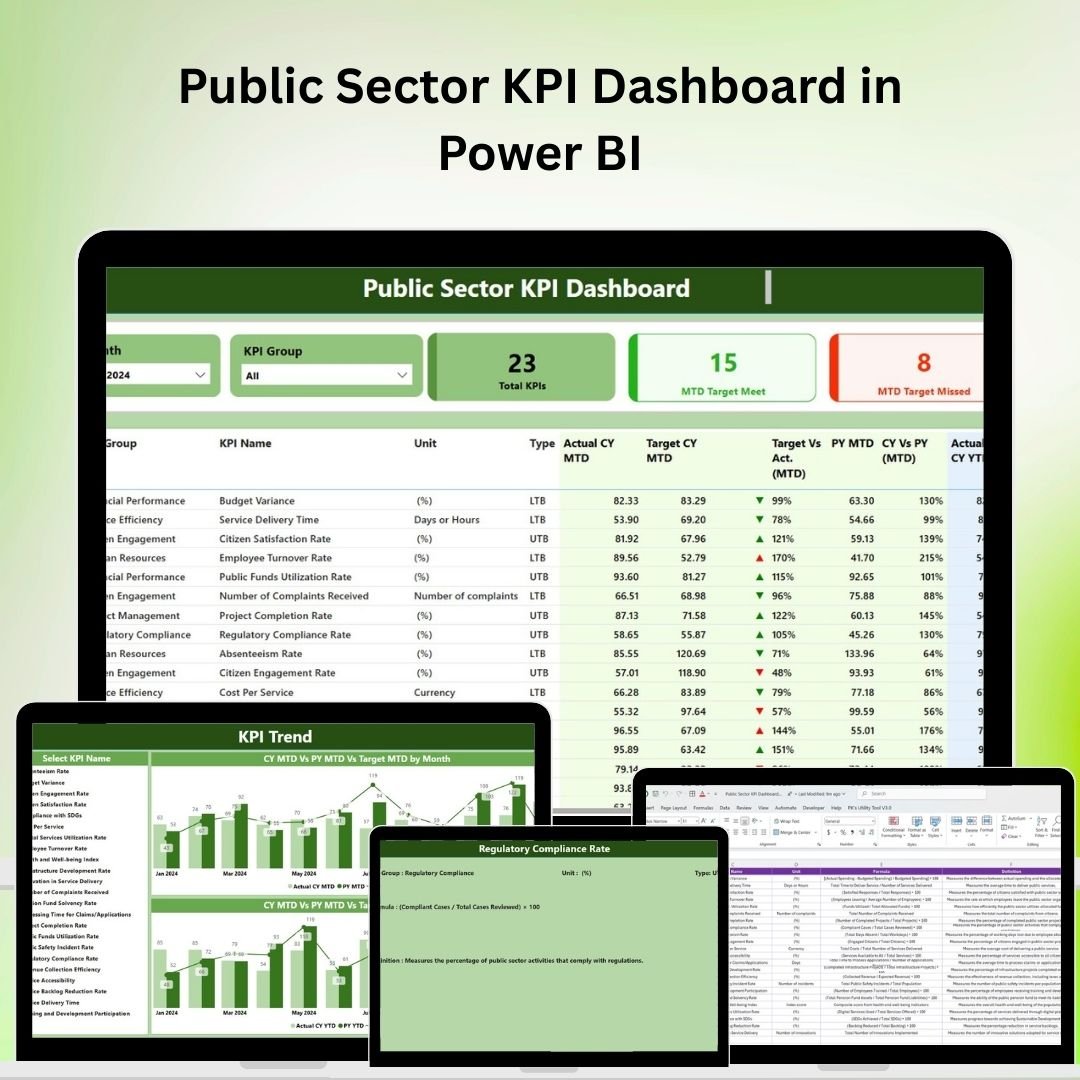


The Public Sector KPI Dashboard in Power BI is a comprehensive tool designed to help government agencies, public organizations, and public sector professionals monitor and track key performance indicators (KPIs) that are crucial for improving operational efficiency, transparency, and accountability. This dashboard provides real-time insights into the performance of various public services, enabling stakeholders to make informed decisions that drive policy improvements, resource allocation, and service delivery.
Whether you’re overseeing social services, infrastructure projects, or government operations, this Power BI-based dashboard allows you to track a wide range of metrics—from budget utilization and project completion rates to citizen satisfaction and service efficiency. With visually rich charts and intuitive reporting, this tool helps public sector teams stay aligned with their goals, maximize resources, and improve public service outcomes.
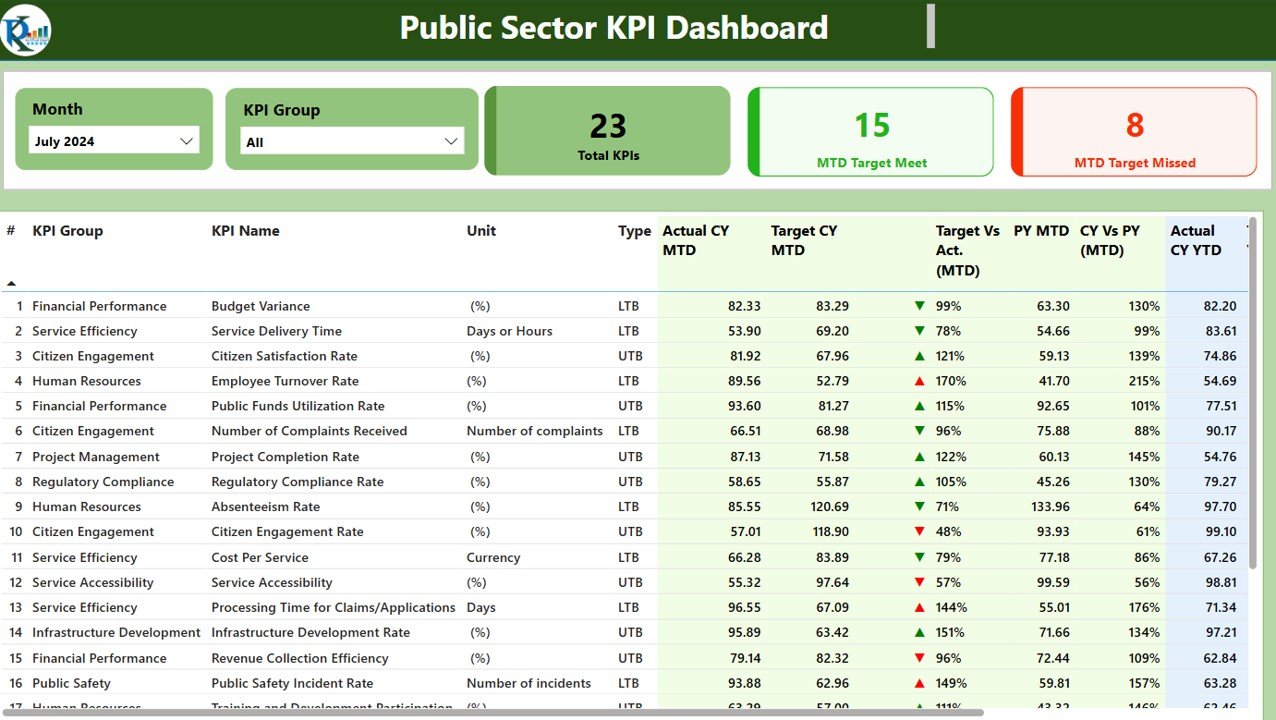
Key Features of the Public Sector KPI Dashboard in Power BI
📊 Comprehensive KPI Monitoring
Track a broad range of KPIs, including budget utilization, project completion status, service efficiency, and citizen satisfaction. This allows public sector organizations to assess their performance and identify areas for improvement.
💡 Budget & Resource Allocation Tracking
Monitor how well resources and budgets are being allocated and utilized. This feature is crucial for ensuring fiscal responsibility and improving the management of public funds.
📈 Project Progress & Completion Tracking
Track the progress of ongoing public sector projects in real-time. The dashboard provides a clear overview of project completion rates, deadlines, and resource allocation, helping you stay on track with public infrastructure and development projects.
🔄 Real-Time Data Integration
Integrate data from multiple public sector systems, such as project management platforms, finance systems, and citizen feedback tools. The real-time data integration ensures that you are always working with the most up-to-date information available.
⚙️ Customizable Dashboards & KPIs
Customize the dashboard to suit the specific needs of your public sector organization. Add or modify KPIs to track areas most relevant to your department or agency’s goals.
📅 Time-Based Reporting & Trend Analysis
Generate time-based reports to analyze trends over various periods (daily, weekly, monthly). This feature is valuable for tracking long-term performance and identifying patterns that can guide future decisions.
Why You’ll Love the Public Sector KPI Dashboard in Power BI
✅ Enhanced Transparency & Accountability
Gain a clear, real-time overview of public sector performance. Track key metrics and ensure accountability for resource utilization, project completion, and service delivery.
✅ Improve Budget & Resource Management
Monitor budget utilization and resource allocation, ensuring that public funds are being used efficiently and effectively. Improve financial accountability and avoid over or under-utilization.
✅ Streamline Project & Service Delivery
Track progress across public sector projects and service delivery programs. Ensure that key initiatives are completed on time, within budget, and meet the expected standards.
✅ Informed Decision-Making
Leverage real-time insights to make data-driven decisions, improving efficiency and ensuring that policies and strategies are aligned with performance objectives.
✅ Fully Customizable & Scalable
Tailor the dashboard to meet the specific needs of different public sector departments. Add or remove KPIs, adjust reporting formats, and ensure the dashboard aligns with your operational goals.
What’s Inside the Public Sector KPI Dashboard in Power BI?
-
Comprehensive KPI Monitoring: Track key metrics like budget utilization, project completion, and citizen satisfaction.
-
Budget & Resource Allocation Tracking: Monitor fiscal responsibility and effective resource management.
-
Project Progress Tracking: Track the status of ongoing public sector projects, deadlines, and milestones.
-
Real-Time Data Integration: Get up-to-date data from various public sector systems.
-
Customizable KPIs: Modify the dashboard to suit your specific goals and needs.
-
Time-Based Reporting: Analyze trends and performance over time for better decision-making.
How to Use the Public Sector KPI Dashboard in Power BI
1️⃣ Download the Template: Access the Public Sector KPI Dashboard in Power BI instantly.
2️⃣ Integrate Your Data Sources: Link data from your finance, project management, and citizen feedback systems for real-time updates.
3️⃣ Track KPIs & Performance: Monitor the performance of key public sector metrics such as budget use, project completion, and citizen satisfaction.
4️⃣ Generate Reports & Analyze Trends: Use time-based reports to analyze long-term performance trends and identify areas for improvement.
5️⃣ Optimize Resource Allocation & Service Delivery: Leverage insights to optimize the allocation of resources, improve project completion, and enhance service delivery.
Who Can Benefit from the Public Sector KPI Dashboard in Power BI?
🔹 Government Agencies & Departments
🔹 Public Sector Managers & Administrators
🔹 Budget & Resource Management Teams
🔹 Project Managers for Public Sector Projects
🔹 Public Policy Makers & Analysts
🔹 Citizen Services & Engagement Teams
🔹 Non-Profit Organizations Working with Government Projects
Improve the transparency, accountability, and effectiveness of public sector projects and services with the Public Sector KPI Dashboard in Power BI. Track essential KPIs, analyze trends, and make data-driven decisions to optimize your operations and improve service delivery.
Click here to read the Detailed blog post
Visit our YouTube channel to learn step-by-step video tutorials
Youtube.com/@PKAnExcelExpert


Reviews
There are no reviews yet.