


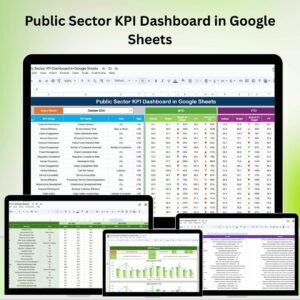
The Public Sector KPI Dashboard in Google Sheets is a powerful tool designed for government agencies and public organizations to monitor and improve their service delivery. By centralizing key performance indicators (KPIs) into one accessible platform, the dashboard facilitates data-driven decision-making, ensuring better efficiency and accountability in public sector operations.
This Google Sheets-based dashboard allows users to track a variety of KPIs such as budget adherence, service delivery times, citizen satisfaction, and operational efficiency. With real-time data updates, this tool helps organizations stay on top of their performance, identify areas for improvement, and align their efforts with strategic goals.

Key Features of the Public Sector KPI Dashboard in Google Sheets
📊 Comprehensive Dashboard Overview
-
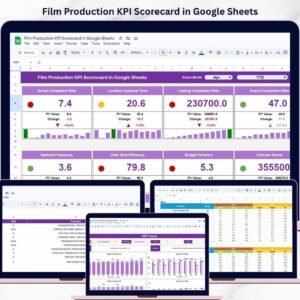
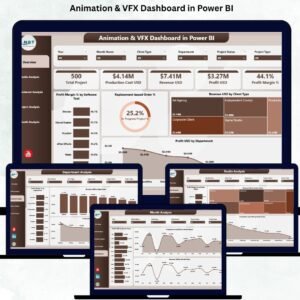
Performance Metrics Display: The dashboard provides a visual representation of essential public sector KPIs, such as service delivery time, budget performance, and citizen satisfaction rates.
-
Dynamic Data Selection: Users can select specific time frames (monthly, quarterly, or yearly) from a dropdown menu, allowing the dashboard to update KPI data accordingly for deeper analysis.
📈 Detailed KPI Analysis
-
KPI Trend Tracking: Track the performance of various KPIs over time with trend charts, comparing actual figures against targets and historical data to ensure progress is being made.
-
KPI Definitions and Formulas: Each KPI includes definitions, units of measurement, and calculation formulas, ensuring clarity and consistency when evaluating performance.
💼 Data Management and Customization
-
Actual Numbers Input: Easily input monthly or yearly data into the dashboard, with real-time updates reflecting changes in service delivery and other KPIs.
-
Target Setting: Define and adjust monthly and yearly targets for each KPI to facilitate accurate performance comparisons and goal tracking.
-
Historical Data Comparison: Maintain and compare historical performance data, enabling teams to identify trends and make adjustments to improve future outcomes.
📋 User-Friendly Navigation and Support
-
Home Sheet Navigation: A central hub with easy-to-use navigation buttons makes it simple to access different sections of the dashboard, such as budget tracking, service efficiency, and citizen engagement.
-
Customization and Support: Easily modify the dashboard to suit your organization’s specific needs. Add new KPIs, adjust performance goals, and integrate additional data sources as required.
Benefits of Using the Public Sector KPI Dashboard in Google Sheets
✅ Improved Service Delivery
With real-time performance tracking, public sector organizations can streamline their operations, ensuring timely service delivery and efficient resource allocation.
✅ Enhanced Accountability and Transparency
By tracking KPIs, public organizations can ensure that resources are used effectively and that the government or public agency meets its strategic goals, enhancing public trust and accountability.
✅ Customizable and Scalable
The dashboard is fully customizable, allowing you to adapt it to the specific needs of your organization, whether you’re focusing on citizen satisfaction, budget performance, or operational efficiency.
Getting Started with Your Public Sector KPI Dashboard in Google Sheets
-
Define Key Performance Indicators (KPIs): Identify the most relevant KPIs for your public sector organization, such as service response time, citizen satisfaction rates, or budget adherence.
-
Set Up the Dashboard: Customize the dashboard layout to include the KPIs most critical to your public sector operations.
-
Input Data: Enter actual performance data for each KPI, ensuring consistency and accuracy across all metrics.
-
Customize Features: Adjust the dashboard to reflect your organization’s specific goals and needs, such as adding new KPIs or changing the visual style.
-
Monitor and Update: Regularly review and update the dashboard to ensure it stays aligned with your organization’s goals and reflects the latest data.
By using the Public Sector KPI Dashboard in Google Sheets, your organization can improve decision-making, boost operational efficiency, and ensure that public services are delivered effectively and transparently.
Click here to read the Detailed blog post
Public Sector KPI Dashboard in Google Sheets
Visit our YouTube channel to learn step-by-step video tutorials
YouTube.com/@PKAnExcelExpert


Reviews
There are no reviews yet.