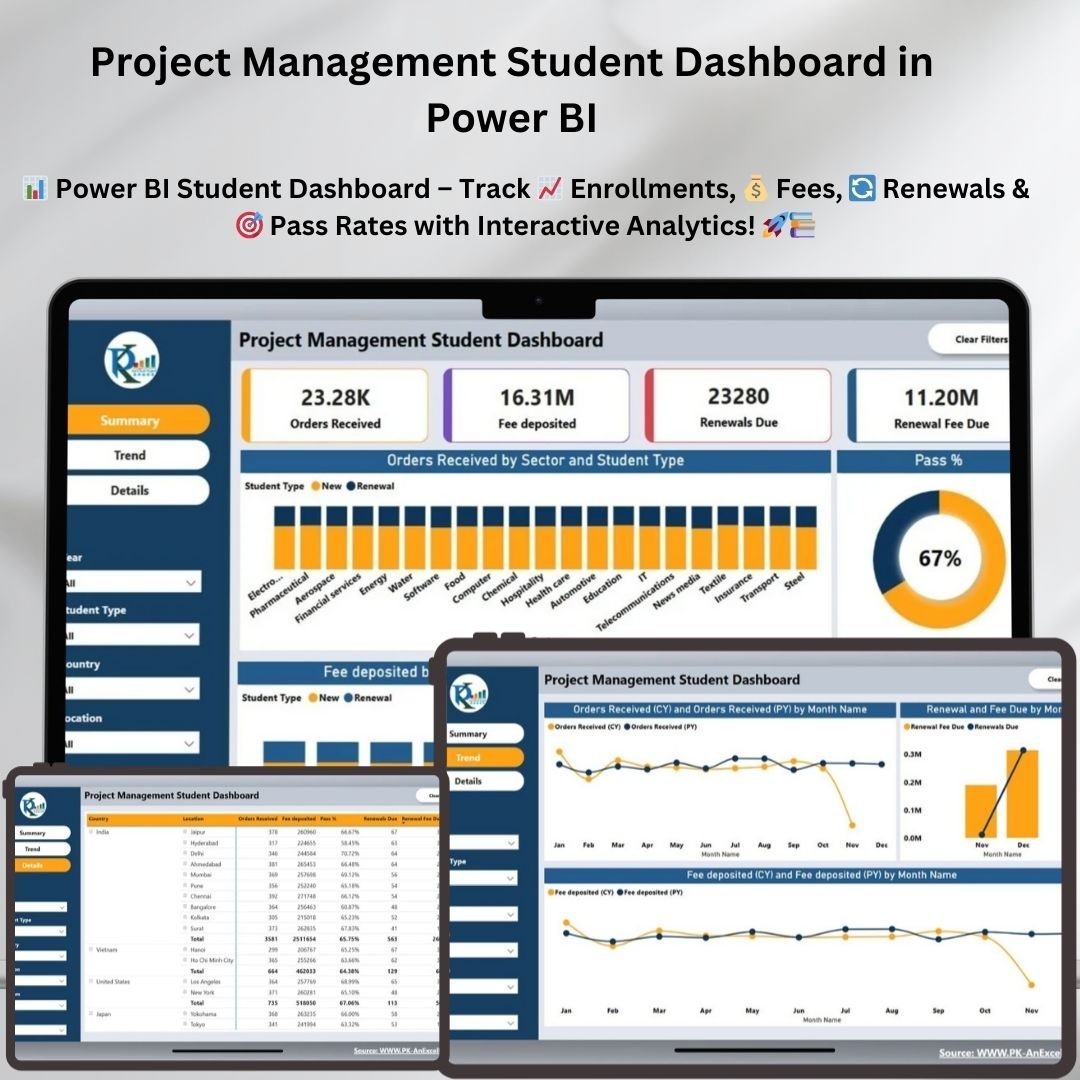
Managing student enrollment, fee deposits, renewals, and pass rates can be overwhelming without the right tools. The Project Management Student Dashboard in Power BI is a comprehensive solution designed to provide real-time insights into student data with dynamic visualizations and interactive filters. This dashboard helps institutions track student progress, financial metrics, and enrollment trends with ease. Project Management Student Dashboard
Key Features
✔ Three Comprehensive Pages – The dashboard includes Summary, Trend, and Details pages, offering a holistic view of student management.
✔ Dynamic Visualizations – Get real-time insights on orders received, fee deposits, renewals, and pass rates through engaging charts and graphs.
✔ Student Performance Tracking – Monitor student enrollment by sector, location, and reference source to optimize marketing efforts.
✔ Interactive Trend Analysis – Compare current and previous year enrollments, fee deposits, and renewals through detailed trend graphs.
✔ Easy Navigation & Filters – Slicers and filters allow users to analyze data by year, student type, country, location, program, and sector.
✔ Pass Rate Analytics – A specialized visual tracks pass percentages, helping institutions understand student success rates.
✔ Order Source Breakdown – View how students enroll (social media, website, referrals, promotional emails, etc.) for data-driven decision-making.
✔ Customizable & Scalable – Easily modify the dashboard to include new data points, reports, and KPIs as needed.
✔ Clean & Professional UI – The intuitive layout ensures seamless navigation, making it easy to find the most critical student data in seconds.
✔ Power BI-Driven Efficiency – Harness the power of Power BI to gain faster, more accurate insights for better decision-making.
Detailed Breakdown of Pages
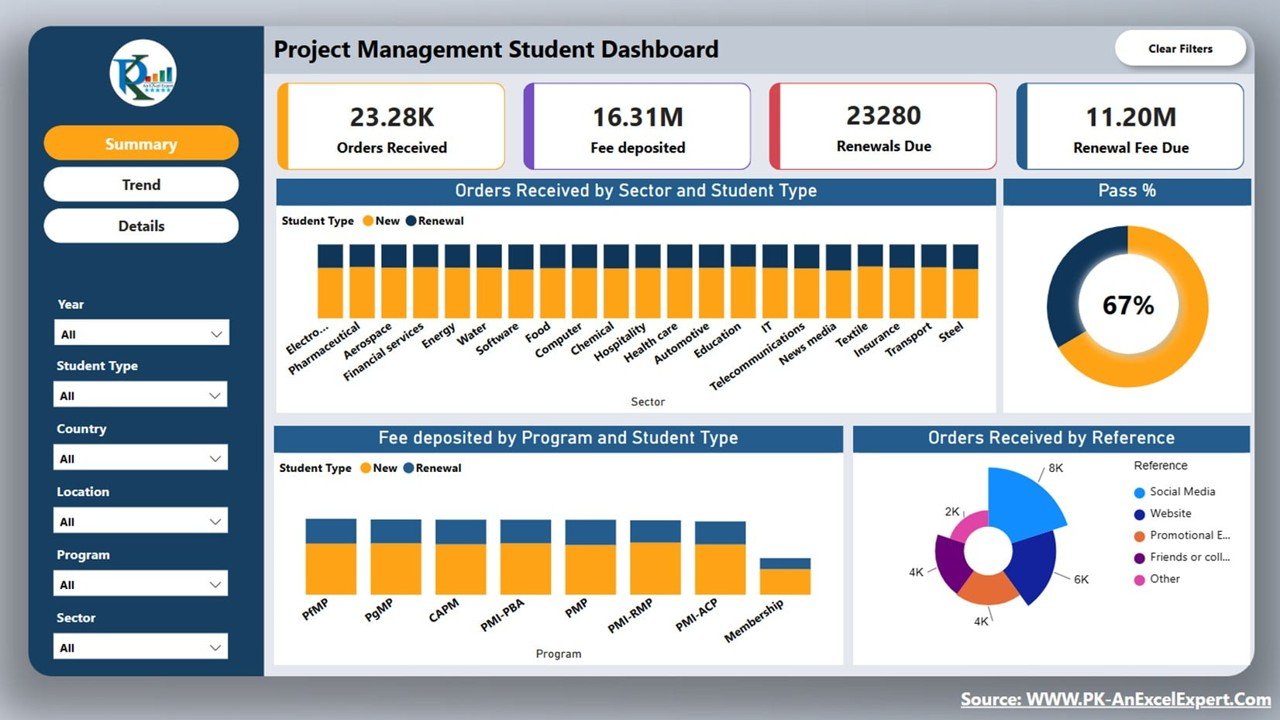
1. Summary Page
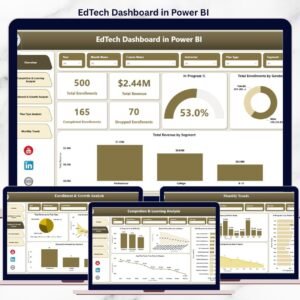
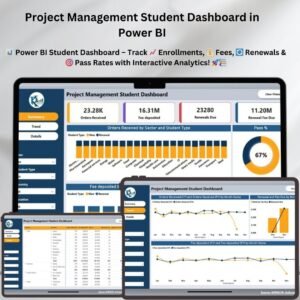
The Summary Page provides an at-a-glance view of key student data, including:
- Total orders received (new enrollments + renewals)
- Fee deposits & renewal dues
- Pass percentages for different programs
- Enrollment breakdown by sector and student type
This page helps stakeholders quickly grasp performance metrics and make informed decisions.
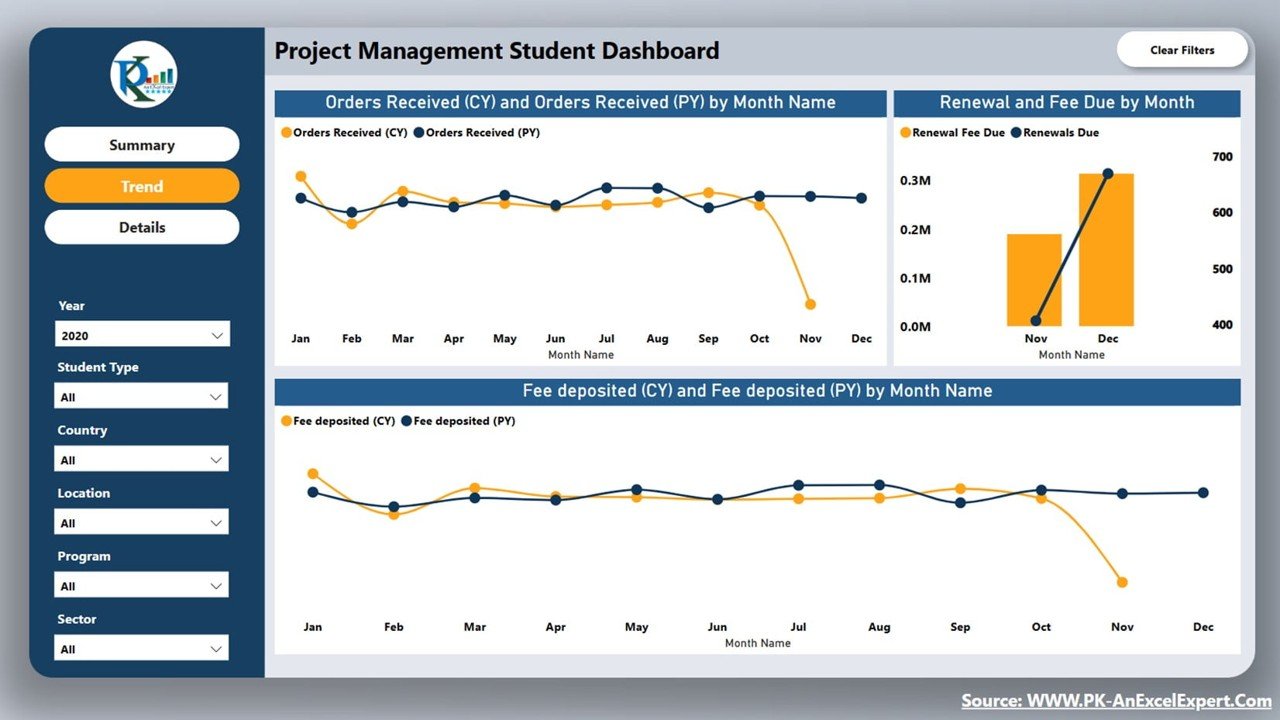
2. Trend Page
The Trend Page offers a month-wise comparison of:
- Orders received in the current vs. previous year
- Fee deposits over time
- Renewal dues and payment trends
By analyzing trends, institutions can identify patterns and forecast future enrollments.
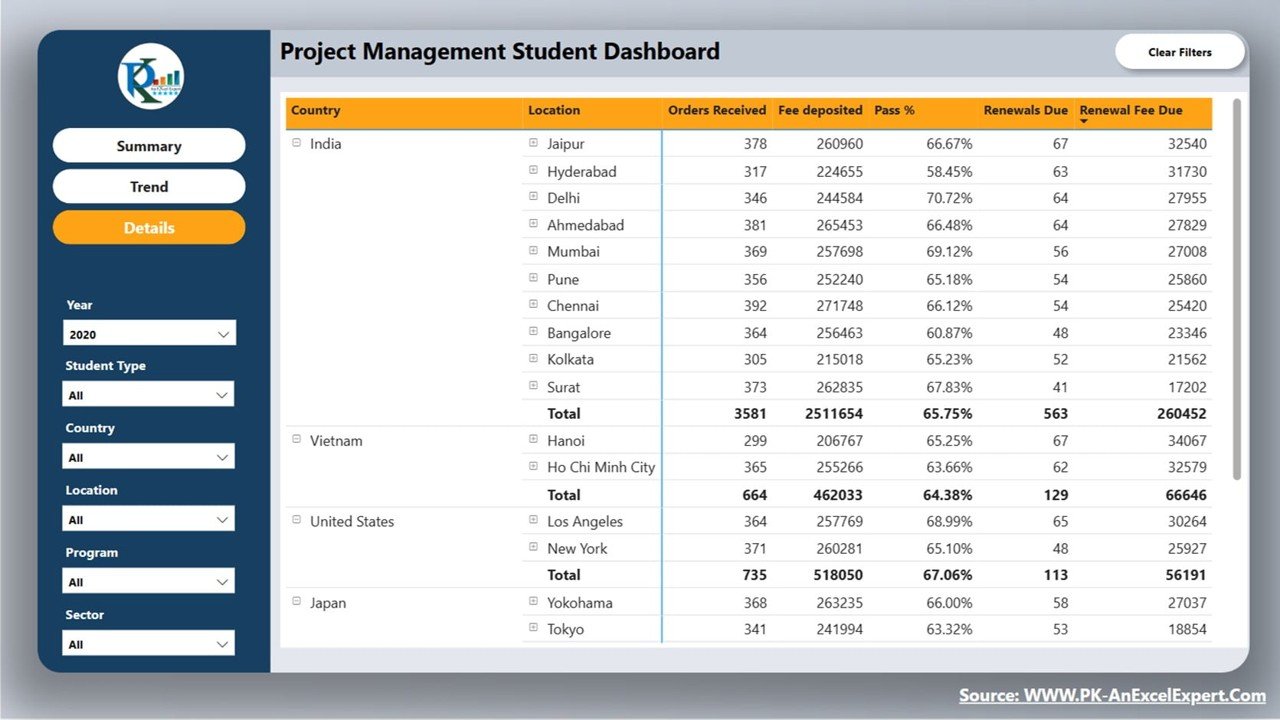
3. Details Page
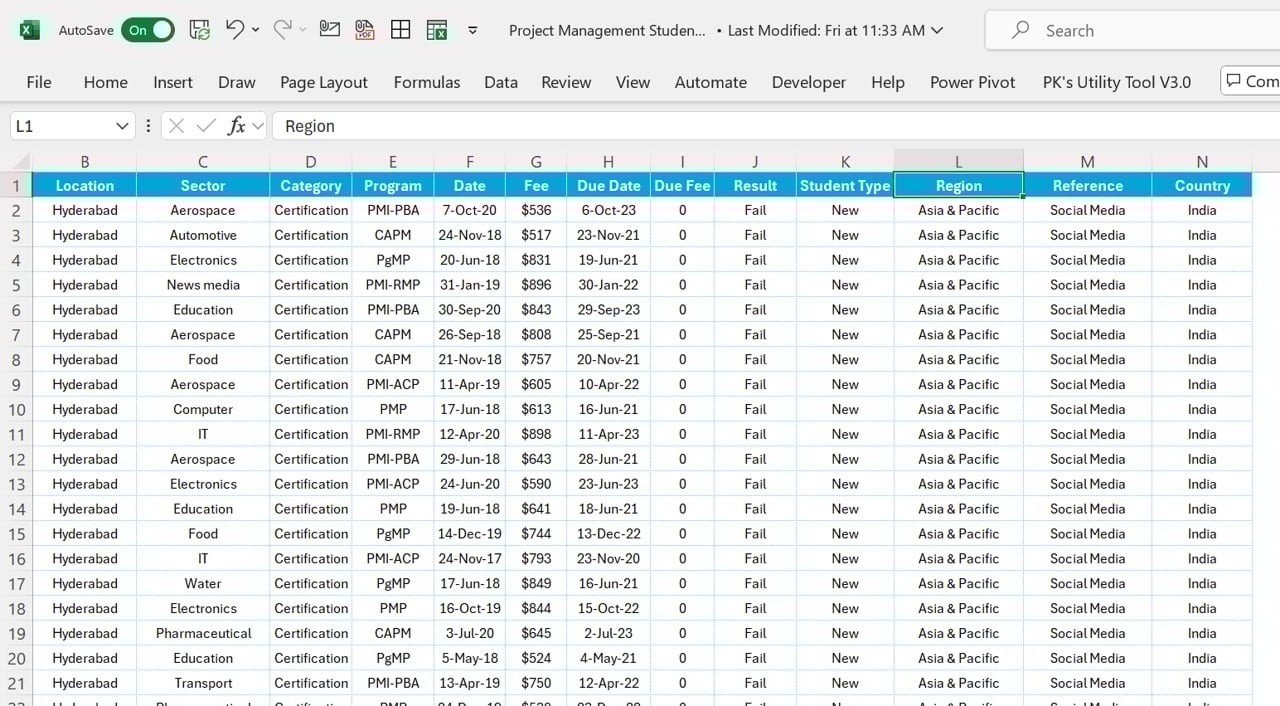
The Details Page allows users to drill down into student records, categorized by:
- Country & location
- Program & sector
- Enrollment reference sources
- Pass rates & renewals
Institutions can use this detailed data for strategic planning and operational improvements.
Why Choose This Dashboard?
This Project Management Student Dashboard in Power BI is the perfect tool for educational institutions, training centers, and project management certification providers. It helps streamline student management, track key financial and academic metrics, and optimize marketing and outreach efforts.
📊 Get a clear picture of student performance & financials in one dashboard!
🔍 Analyze, optimize, and make data-driven decisions with ease!
Click here to read the detailed blog post Project Management Student Dashboard
Visit our YouTube channel to learn step-by-step video tutorials
Watch the step-by-step video tutorial:Project Management Student Dashboard
Also check our Procurement Dashboard in Power BI


Reviews
There are no reviews yet.