Maintaining high product quality is critical for customer satisfaction, brand reputation, and operational efficiency. However, many organizations still track quality KPIs across multiple spreadsheets, manual reports, and disconnected files. As a result, quality teams struggle to identify trends, compare targets, and take timely corrective action.
That is exactly where the Product Quality KPI Dashboard in Google Sheets delivers immense value.
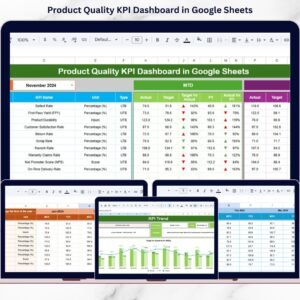
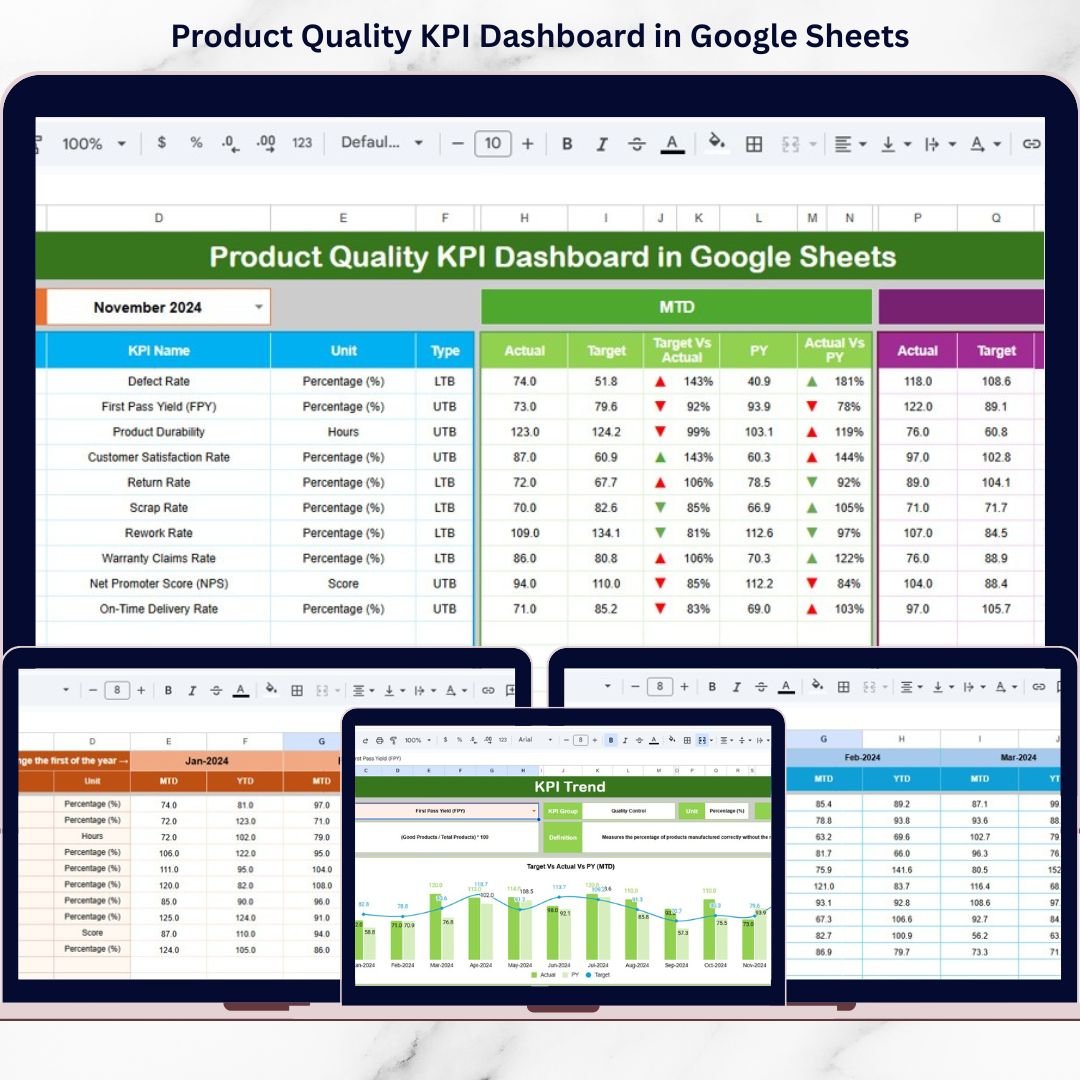
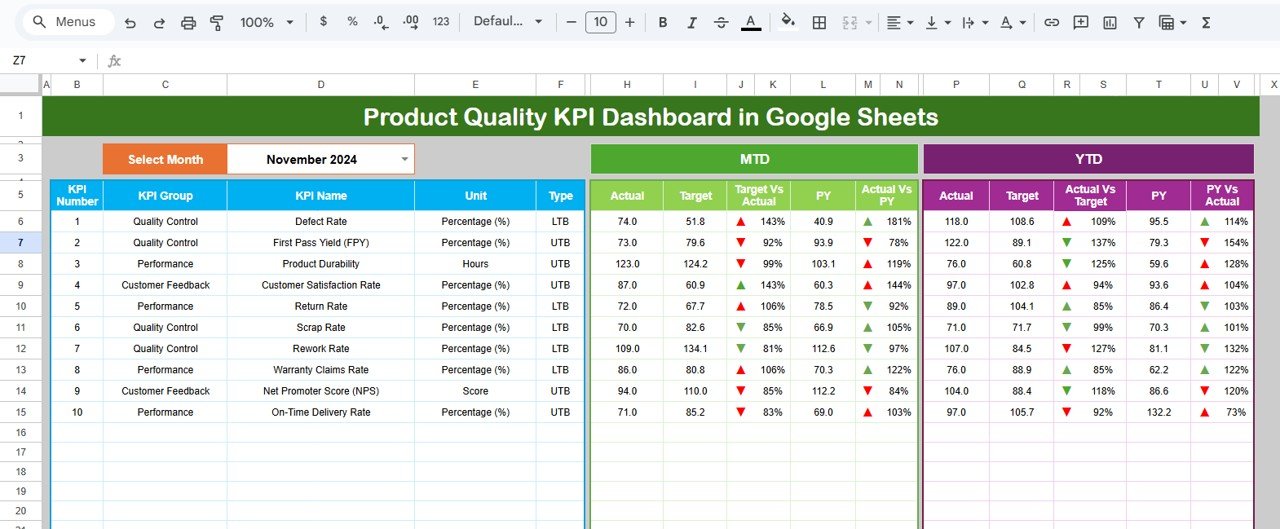
This ready-to-use Google Sheets dashboard provides a centralized, structured, and visual way to monitor product quality performance. Instead of spending hours consolidating reports, teams can instantly review MTD (Month-to-Date), YTD (Year-to-Date), Target, and Previous Year performance for all quality KPIs in one interactive dashboard.
Because the dashboard is built entirely in Google Sheets, it is easy to update, collaborative, and accessible from anywhere—without macros or technical complexity. As a result, quality teams and management gain real-time visibility into quality trends and improvement opportunities.
🔑 Key Features of Product Quality KPI Dashboard in Google Sheets
📅 MTD & YTD Performance Tracking – Monitor monthly and yearly quality performance
🎯 Target vs Actual Comparison – Instantly identify quality gaps
📊 Previous Year Comparison – Measure year-over-year quality improvement
🔼🔽 Up & Down Arrow Indicators – Quickly spot improving or declining KPIs
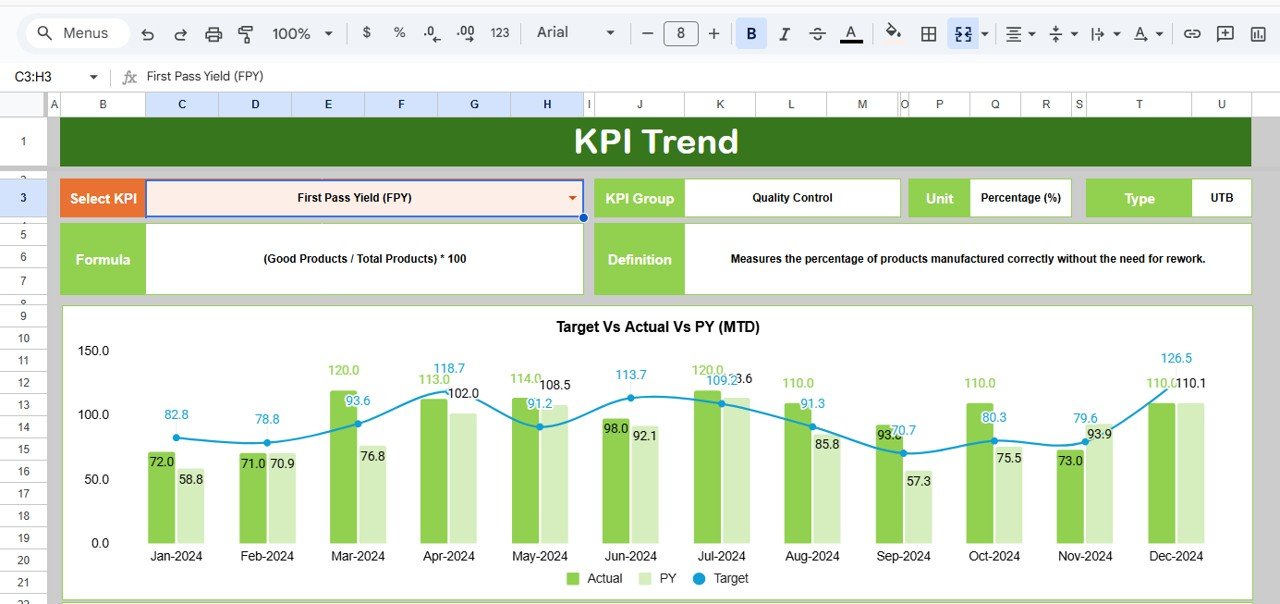
📈 KPI Trend Analysis – Analyze trends for individual quality KPIs
📋 KPI Definition & Formula Clarity – Understand what each KPI measures
🧠 LTB & UTB KPI Logic – Supports Lower-the-Better and Upper-the-Better KPIs
☁️ 100% Google Sheets Based – Easy, secure, and collaborative
📂 What’s Inside the Product Quality KPI Dashboard
This dashboard contains six well-structured sheet tabs, each designed for a specific role in quality tracking.
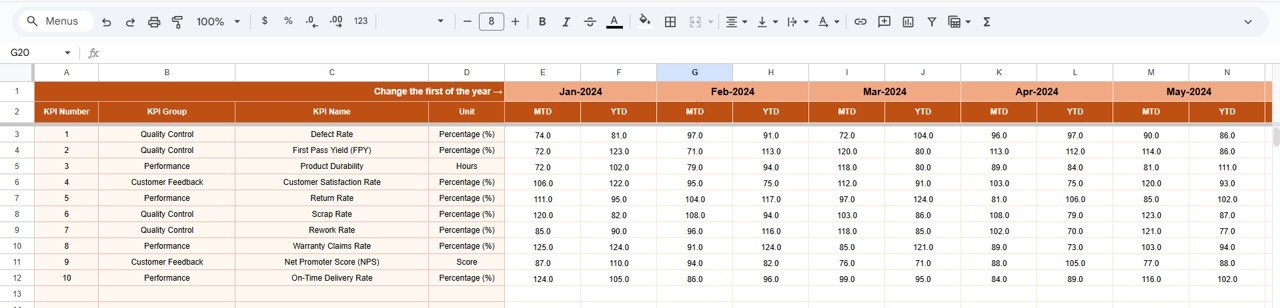
📄 Dashboard Sheet (Main View)
This is the executive summary page. By selecting a month from a dropdown, users can view:
-
MTD Actual, Target, and Previous Year values
-
Target vs Actual % and PY vs Actual %
-
Conditional formatting with ▲ / ▼ arrows
-
YTD performance with the same comparison logic
This layout allows teams to instantly identify critical quality KPIs.
📄 KPI Trend Sheet
This sheet provides deep KPI-level analysis. Users can select a KPI and view:
-
KPI Group
-
Unit of Measurement
-
KPI Type (LTB / UTB)
-
KPI Formula and Definition
-
MTD and YTD trend charts
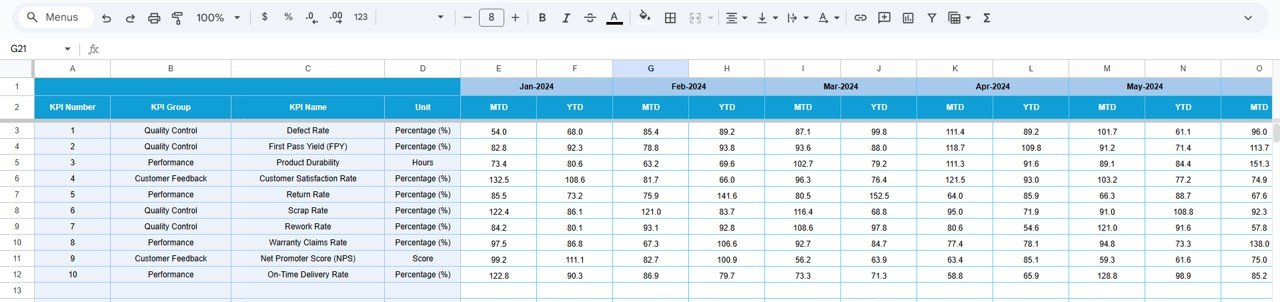
📄 Actual Number Sheet
This sheet is used for entering actual KPI values:
-
MTD actuals
-
YTD actuals
-
Month selection for structured data entry
📄 Target Sheet
This sheet stores KPI targets:
-
MTD target values
-
YTD target values
-
Monthly target tracking for each KPI
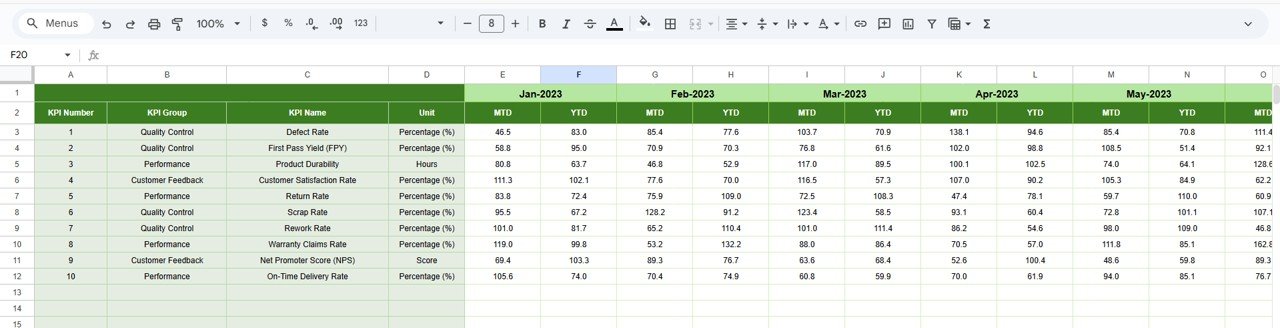
📄 Previous Year Number Sheet
This sheet enables historical comparison:
-
Previous year MTD values
-
Previous year YTD values
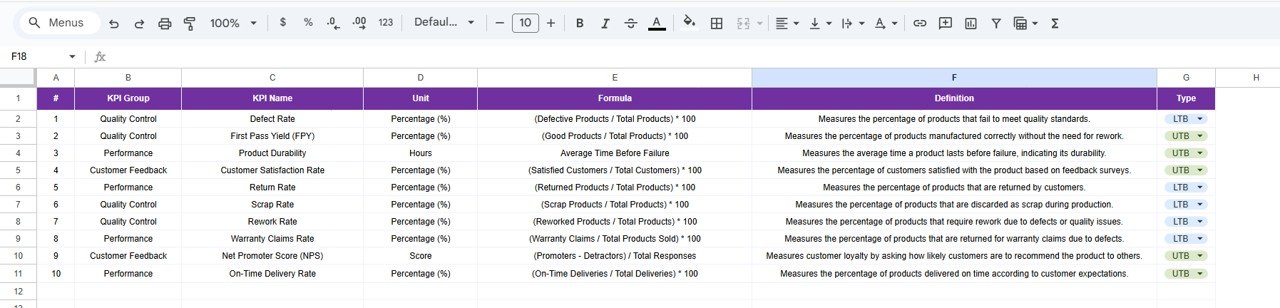
📄 KPI Definition Sheet
This acts as the master KPI reference:
-
KPI Name
-
KPI Group
-
Unit
-
Formula
-
Definition
-
KPI Type (LTB / UTB)
🧭 How to Use the Product Quality KPI Dashboard
Using the dashboard is simple:
1️⃣ Define KPIs in the KPI Definition sheet
2️⃣ Enter targets in the Target sheet
3️⃣ Update actual values in the Actual Number sheet
4️⃣ Add previous year data for comparison
5️⃣ Select the month on the Dashboard to view insights
Because calculations update automatically, users always work with accurate data.
👥 Who Can Benefit from This Product Quality KPI Dashboard
This dashboard is ideal for:
-
🏭 Quality Assurance Teams
-
📊 Quality Managers
-
🧪 Manufacturing & Production Teams
-
📦 Operations Managers
-
🧠 Continuous Improvement Teams
-
🏢 Small & Medium Enterprises
If product quality monitoring is critical to your operations, this dashboard is a must-have.
🔗 Click here to read the Detailed Blog Post
Watch the step-by-step video tutorial:
Visit our YouTube channel to learn step-by-step video tutorials