

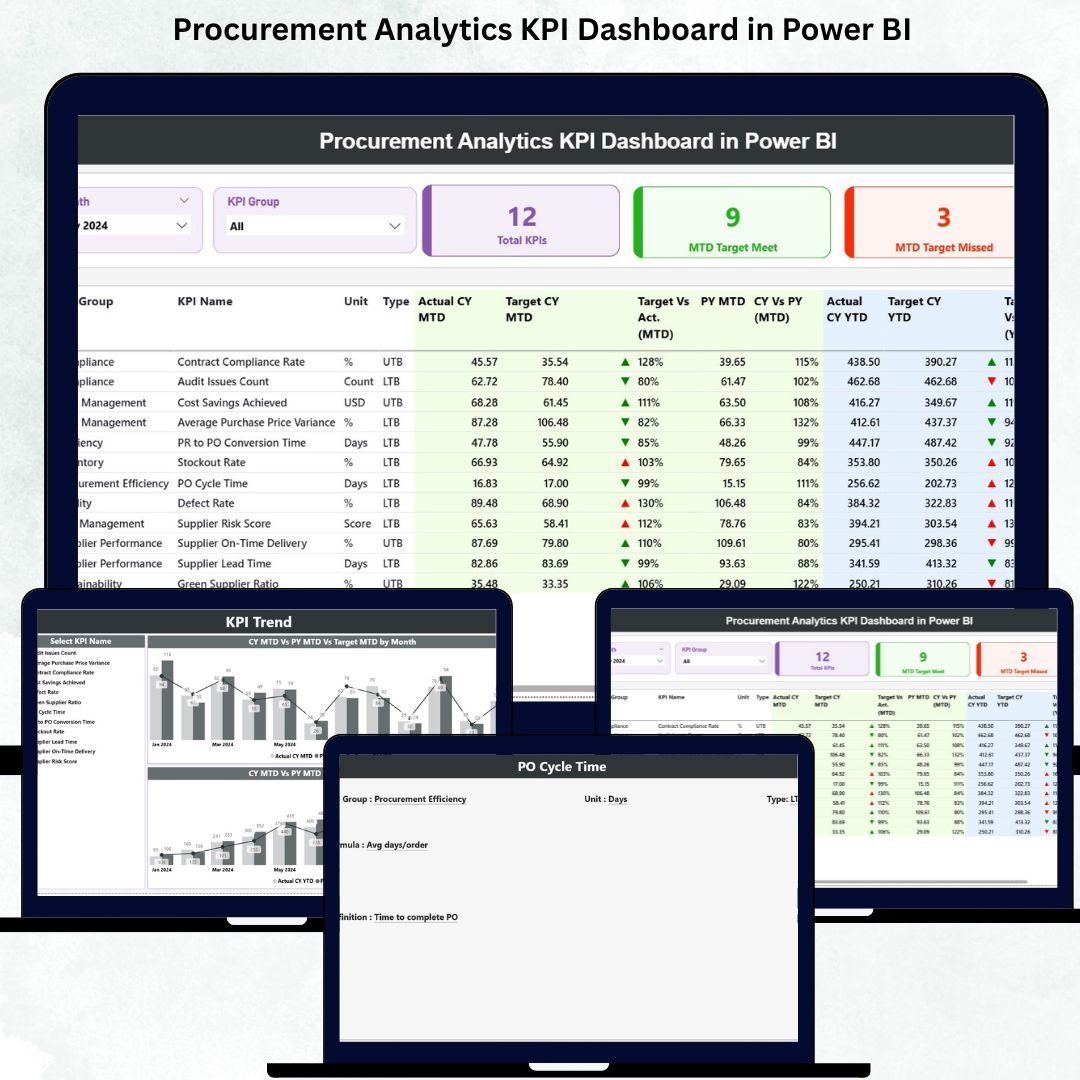

Procurement performance directly impacts cost control, supplier efficiency, risk management, and long-term business growth. However, many organizations still struggle with scattered procurement data, manual reports, and delayed insights. This is exactly where the Procurement Analytics KPI Dashboard in Power BI becomes a game-changer.
This ready-to-use digital product converts complex procurement KPIs into clear, interactive, and decision-ready insights. Instead of spending hours preparing reports, procurement teams can instantly track targets, spot inefficiencies, and compare year-over-year performance using a single Power BI dashboard connected to Excel data sources. Procurement Analytics KPI Dashboard in Power BI The result is faster decisions, better cost visibility, and stronger procurement governance.
Whether you manage sourcing, vendor performance, contracts, or cost controls, this dashboard helps you move from reactive reporting to proactive procurement analytics.
🚀 Key Features of the Procurement Analytics KPI Dashboard in Power BI
✅ Real-Time KPI Tracking – Monitor procurement KPIs instantly with automatic Power BI refresh
📊 MTD & YTD Performance Analysis – Track month-to-date and year-to-date actuals vs targets
🎯 Target Achievement Indicators – Visual arrows instantly show KPIs met or missed
📅 Interactive Slicers – Filter insights by month and KPI group in seconds
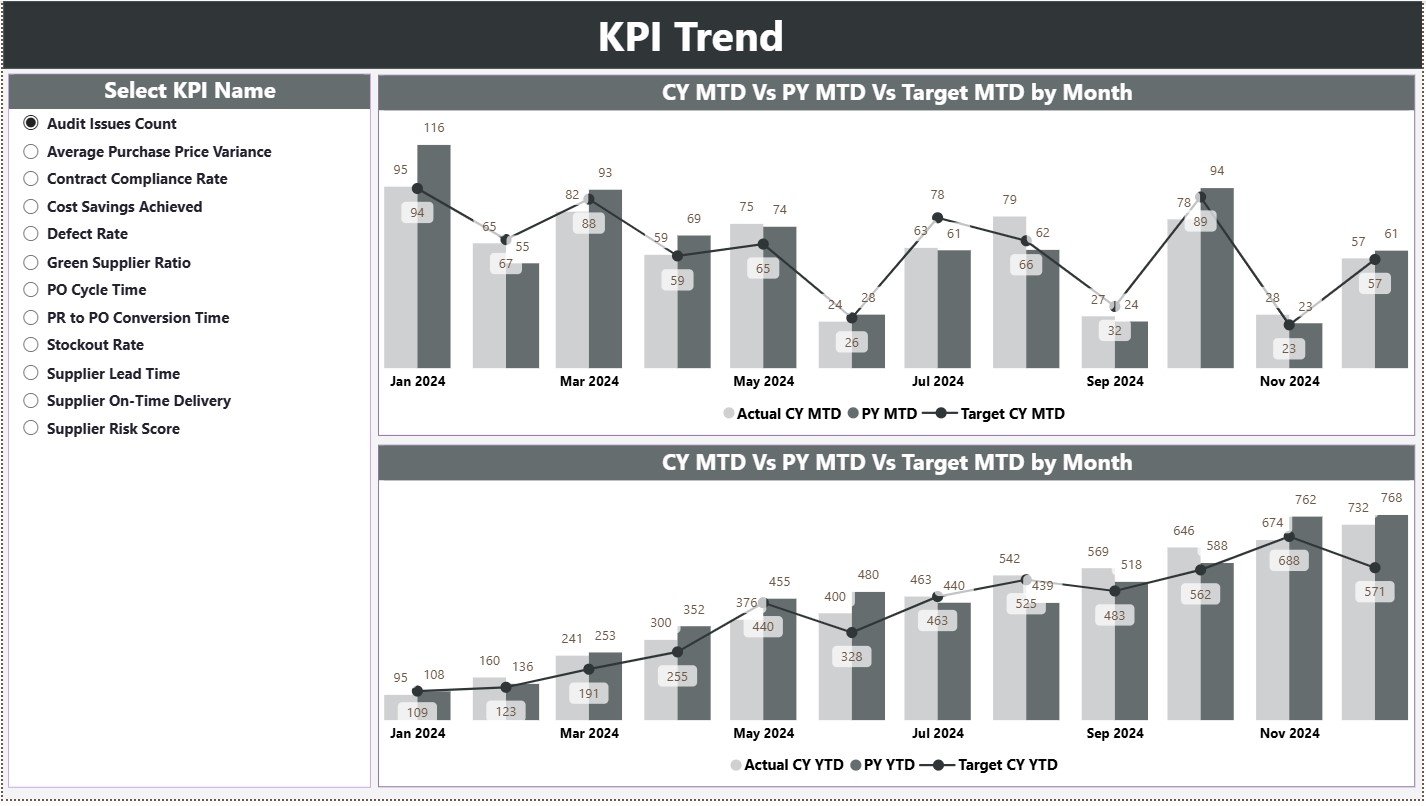
📈 Trend Analysis Charts – Compare current year, previous year, and targets visually
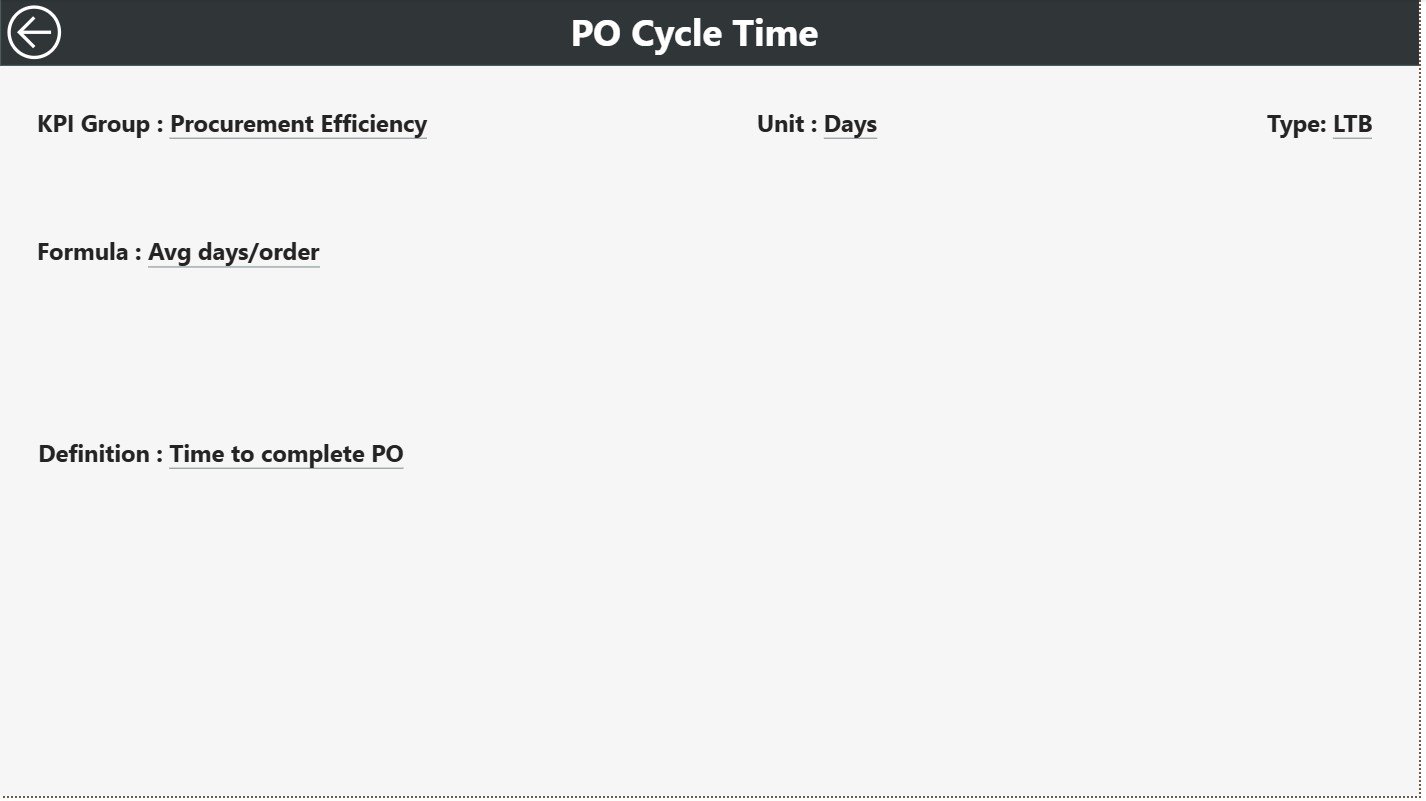
🔍 Drill-Through KPI Definitions – View KPI formulas and logic with one click
📁 Excel-Based Data Input – Simple Excel sheets for actuals, targets, and definitions
🧭 User-Friendly Navigation – Clean layout with smooth back-button navigation
📦 What’s Inside the Procurement Analytics KPI Dashboard
This Power BI dashboard includes three structured analytical pages, designed for clarity and depth:
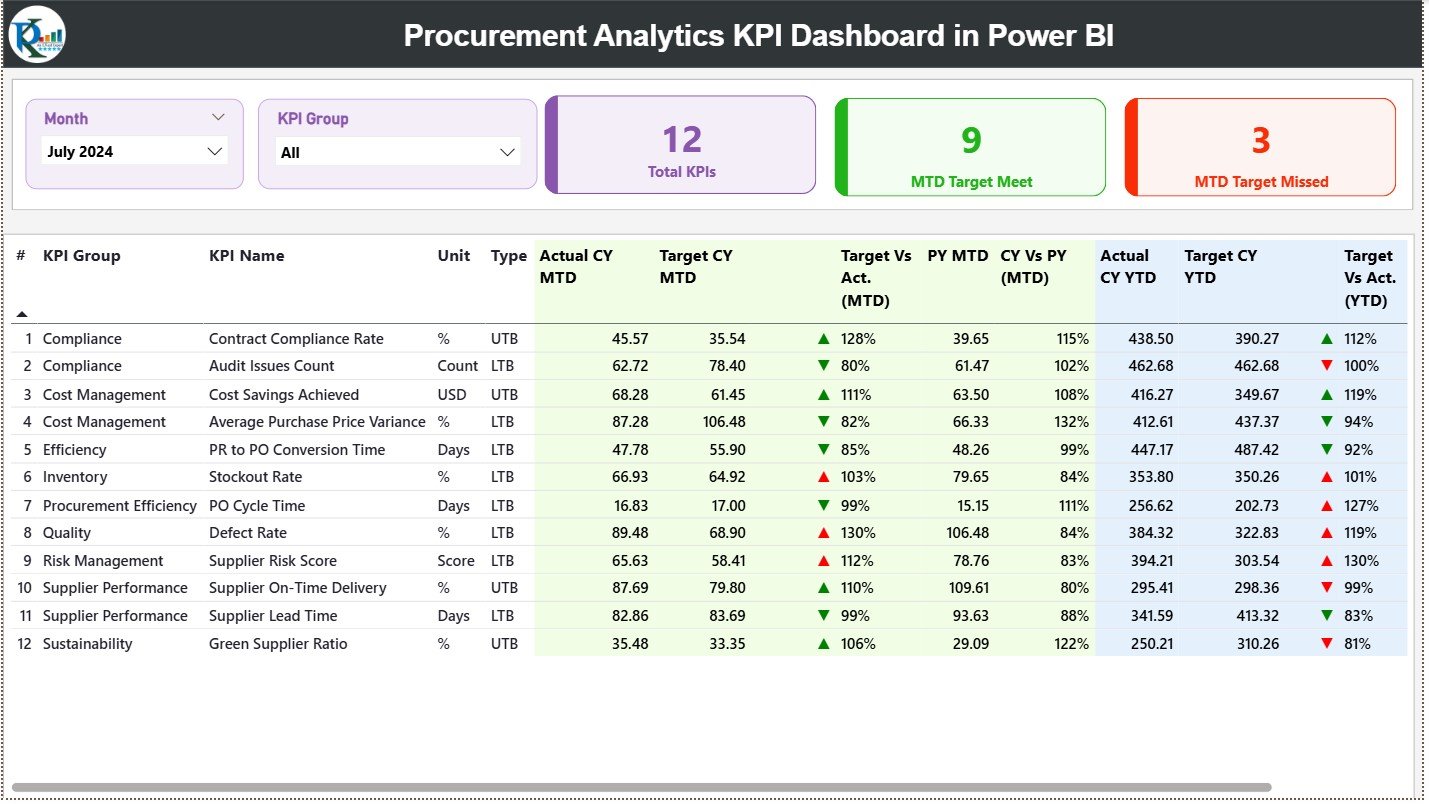
🟢 Summary Page
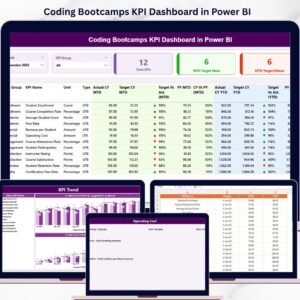
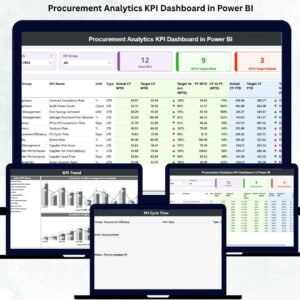
The control center of procurement performance. It displays KPI cards for Total KPIs, MTD Target Met, and MTD Target Missed. A detailed KPI table shows MTD and YTD actuals, targets, previous-year values, and performance ratios.
📉 KPI Trend Page
Focus on performance patterns over time. Select any KPI and instantly view MTD and YTD trend charts comparing targets, current year, and previous year values. This page helps detect trends, seasonality, and early warning signs.
📘 KPI Definition Page
A hidden drill-through page that ensures complete transparency. It displays KPI formulas, definitions, units, and measurement logic so teams align clearly on what each KPI represents.
Supporting this dashboard are three structured Excel files:
Input_Actual – Monthly MTD and YTD actual values
Input_Target – Monthly MTD and YTD target values
KPI Definition – KPI metadata, logic, and grouping
🛠️ How to Use the Procurement Analytics KPI Dashboard
✅ Step 1: Enter procurement actual values in the Excel Input Actual sheet
✅ Step 2: Update targets in Input Target
✅ Step 3: Define or modify KPIs using the KPI Definition sheet
✅ Step 4: Refresh the Power BI dashboard
✅ Step 5: Use slicers, cards, tables, and charts to analyze performance
No advanced Power BI skills are required. The dashboard is designed for plug-and-play usage.
👥 Who Can Benefit from This Procurement Analytics Dashboard?
🎯 Procurement Managers
📊 Strategic Sourcing Teams
💰 Finance & Cost Controllers
🏭 Operations Leaders
🚚 Supply Chain Professionals
📉 Business Analysts
Any team that wants data-driven procurement decisions will benefit instantly from this dashboard.
🔗 Click here to read the Detailed blog post
🎥 Visit our YouTube channel to learn step-by-step video tutorials
Watch the step-by-step video tutorial:
Compatibility and Requirements
- Works in Power BI Desktop, which is free to download from Microsoft.
- You enter actuals, targets and KPI definitions in three Excel files (Input_Actual, Input_Target and KPI Definition), then refresh the dashboard.
- Microsoft explains the download and setup in Get Power BI Desktop.
Frequently Asked Questions
Which pages does the dashboard have?
Three pages: Summary, KPI Trend and KPI Definition. The KPI Definition page is a hidden drill-through page.
Where do I enter my procurement data?
In the Excel files. Input_Actual holds the monthly MTD and YTD actual values, Input_Target holds the MTD and YTD targets, and the KPI Definition file holds each KPI’s logic and grouping.
Can I compare this year with last year?
Yes. The Summary page table shows MTD and YTD actuals, targets and previous-year values, and the KPI Trend page charts the current year, previous year and target together.
How do I see how a KPI is calculated?
Drill through to the KPI Definition page. It shows the KPI formula, definition, unit and measurement logic.
Is there an Excel version?
Yes. See the Procurement Analytics KPI Dashboard in Excel.
Related Procurement Templates
- Procurement Analytics KPI Dashboard in Excel: the same KPI dashboard in Excel
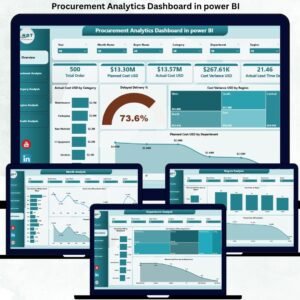
- Procurement Analytics Dashboard in Power BI: another Power BI procurement view
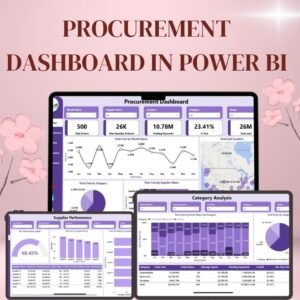
- Procurement Dashboard in Power BI: a general procurement dashboard
- Procurement KPI Dashboard in Google Sheets: procurement KPIs in Google Sheets
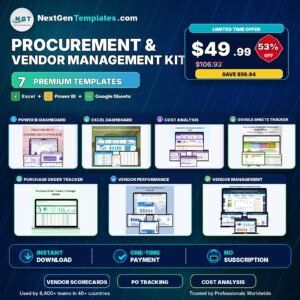
- Procurement and Vendor Management Kit: 7 procurement templates in one download
Browse all Power BI KPI dashboards.
























Reviews
There are no reviews yet.