


Running a photography business means juggling multiple tasks — managing bookings, tracking payments, analyzing revenue, and keeping clients happy. The Photography Dashboard in Excel is your all-in-one solution to simplify these operations effortlessly. Whether you’re a freelance photographer, a studio owner, or a creative agency, this Excel-based dashboard helps you organize data, measure success, and make smarter business decisions — all without coding or complex software.
✨ Key Features of Photography Dashboard in Excel
✅ All-in-One Data Management
Monitor bookings, payments, editing progress, and customer satisfaction from a single dashboard.
📊 Dynamic Visual Analytics
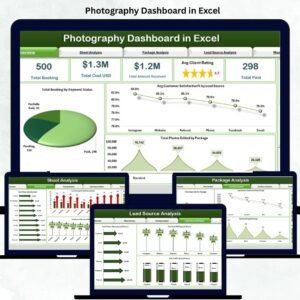
Interactive charts and KPI cards show your business performance in real time — including Total Bookings, Total Cost, Amount Received, and Avg. Client Rating.
💰 Automated Financial Tracking
Instantly see pending payments, total revenue, and high-performing shoots with built-in formulas and visual indicators.
🎯 Smart Performance Monitoring
Compare month-to-date and year-to-date progress to make data-driven decisions effortlessly.
🖋️ Fully Customizable
Easily modify KPIs, colors, and visuals to match your brand or specific photography niche.
💻 No Coding Required
Just enter your data, refresh the dashboard, and enjoy instant results.

📦 What’s Inside the Photography Dashboard in Excel
🗂️ Overview Sheet Tab:
Your central hub displaying KPIs like Total Bookings, Total Cost, Amount Received, Avg. Client Rating, and Total Paid. Includes charts such as:
-
Total Bookings by Payment Status
-
Average Client Satisfaction by Lead Source
-
Total Photos Edited by Package
📸 Shoot Analysis Sheet:
Analyze each photography shoot with charts for:
-
Total Photos Edited by Shoot
-
Pending vs Paid by Shoot
-
Total Amount Received (USD) by Shoot
📦 Package Analysis Sheet:
Compare profitability and satisfaction across different packages. Charts include:
-
Total Cost by Package
-
Avg. Customer Satisfaction by Package
-
Total Bookings by Package
🌐 Lead Source Analysis Sheet:
Understand which channels (Instagram, referrals, website) bring in the best results. Charts include:
-
Total Photos Taken by Lead Source
-
Total Cost by Lead Source
-
Total Paid (%) by Lead Source
📅 Monthly Trends Sheet:
Discover patterns with charts showing:
-
Avg. Customer Satisfaction by Month
-
Total Pending vs Paid by Month
-
Total Cost by Month
🧭 How to Use the Photography Dashboard in Excel
1️⃣ Enter Your Data:
Add booking details, payments, and client feedback regularly to maintain accuracy.
2️⃣ Use Filters & Slicers:
Drill down by month, lead source, or package type to gain deeper insights.
3️⃣ Review Monthly Trends:
Identify your best-performing months and client sources.
4️⃣ Monitor Financial Health:
Quickly track pending payments, total revenue, and cost efficiency.
5️⃣ Customize KPIs:
Add new metrics like “Editing Turnaround Time” or “Referral Rate” for a personalized experience.
6️⃣ Visual Optimization:
Use conditional formatting for quick color-coded insights (green = success, red = concern).
👥 Who Can Benefit from This Photography Dashboard
📷 Freelance Photographers:
Track income, client satisfaction, and project workload in one simple file.
🏢 Photography Studios:
Monitor team performance, package profitability, and payment statuses easily.
🎨 Creative Agencies:
Evaluate lead sources, marketing ROI, and client happiness in real time.
💼 Corporate/Event Photographers:
Streamline client reporting, manage large projects, and maintain data transparency.
💡 Beginners & Professionals Alike:
No advanced Excel skills needed — perfect for anyone looking to grow their photography business efficiently.
🔗 Click here to read the Detailed blog post
Watch the step-by-step video tutorial:


Reviews
There are no reviews yet.