Key Features of Online Universities KPI Dashboard
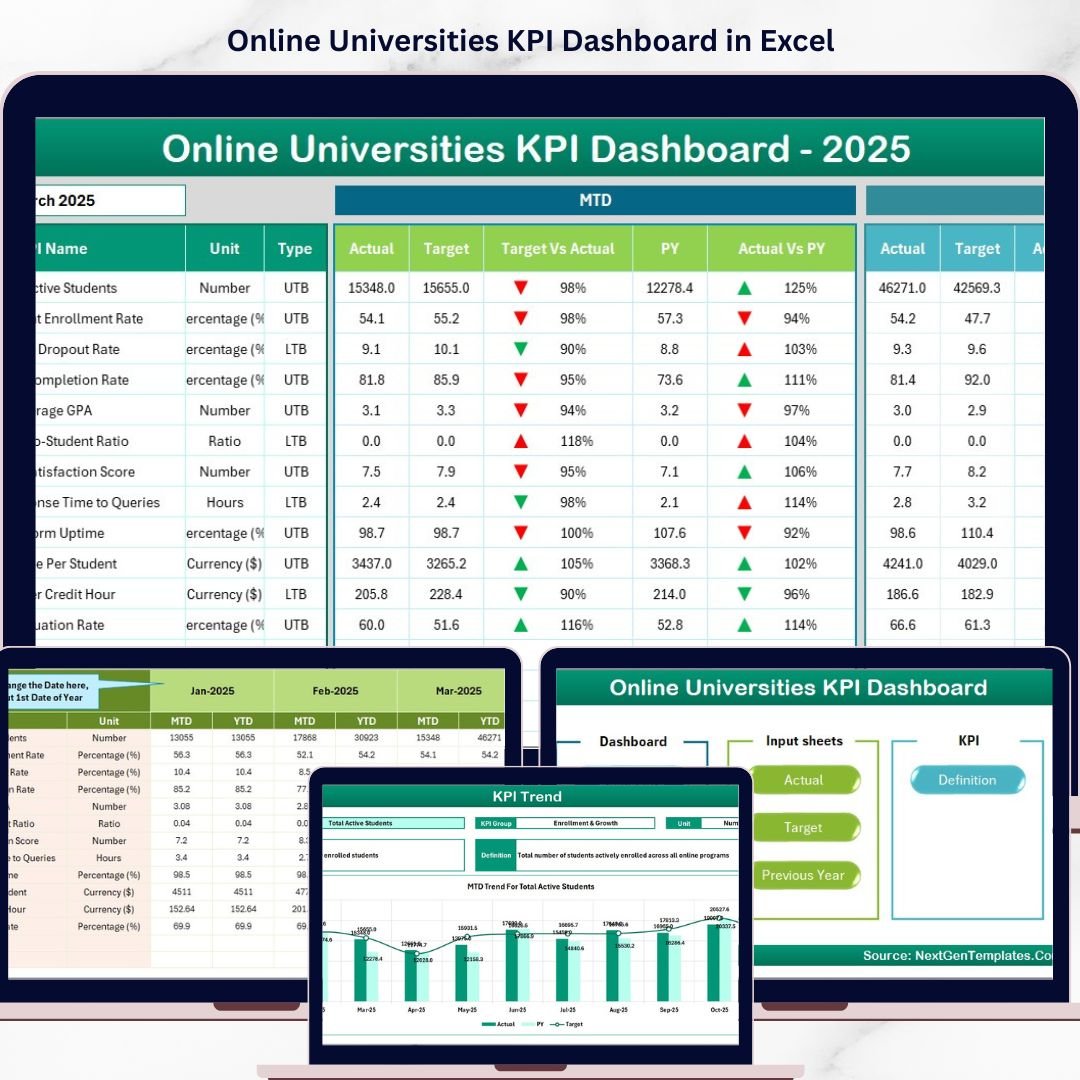
Introducing the Online Universities KPI Dashboard – a comprehensive, easy-to-use digital tool designed to empower educational institutions with insightful performance metrics. This dashboard consolidates vital KPIs into a visually intuitive platform, enabling universities to monitor, analyze, and optimize their operational and academic outcomes efficiently.
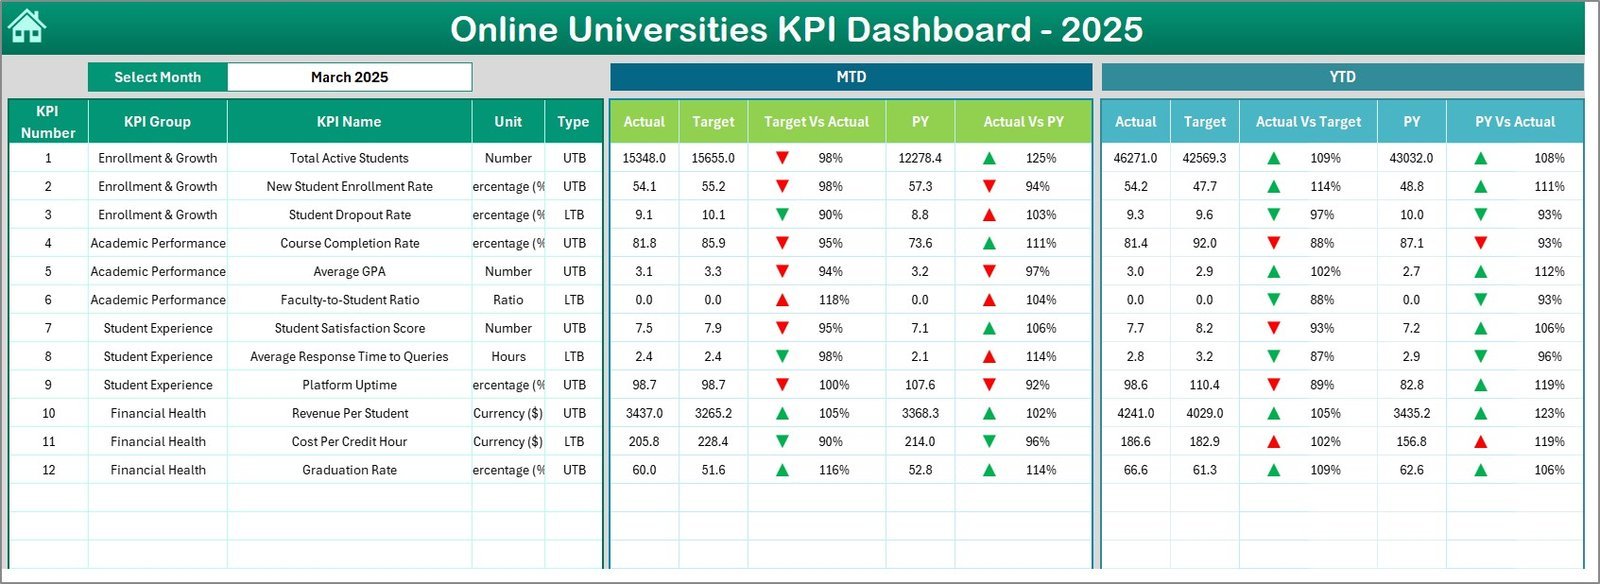
With 7 dedicated worksheets, this dashboard covers every essential aspect of university performance tracking. The Home sheet acts as a central hub with six navigational buttons for seamless access to different sections. The Dashboard sheet provides a dynamic view of monthly and yearly KPI data, complete with conditional formatting like up/down arrows to highlight performance trends, comparing Actuals, Targets, and Previous Year (PY) data.
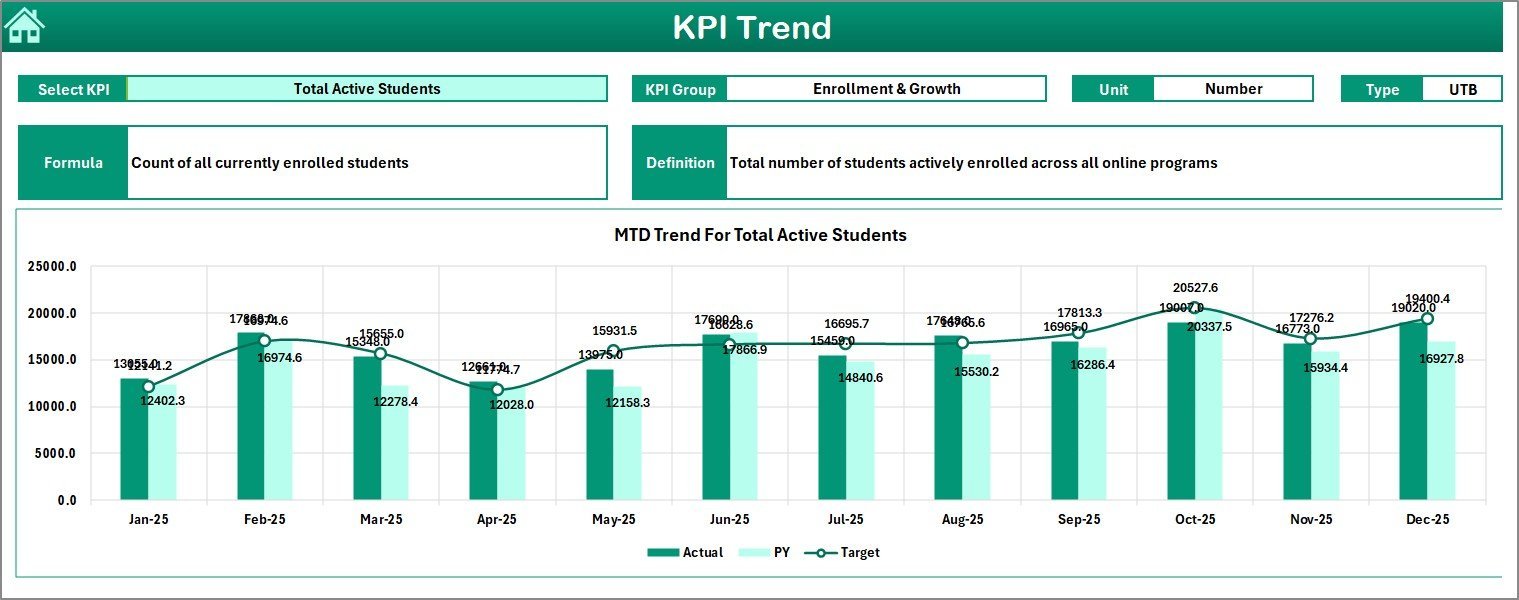
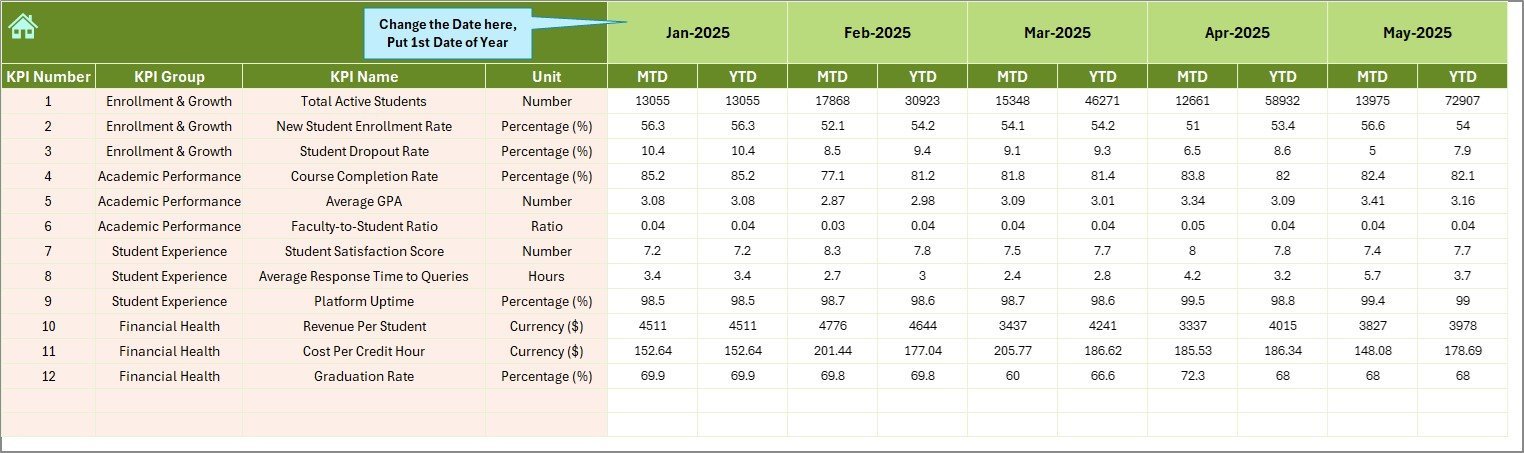
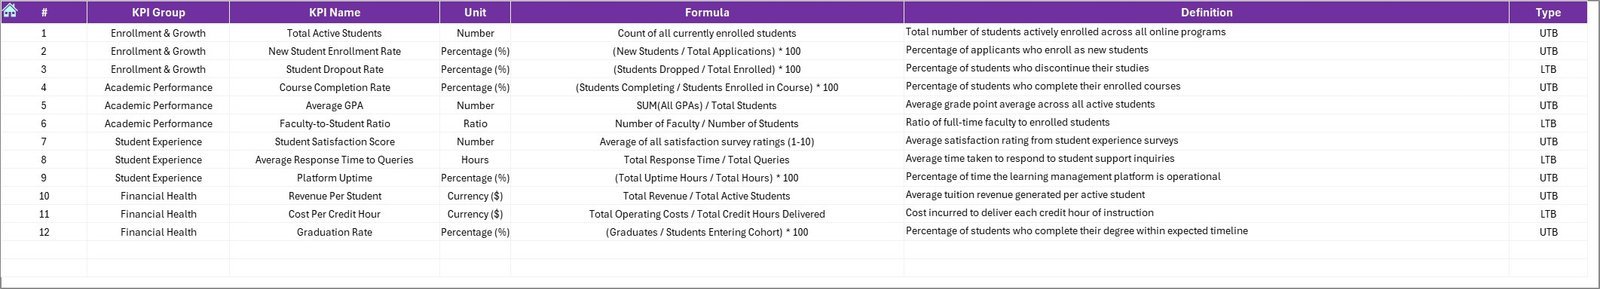
The KPI Trend sheet offers deep insights with trend charts for month-to-date (MTD) and year-to-date (YTD) figures, allowing users to select specific KPIs and view their performance patterns. Data inputs are streamlined via the Actual Numbers Input, Target Number Input, and Previous Year Number sheets, where users can enter or update KPI values effortlessly. Lastly, the KPI Definition sheet provides clarity by defining KPI names, groups, units, formulas, and performance types (Lower the Better or Upper the Better).
What’s Inside the Online Universities KPI Dashboard
- 🏠 Home Sheet: Central navigation with quick access buttons to all dashboard sections.
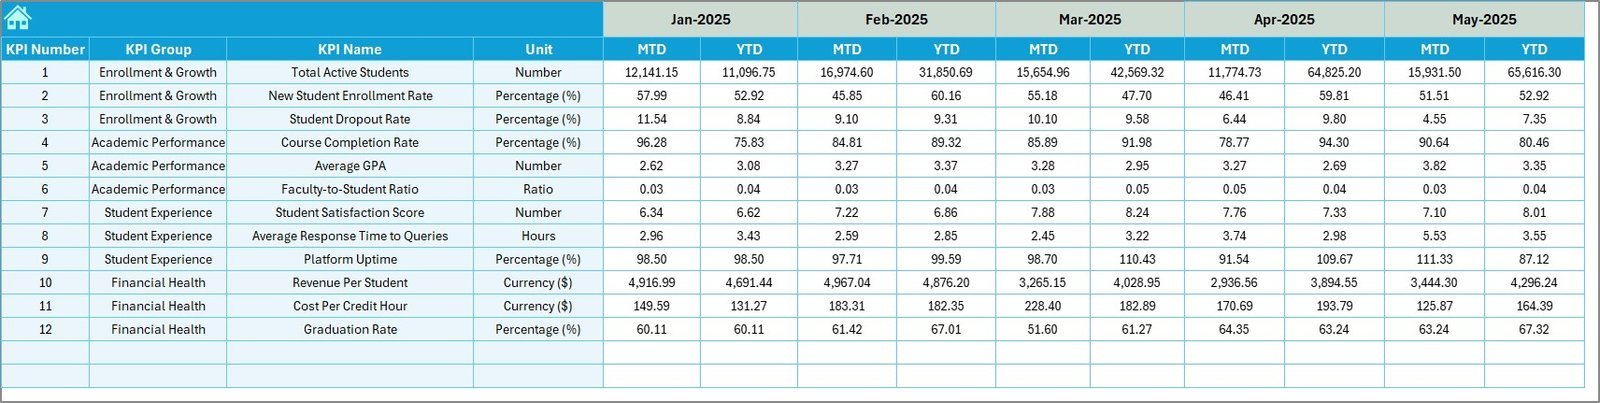
- 📊 Dashboard Sheet: Main overview with dynamic Monthly and Yearly KPI data, including Actual, Target, and Previous Year comparisons with visual cues.
- 📈 KPI Trend Sheet: Interactive trend charts for selected KPIs showing MTD and YTD performance.
- ✍️ Actual Numbers Input Sheet: User-friendly input for monthly and yearly actual KPI values.
- 🎯 Target Number Input Sheet: Easy entry of monthly and yearly KPI targets to track goal attainment.
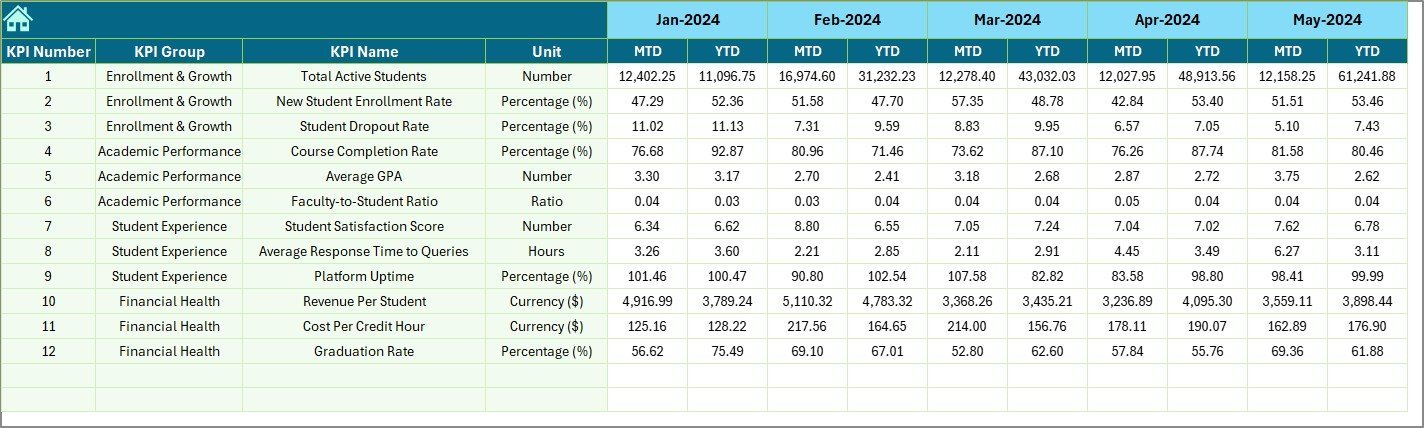
- 📆 Previous Year Number Sheet: Input historical KPI data for accurate year-over-year comparisons.
- 📚 KPI Definition Sheet: Comprehensive KPI descriptions, formulas, and performance type indicators.
How to Use the Online Universities KPI Dashboard
Getting started with the Online Universities KPI Dashboard is straightforward and requires no advanced technical skills. First, navigate using the Home sheet’s intuitive buttons to access the section you want to work on. Begin by entering your institution’s actual KPI data in the Actual Numbers Input sheet, selecting the relevant months to ensure accurate month-to-date and year-to-date tracking.
Next, populate the Target Number Input sheet with your institution’s goals for each KPI. Input the previous year’s figures in the Previous Year Number sheet to enable comparative analysis. Use the KPI Definition sheet to understand the nature and calculation of each KPI to ensure data consistency.
Return to the Dashboard sheet to view performance summaries, where you can select any month from the dropdown to dynamically update all KPI data and visualize progress with clear conditional formatting arrows indicating performance against targets and prior year results. Dive deeper into trends via the KPI Trend sheet by selecting specific KPIs to analyze their historical performance patterns through interactive charts.
Who Can Benefit from This Online Universities KPI Dashboard
🎓 University Administrators: Monitor strategic objectives and operational KPIs to drive institutional success.
📋 Academic Departments: Track departmental performance metrics and improve academic outcomes.
📊 Data Analysts: Access organized data sets for in-depth analysis and reporting.
💼 Management Teams: Make informed, data-driven decisions to optimize resources and enhance student experience.
🧑💻 Consultants & Auditors: Evaluate university performance comprehensively with clear visualizations and data inputs.
💡 Policy Makers: Analyze KPI trends to shape educational policies and funding strategies.
Click here to read the Detailed blog post.
Visit our YouTube channel to learn step-by-step video tutorials


Reviews
There are no reviews yet.