The rise of digital education has reshaped how the world learns 🌍. From virtual classrooms to global e-learning platforms, educators and organizations now rely on technology to teach, track, and improve performance. But managing growth and measuring success can be challenging without a proper system in place.
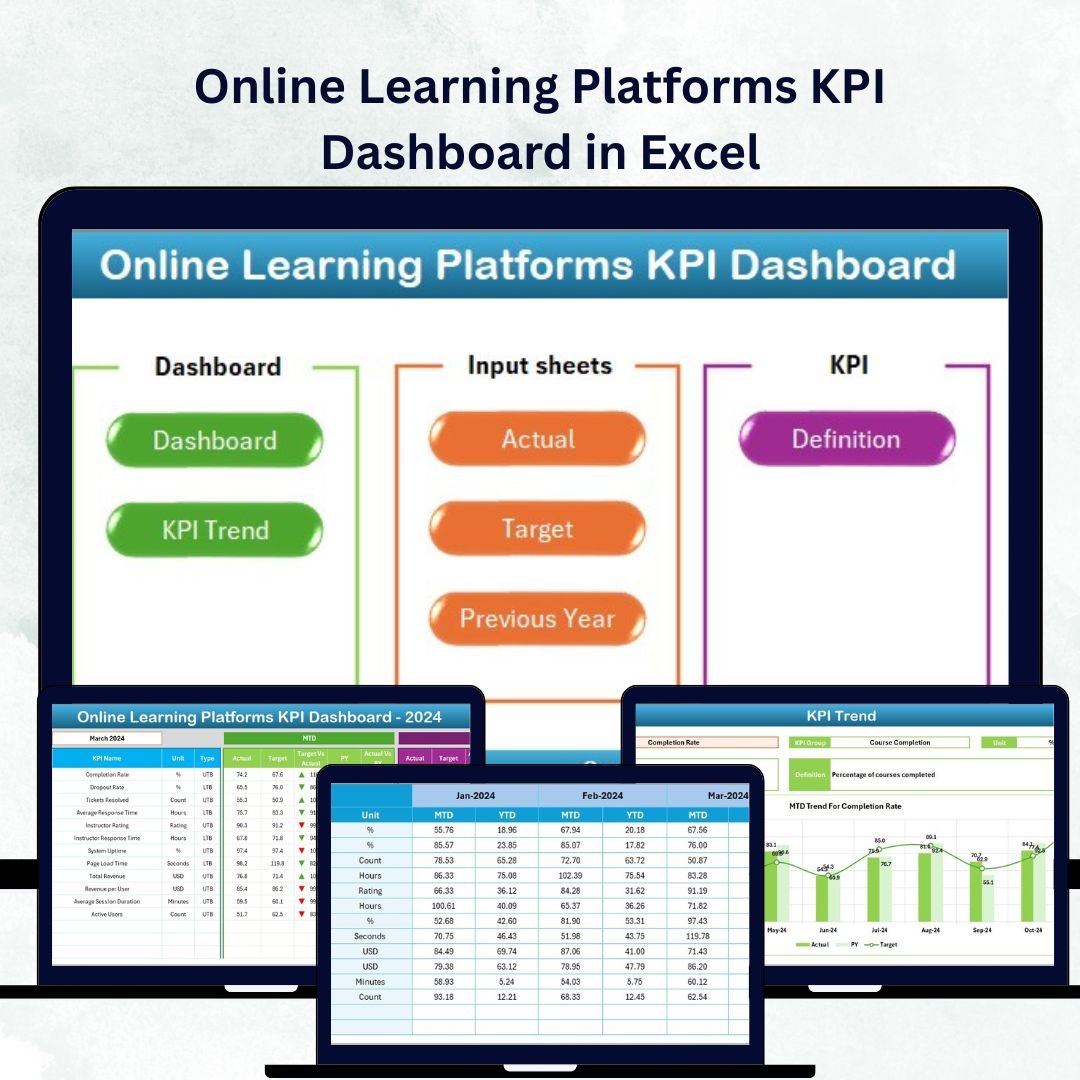
That’s where the Online Learning Platforms KPI Dashboard in Excel comes in — a ready-to-use, data-driven, and fully customizable Excel template designed to help you monitor, analyze, and improve e-learning performance across key areas like student engagement, course effectiveness, and financial outcomes.
Built entirely in Microsoft Excel, this dashboard transforms raw data into clear, interactive visuals that provide instant insights — no coding or complex tools required!
⚙️ Key Features of the Online Learning Platforms KPI Dashboard in Excel
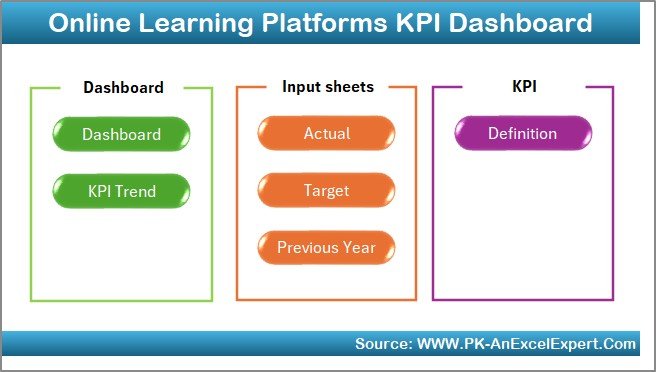
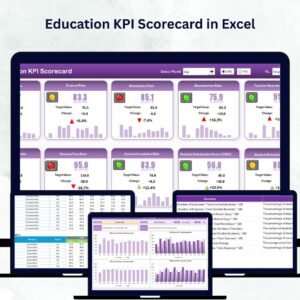
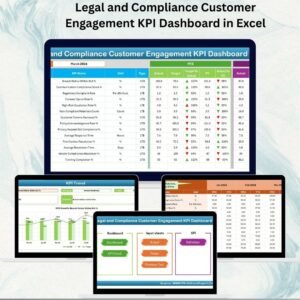
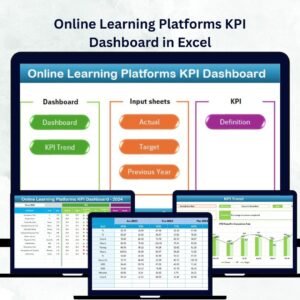
📊 7 Smartly Designed Sheets – Home, Dashboard, KPI Trend, Actual Data, Targets, Previous Year, and KPI Definition.
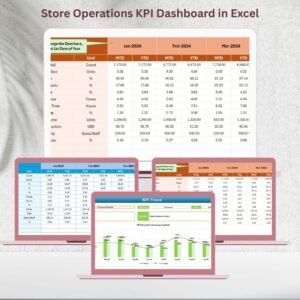
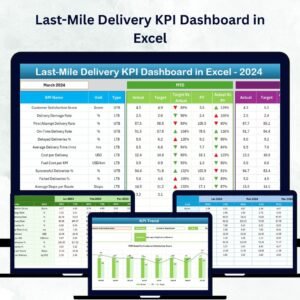
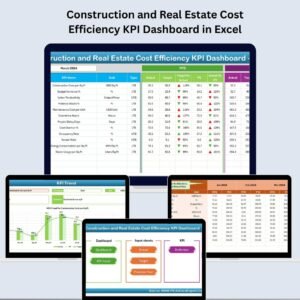
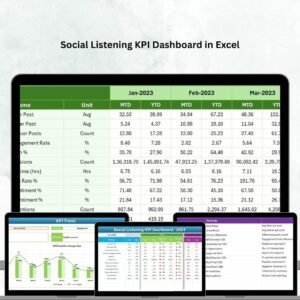
🎯 Month-to-Date (MTD) & Year-to-Date (YTD) Tracking – Instantly view current and cumulative performance.
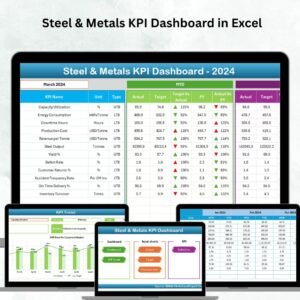
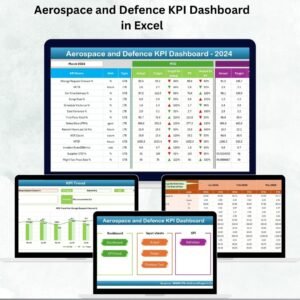
🟢 Visual Indicators & Arrows – Quickly identify KPIs that are meeting or missing targets.
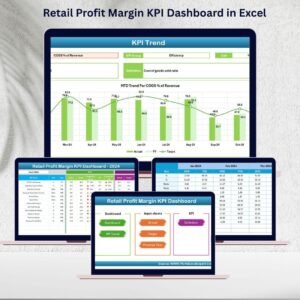
📈 Dynamic Charts – Monitor Actual, Target, and Previous Year trends with real-time updates.
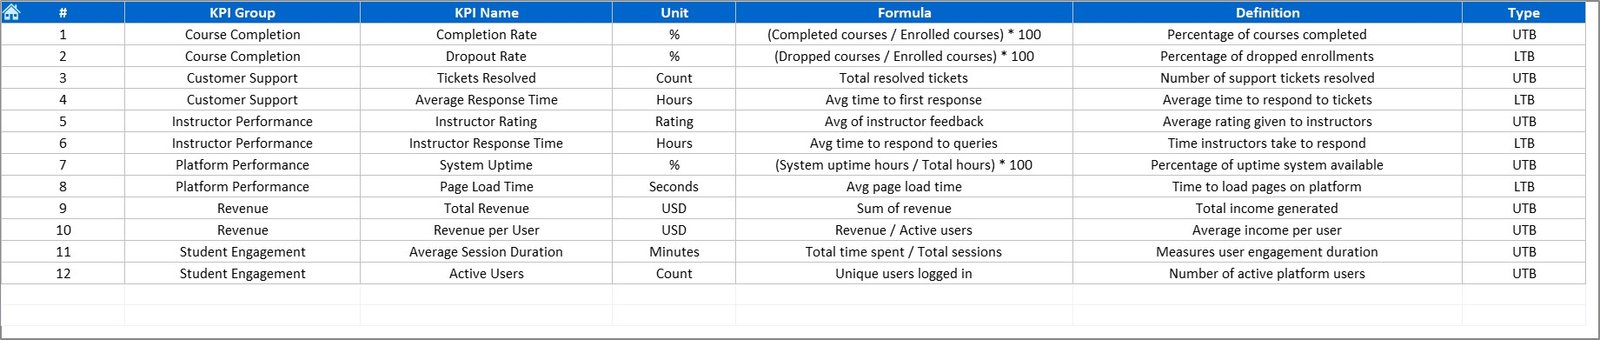
📘 Comprehensive KPI Library – Each KPI includes its unit, formula, and definition.
💡 No Technical Skills Needed – Fully automated using Excel formulas.
💰 Cost-Effective – Replace expensive BI software with a powerful Excel-based solution.
☁️ Cloud-Ready – Works perfectly with OneDrive, Google Drive, or SharePoint for team access.
📦 What’s Inside the Dashboard
1️⃣ Home Sheet – Easy Navigation Hub
Navigate seamlessly across all sheets using interactive buttons — even first-time users can operate it effortlessly.
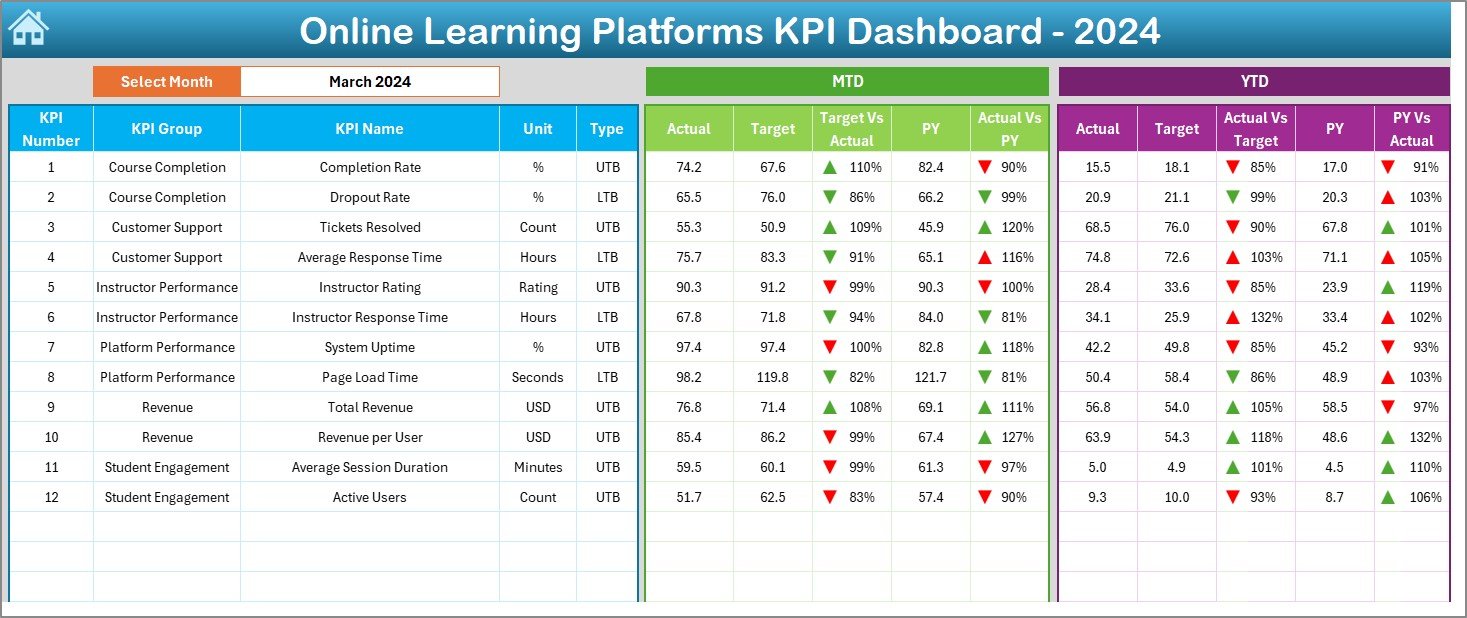
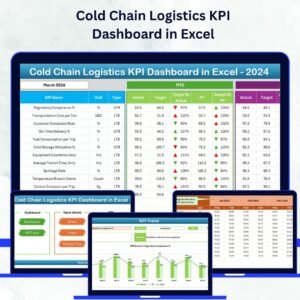
2️⃣ Dashboard Sheet – Central Performance View
The main dashboard where insights come to life.
-
Choose a month (cell D3) and see updated MTD and YTD results.
-
View Actual vs Target vs Previous Year data.
-
Instantly identify underperforming KPIs with red arrows or celebrate progress with green markers.
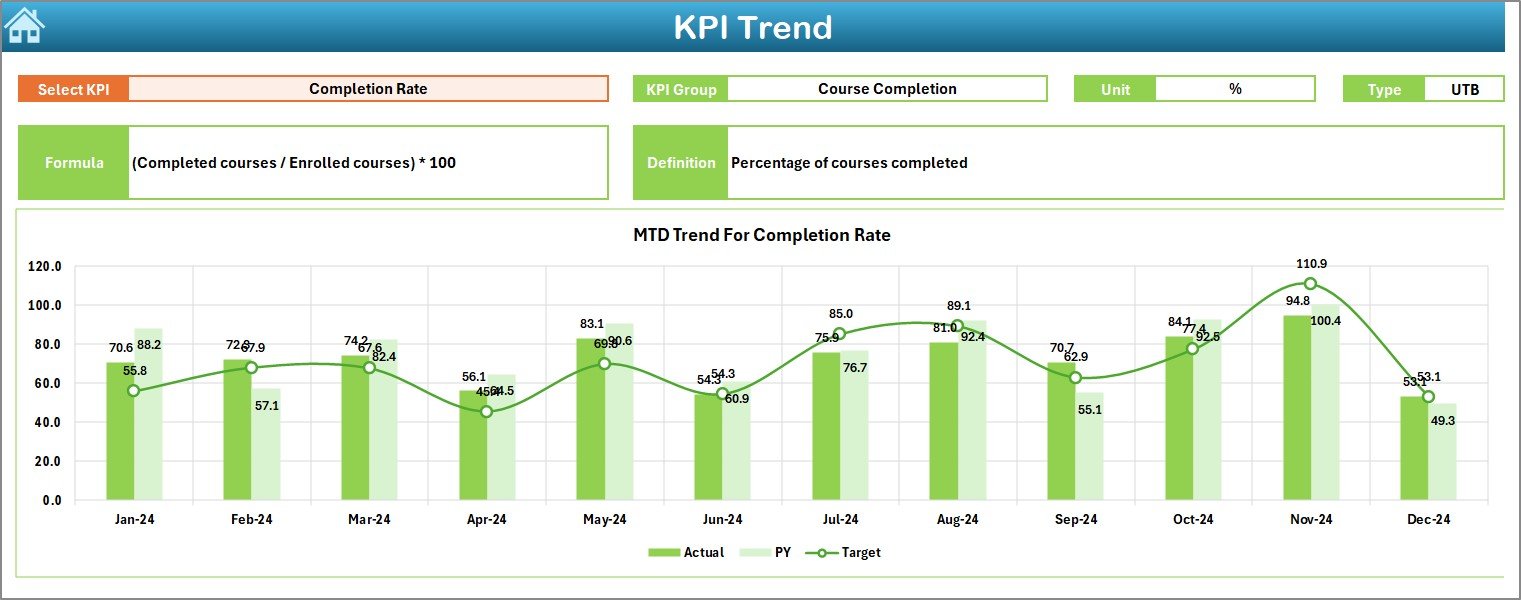
3️⃣ KPI Trend Sheet – Analyze Growth Over Time
Select any KPI (cell C3) to visualize long-term performance trends using MTD and YTD charts.
This view helps you spot emerging trends, growth patterns, and areas that need strategic focus.
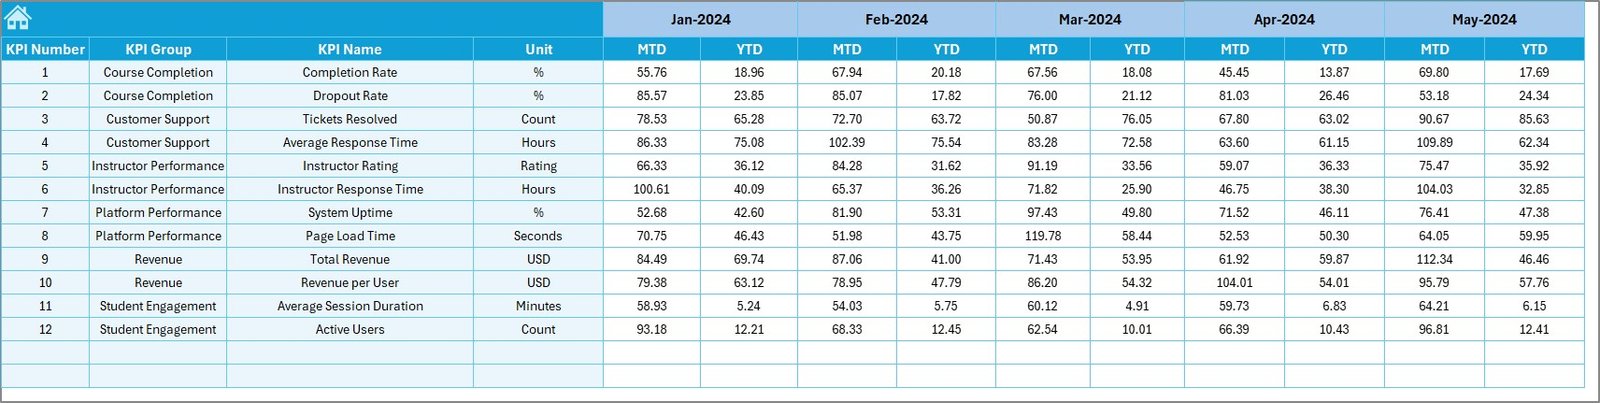
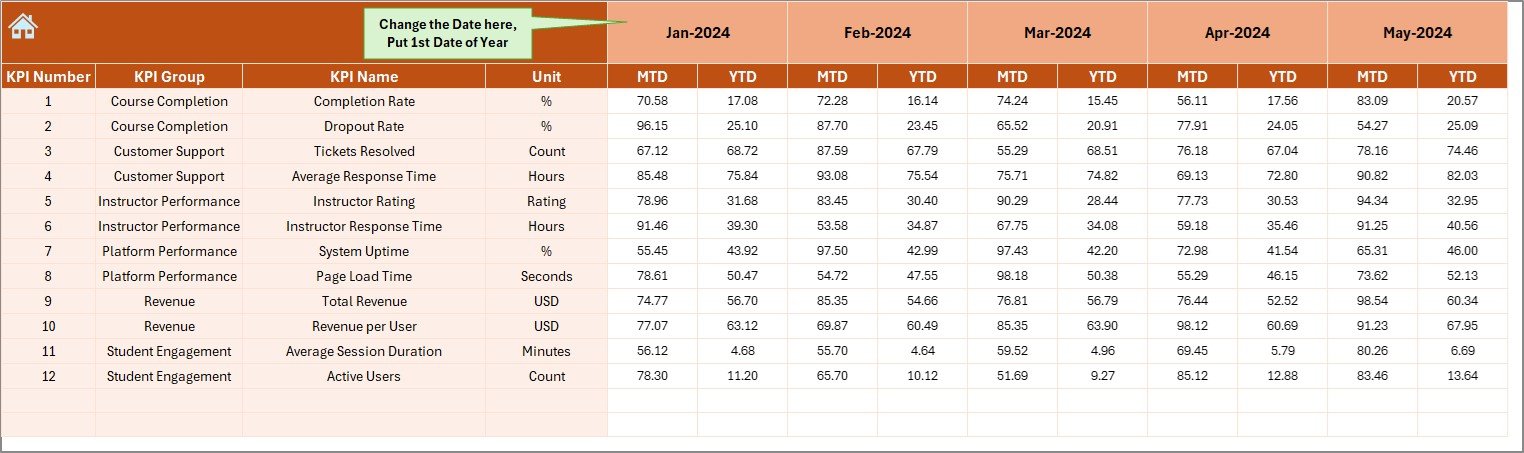
4️⃣ Actual Numbers Input Sheet – Data Backbone
Record monthly KPIs such as enrollment, engagement, revenue, and completion rates.
All data updates automatically across the workbook — saving hours of manual reporting.
5️⃣ Target Sheet – Define Success Benchmarks
Set monthly or yearly goals for metrics like student satisfaction, profit margins, or completion rates.
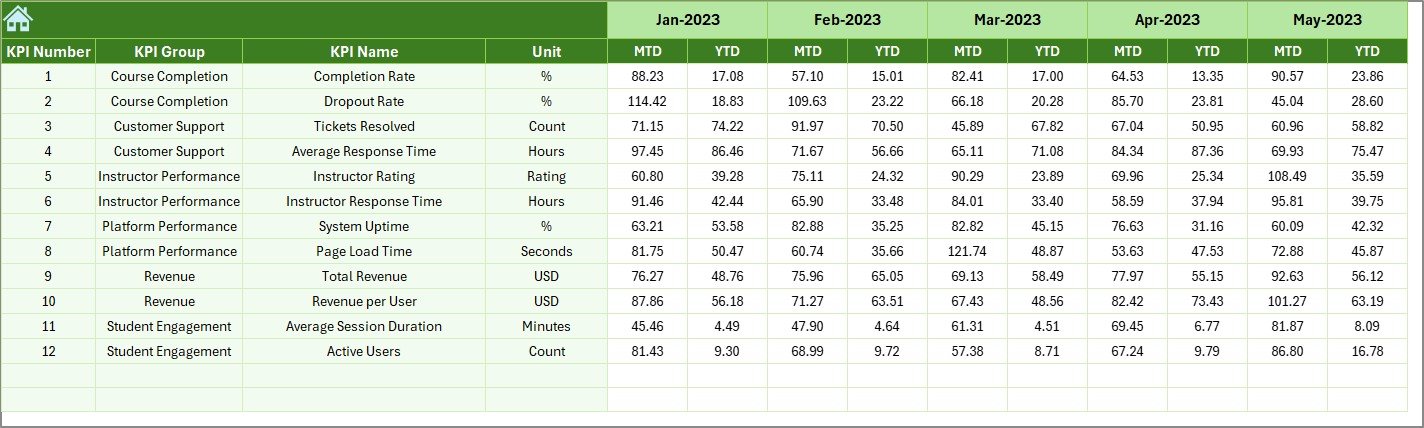
6️⃣ Previous Year Sheet – Historical Comparison
Compare current performance with last year’s data to assess growth, consistency, and retention.
7️⃣ KPI Definition Sheet – The Knowledge Base
Every KPI is clearly defined with its group, formula, and purpose — ensuring accuracy and alignment across departments.
🎓 Common KPIs in Online Learning Platforms
📘 Student & Course KPIs
-
Total Enrollments
-
Course Completion Rate (%)
-
Certification Rate (%)
-
Dropout Rate (%)
-
Student Satisfaction Score
💡 Engagement KPIs
-
Average Session Duration
-
Lesson Completion per User
-
Daily Active Users (DAU)
-
Monthly Active Users (MAU)
💰 Financial KPIs
-
Revenue per Course
-
Subscription Retention Rate
-
Cost per Enrollment
-
Refund Rate (%)
⚙️ Platform Performance KPIs
-
Server Uptime (%)
-
Page Load Time
-
Technical Error Rate
👩🏫 Instructor & Content KPIs
-
Instructor Response Time
-
Average Instructor Rating
-
New Course Launches per Month
These KPIs can be tailored to match your platform’s unique focus — whether it’s education quality, profitability, or engagement.
🧭 How to Use the Dashboard
1️⃣ Input actual monthly data in the Input Sheet.
2️⃣ Record performance targets in the Target Sheet.
3️⃣ Add last year’s data for benchmarking.
4️⃣ Instantly view insights in the Dashboard Sheet with automated visuals and arrows.
5️⃣ Use the KPI Trend Sheet to analyze long-term progress.
No macros, no coding — just smart Excel automation designed for simplicity and accuracy.
🚀 Advantages of Using the Online Learning Platforms KPI Dashboard
✅ Centralized Analytics – Manage academic, engagement, and financial KPIs in one place.
✅ Instant Visualization – Conditional formatting and charts make data interpretation effortless.
✅ Real-Time Insights – See updated trends as soon as new data is entered.
✅ Time-Saving Automation – Eliminate repetitive reporting tasks.
✅ Scalable & Flexible – Add KPIs or modify structures to fit your platform’s evolution.
✅ Improved Decision-Making – Identify growth opportunities and fix weaknesses faster.
✅ Collaboration-Friendly – Easily share across teams via cloud platforms.
🧩 Best Practices for Using the Dashboard
-
🎯 Focus on key KPIs that align with your business strategy.
-
🔁 Update data monthly for accuracy and consistency.
-
🧮 Use Excel formulas like SUMIFS, AVERAGEIFS, and IFERROR to automate calculations.
-
🛡️ Protect formula cells to prevent unintentional changes.
-
📊 Review MTD/YTD performance and discuss in regular team meetings.
Follow these practices to make your KPI Dashboard your e-learning control center.


Reviews
There are no reviews yet.