Managing office tasks efficiently is no longer just about maintaining simple task lists. Modern offices handle multiple tasks across departments, locations, and individuals—each with different urgency levels, timelines, and budgets. When task data is scattered across emails, Excel sheets, or tools without analytics, teams lose visibility, tasks get delayed, and costs exceed plans. That is exactly why the Office Task Management Performance Dashboard in Google Sheets becomes a powerful and practical solution.
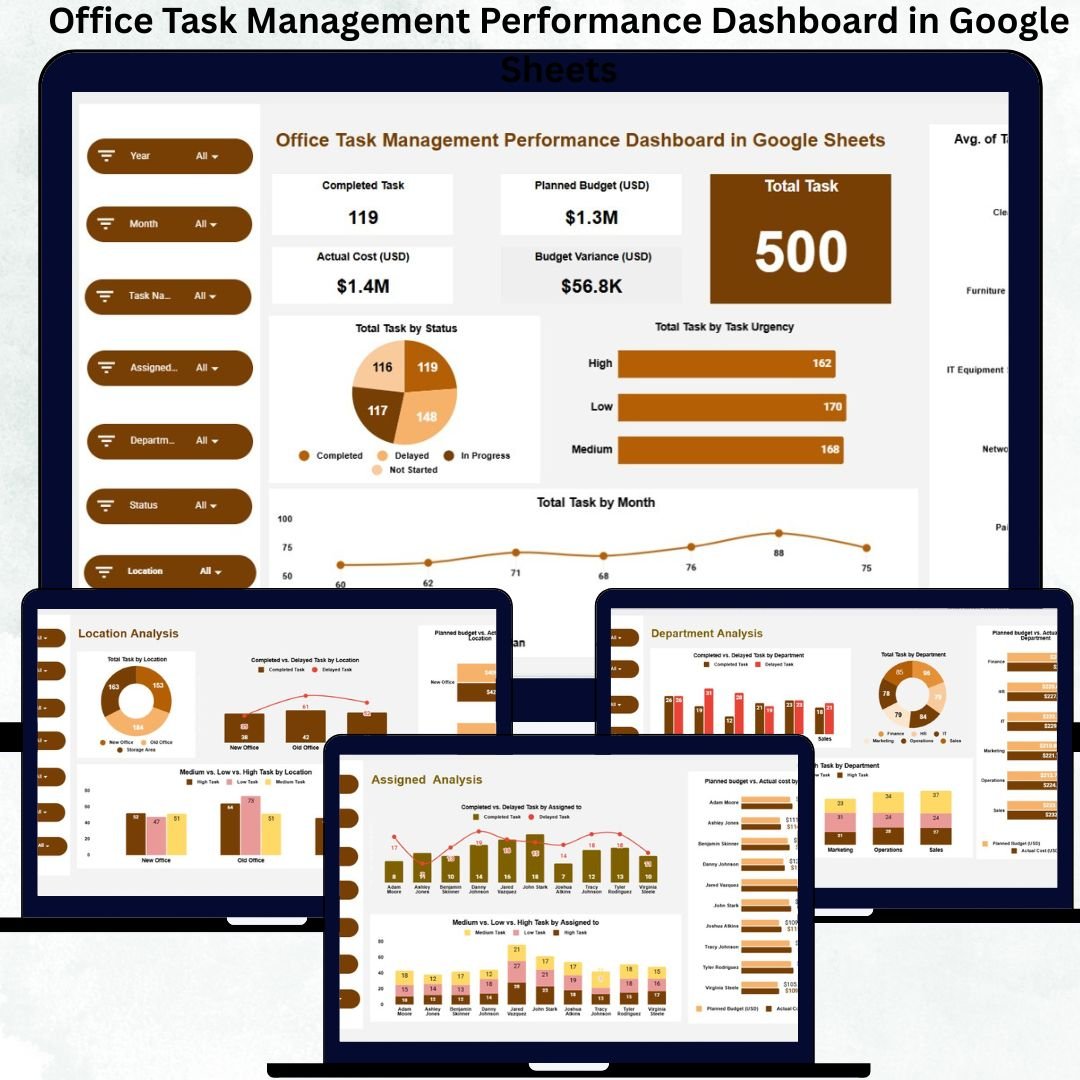
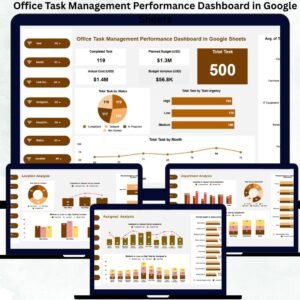
This ready-to-use dashboard transforms raw task data into real-time performance insights. It combines KPI cards, interactive charts, smart filters, and a search system into one centralized Google Sheets file. As a result, managers, team leaders, and operations teams gain complete control over task execution, cost monitoring, urgency management, and workload distribution—without investing in expensive task management software.
Because the dashboard is built in Google Sheets, it stays collaborative, easy to update, and accessible from anywhere.
🚀 Key Features of the Office Task Management Performance Dashboard
📊 KPI-Driven Performance Monitoring
Instantly track total tasks, completed tasks, planned budgets, actual costs, and budget variance using clear KPI cards.
⏱ Task Status & Urgency Tracking
Monitor completed, delayed, pending, and in-progress tasks, along with urgency levels (High, Medium, Low) across the organization.
💰 Budget & Cost Control
Compare planned budgets with actual task costs to quickly identify overspending and inefficiencies.
🏢 Multi-Dimensional Analysis
Analyze performance by department, location, assigned person, and task name—all within dedicated analysis sections.
🔍 Smart Search Functionality
Find any task instantly using keyword-based search without applying manual filters.
📦 What’s Inside the Office Task Management Performance Dashboard
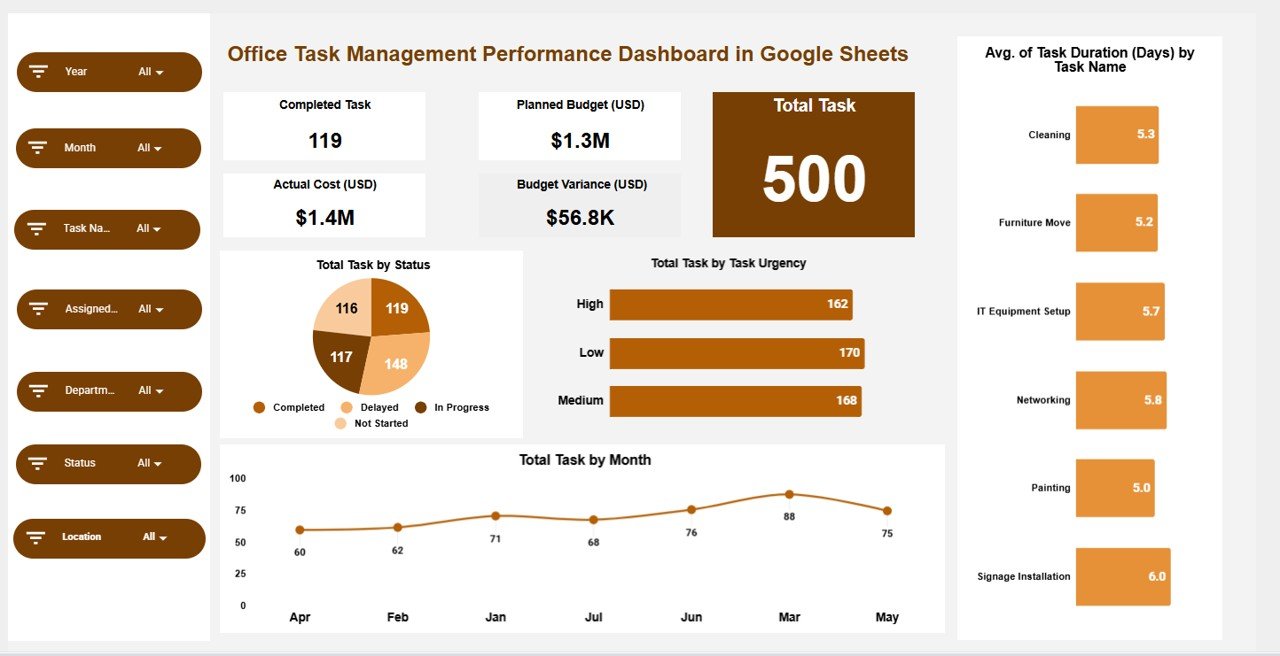
📌 Overview Sheet – Executive Performance Snapshot
The Overview sheet provides a quick summary of organizational task health.
Key KPI Cards
-
✅ Completed Task – Total completed tasks
-
📋 Total Task – Overall task volume
-
💰 Planned Budget (USD) – Approved task budget
-
💸 Actual Cost (USD) – Real spending
-
📉 Budget Variance (USD) – Cost difference
Overview Charts
-
📊 Total Task by Status
-
🚦 Total Task by Task Urgency
-
⏳ Average Task Duration (Days) by Task Name
-
📅 Total Task by Month
These visuals provide instant clarity on execution speed, urgency pressure, and monthly trends.
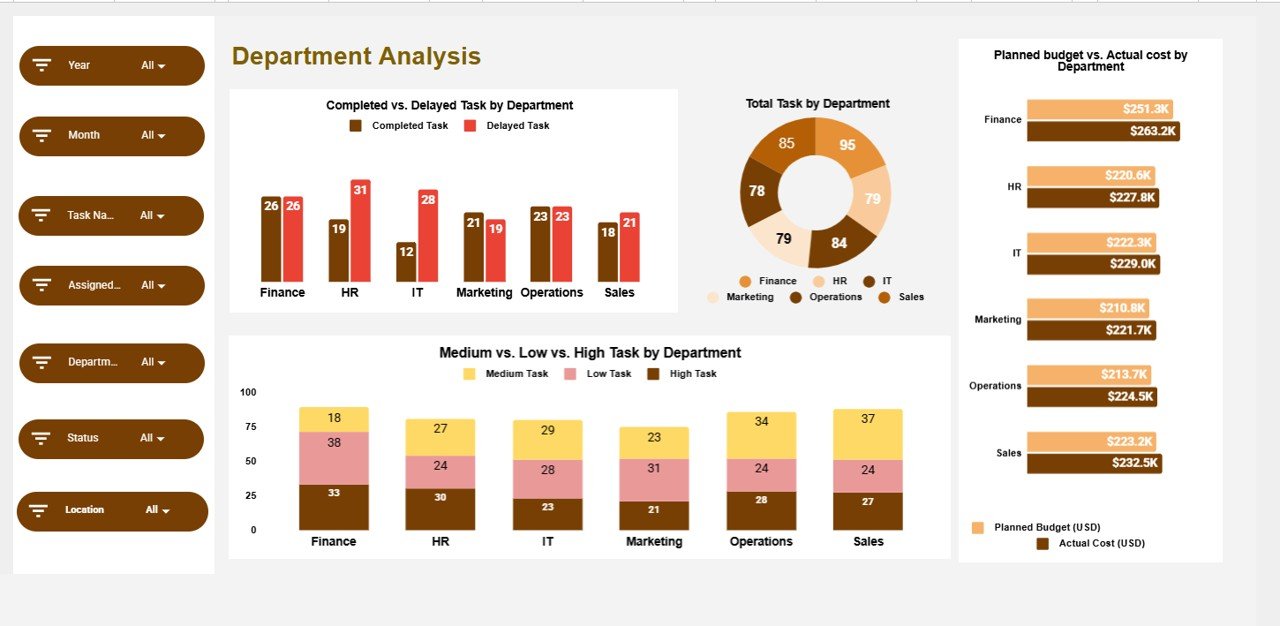
📂 Department Analysis – Performance by Department
This section highlights how individual departments perform.
Charts Included
-
✅ Completed vs Delayed Task by Department
-
📋 Total Task by Department
-
💰 Planned Budget vs Actual Cost by Department
-
🚦 High / Medium / Low Task by Department
Managers can quickly identify which departments need attention or additional resources.
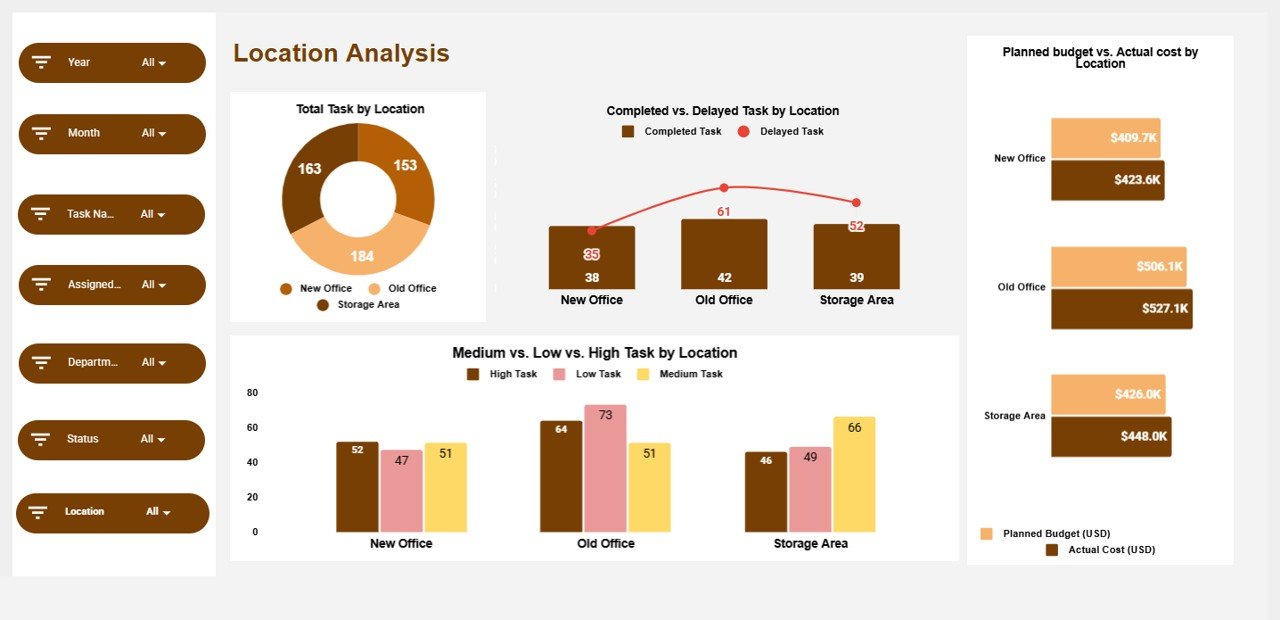
📍 Location Analysis – Performance by Location
Ideal for multi-branch or multi-office organizations.
Charts Included
-
📋 Total Task by Location
-
✅ Completed vs Delayed Task by Location
-
💰 Planned Budget vs Actual Cost by Location
-
🚦 Task Urgency by Location
This helps leadership control location-wise productivity and costs.
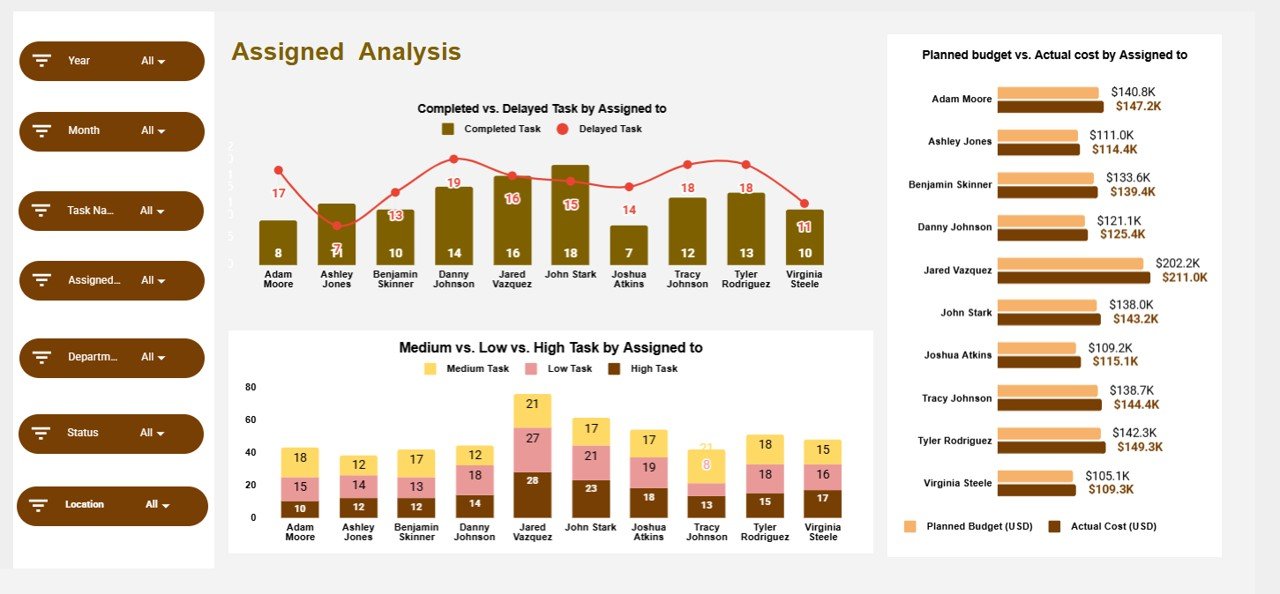
👤 Assigned Analysis – Performance by Employee
Track individual accountability and workload balance.
Charts Included
-
✅ Completed vs Delayed Task by Assigned To
-
💸 Planned Budget vs Actual Cost by Assigned To
-
🚦 Task Urgency by Assigned To
This section supports fair task distribution and prevents employee burnout.
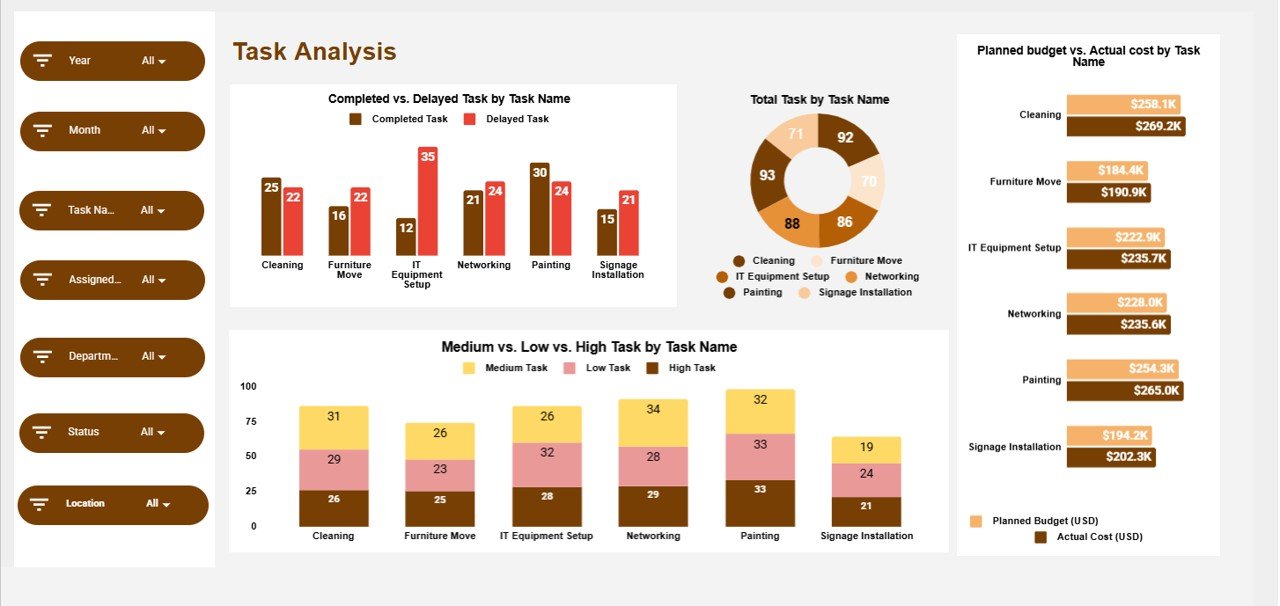
📝 Task Analysis – Performance by Task Name
Understand which tasks create delays or cost overruns.
Charts Included
-
✅ Completed vs Delayed Task by Task Name
-
📋 Total Task by Task Name
-
💰 Planned Budget vs Actual Cost by Task Name
-
🚦 Task Urgency by Task Name
Perfect for process improvement and task optimization.
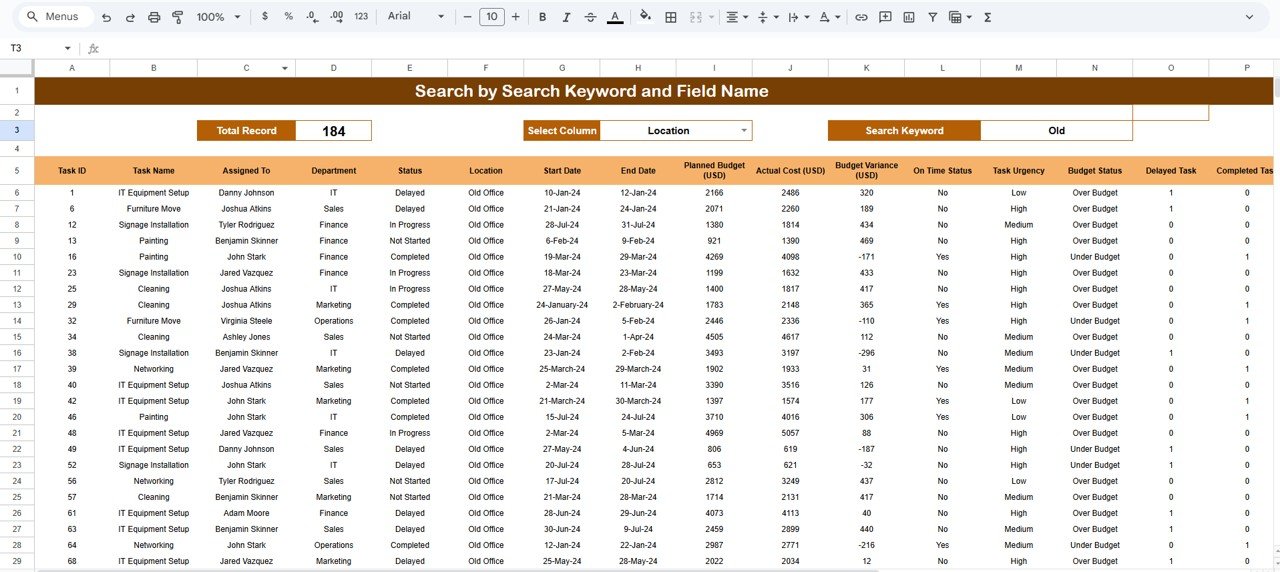
🔍 Search Functionality – Find Tasks Instantly
Use the Search panel to:
-
Enter a Search Keyword
-
Select a Field Name (Task Name, Department, Location, Assigned To, Status, etc.)
Matching tasks appear instantly—saving time during reviews and audits.
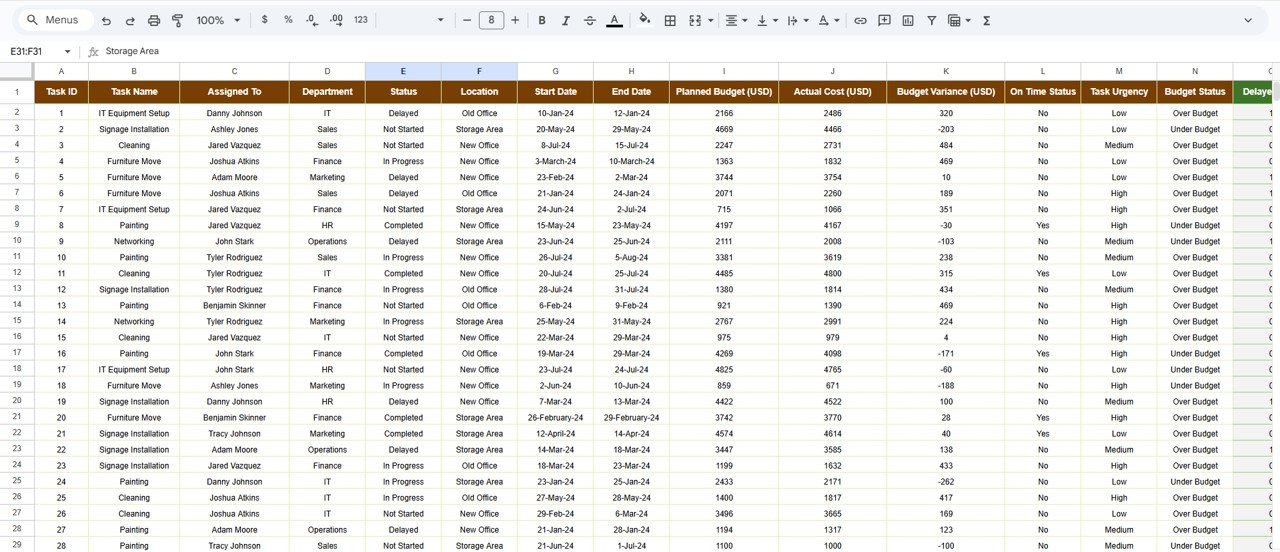
📁 Data Section – Structured Task Database
All analytics are driven by a clean backend table including:
-
Task Name
-
Department
-
Location
-
Assigned To
-
Status & Urgency
-
Start & End Dates
-
Planned Budget & Actual Cost
-
Task Duration (Days)
-
Remarks
🎯 Who Should Use This Dashboard
-
Office Managers
-
Operations Teams
-
HR & Administration
-
Project & Task Coordinators
-
Small & Medium Businesses
### Click here to read the Detailed blog post
Watch the step-by-step video tutorial:


Reviews
There are no reviews yet.