Organizations today face growing pressure to reduce operational costs, improve workspace efficiency, and meet sustainability and ESG goals. However, sustainability data such as energy usage, water consumption, seat occupancy, and waste generation often sits across multiple spreadsheets, utility bills, and manual reports. As a result, tracking sustainability performance becomes slow, fragmented, and ineffective.
That is exactly why the Office Sustainability Dashboard in Google Sheets becomes a powerful and practical solution.
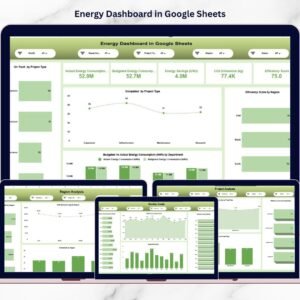
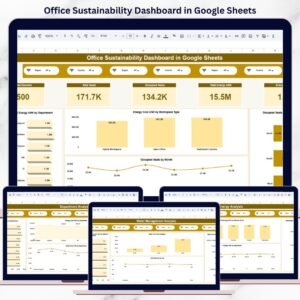
This ready-to-use dashboard converts raw sustainability and facility data into clear KPIs, visual insights, and actionable trends—all inside Google Sheets. Instead of switching between reports, facility managers and sustainability teams can monitor energy usage, water costs, occupancy, and environmental impact from one centralized dashboard.
Because the dashboard is built in Google Sheets, it is cloud-based, collaborative, cost-effective, and easy to customize, without the need for complex BI tools or technical expertise.
🌍 Key Features of the Office Sustainability Dashboard
⚡ Centralized Sustainability Monitoring
Track energy, water, occupancy, and waste KPIs in one place.
📊 KPI-Driven Visual Layout
Instant insights using cards, bar charts, line charts, and trends.
🔍 Advanced Filters & Slicers
Analyze data by region, department, city, workspace type, and more.
🔄 Automatic Updates
Update data once—every chart and KPI refreshes instantly.
🤝 Real-Time Collaboration
Share and review sustainability performance across teams.
📦 What’s Inside the Office Sustainability Dashboard
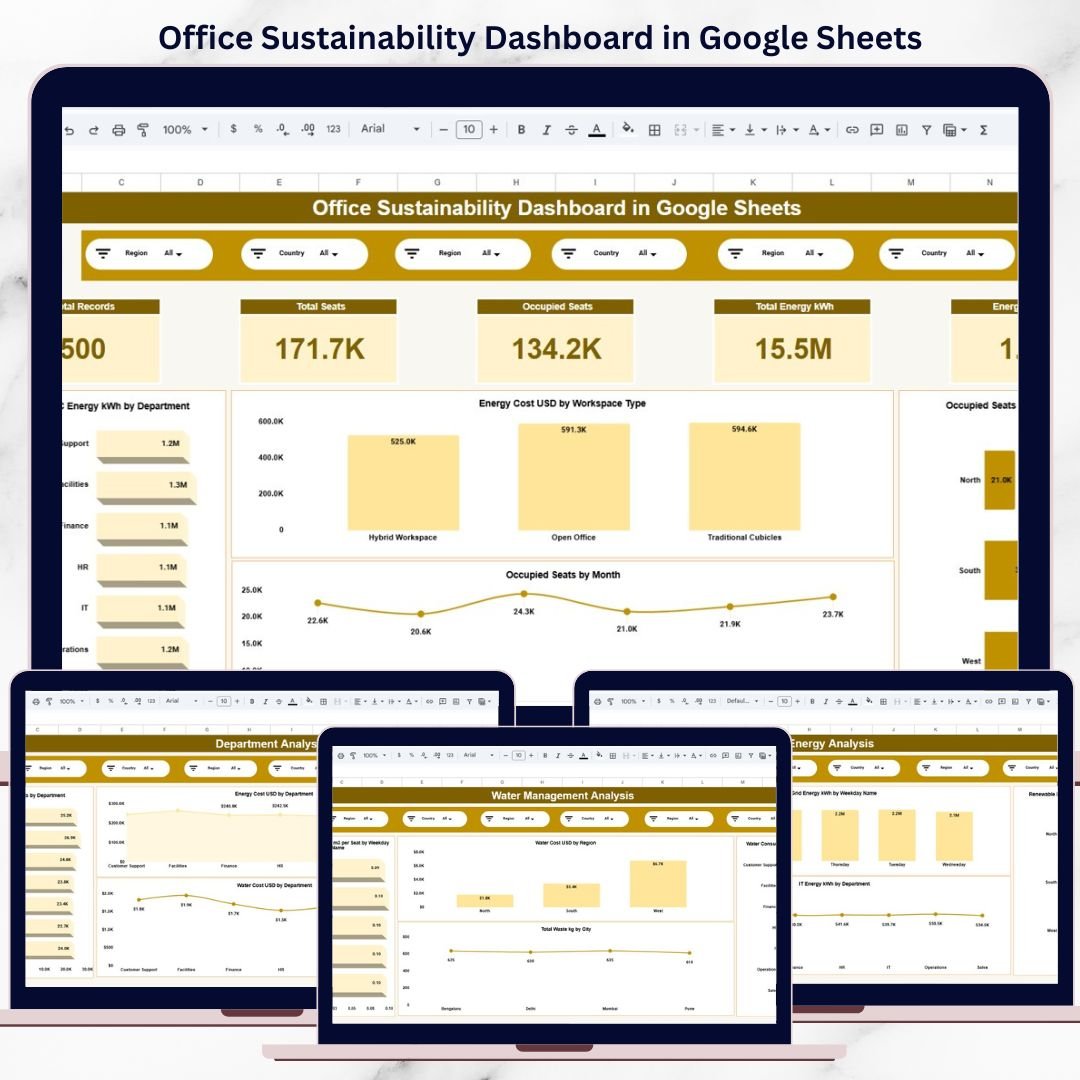
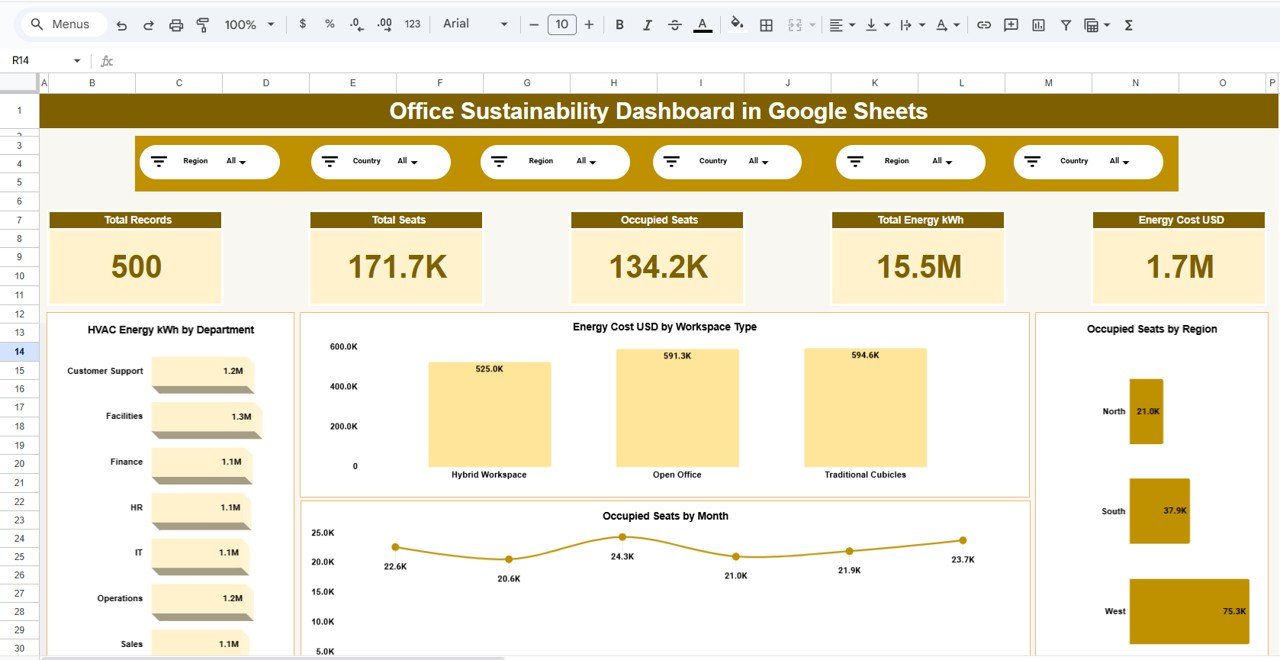
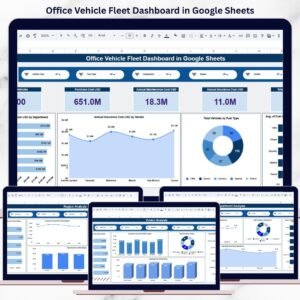
🧭 Overview Page – Sustainability Snapshot
This page provides a high-level summary of office sustainability performance.
KPI Cards Include:
-
Total Records
-
Total Seats
-
Occupied Seats
-
Total Energy Consumption (kWh)
-
Total Energy Cost (USD)
Charts Included:
-
HVAC Energy Consumption by Department
-
Energy Cost by Workspace Type
-
Occupied Seats by Region
-
Occupied Seats Trend by Month
This page helps leadership quickly understand overall sustainability health.
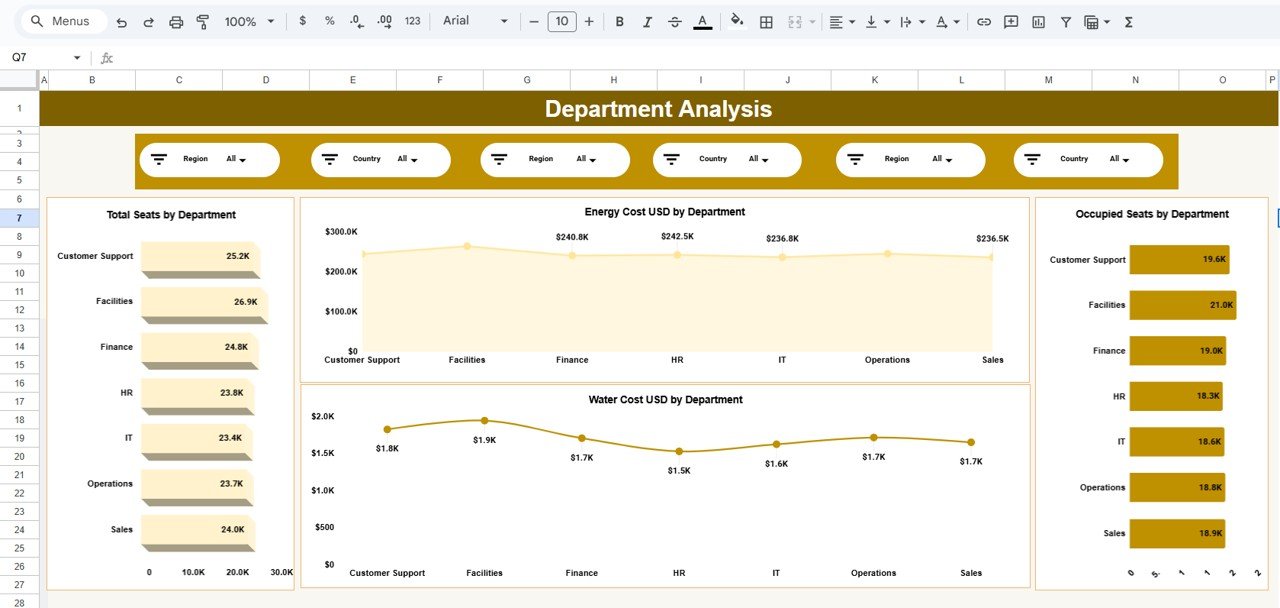
🏢 Department Analysis – Team-Level Insights
This page highlights sustainability metrics by department.
Charts Included:
-
Total Seats by Department
-
Occupied Seats by Department
-
Energy Cost (USD) by Department
-
Water Cost (USD) by Department
It helps identify departments with higher consumption and optimization opportunities.
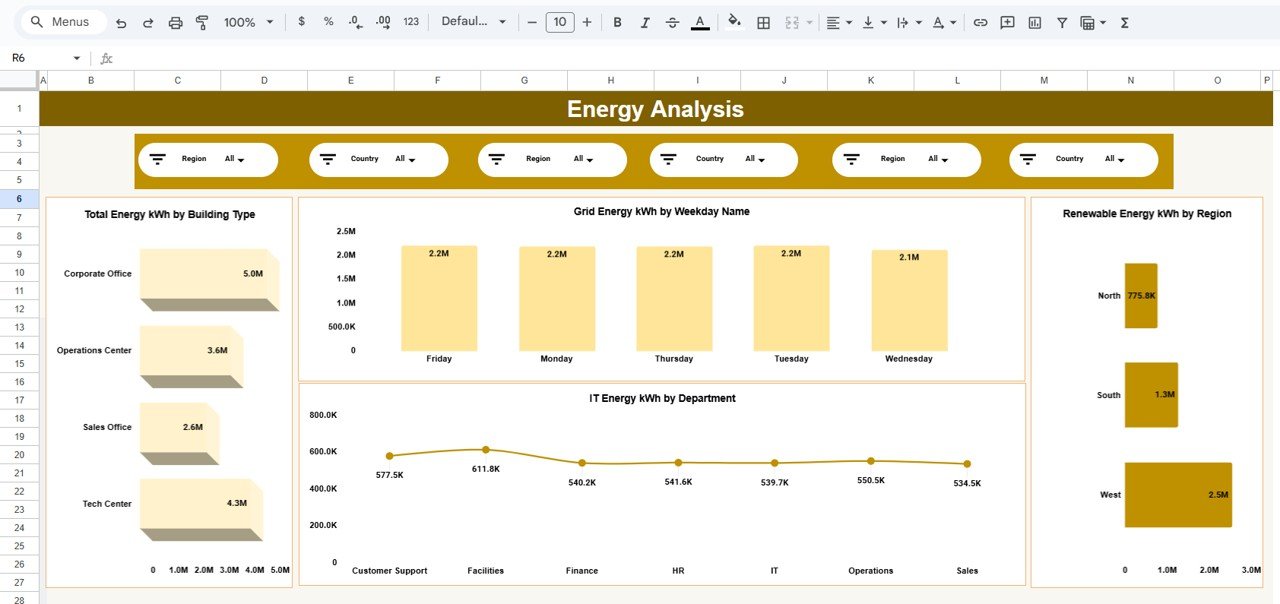
⚡ Energy Analysis – Power Consumption Intelligence
This page focuses on electricity usage and efficiency.
Charts Included:
-
Total Energy (kWh) by Building Type
-
Grid Energy (kWh) by Weekday
-
IT Energy (kWh) by Department
-
Renewable Energy (kWh) by Region
This analysis supports energy-saving initiatives and renewable adoption planning.
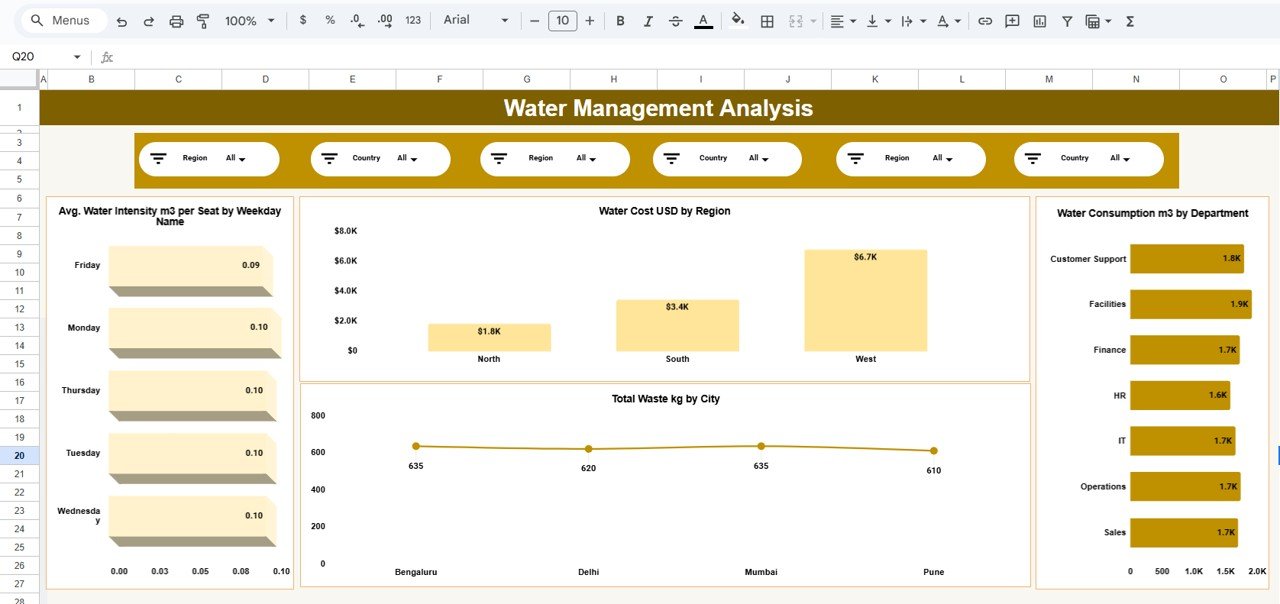
💧 Water Management Analysis – Environmental Impact
This page tracks water usage and waste generation.
Charts Included:
-
Average Water Intensity (m³ per seat) by Weekday
-
Water Cost (USD) by Region
-
Water Consumption (m³) by Department
-
Total Waste (kg) by City
It helps reduce water waste and manage environmental impact effectively.
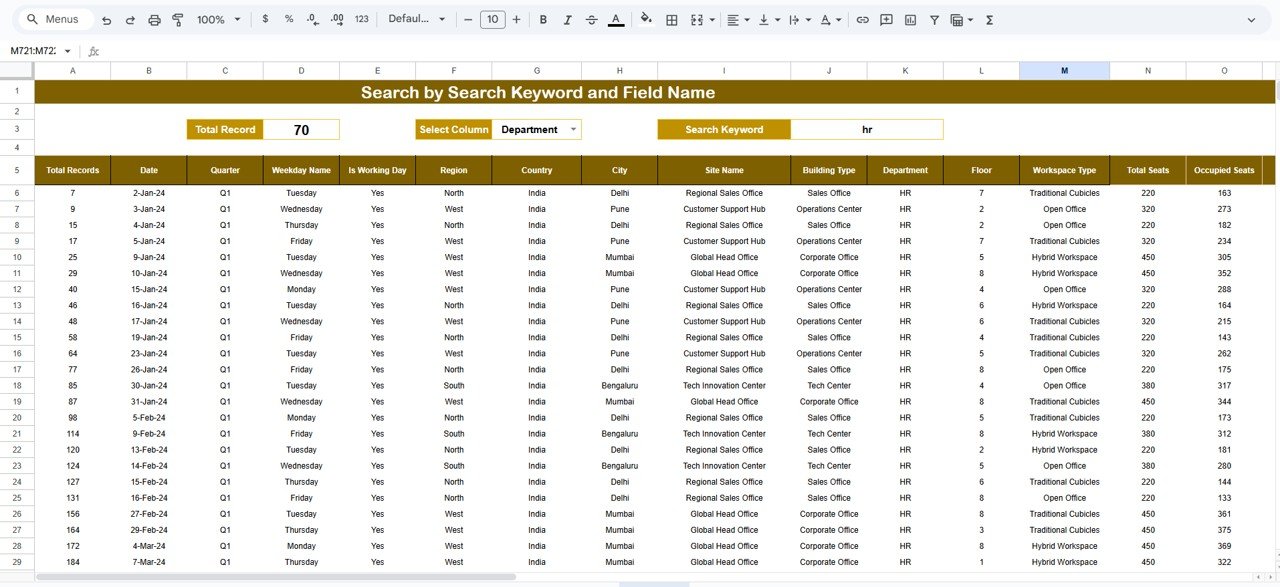
🔎 Search & Detailed Data View
This page allows users to explore underlying sustainability records.
Key Capabilities:
-
Search by keyword
-
Search by selected column (Department, City, Region, etc.)
-
Instantly filter large datasets
-
Review detailed sustainability transactions
This feature is especially useful for audits, reviews, and compliance reporting.
👥 Who Can Benefit from This Dashboard
-
Facility Managers
-
Sustainability & ESG Teams
-
Operations Managers
-
Corporate Real Estate Teams
-
Compliance Officers
-
Green Building Consultants
-
Shared Workspace Operators
The dashboard works for single offices and multi-location organizations.
⚙️ How to Use the Office Sustainability Dashboard
-
Enter sustainability data in the data sheet
-
Apply slicers for focused analysis
-
Review KPIs and visual trends
-
Identify inefficiencies and high-cost areas
-
Take data-driven sustainability actions
No advanced Google Sheets skills required.
### Click here to read the Detailed blog post
Watch the step-by-step video tutorial:


Reviews
There are no reviews yet.