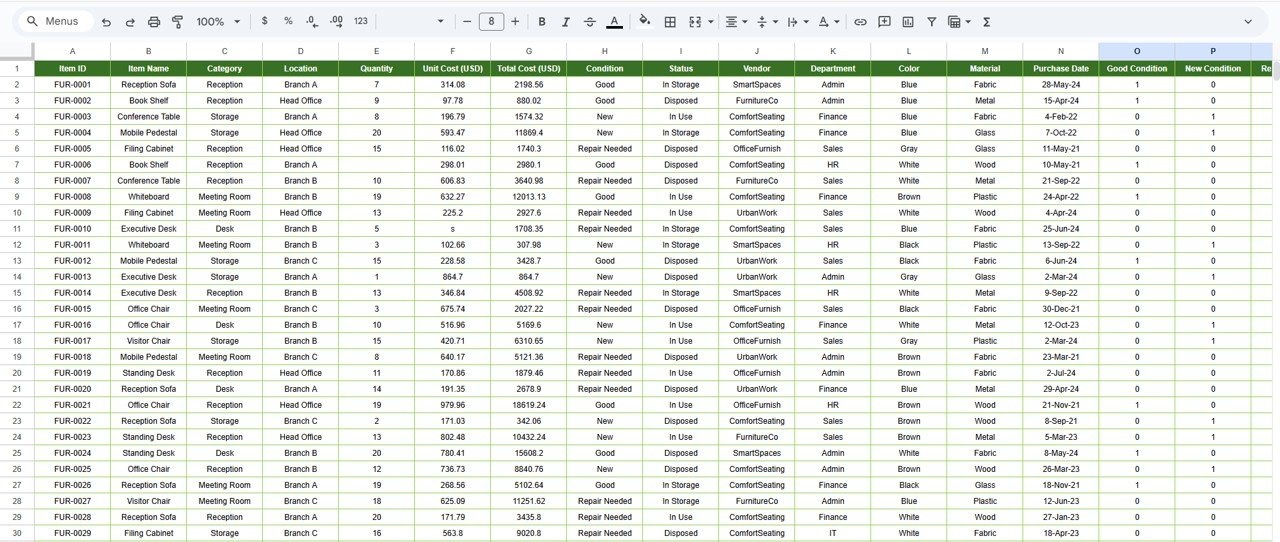
Managing office furniture becomes increasingly complex as organizations expand across departments, floors, and locations. Chairs, desks, cabinets, workstations, and meeting tables are purchased frequently, moved often, repaired occasionally, and disposed of over time. When this information is scattered across spreadsheets or registers, businesses lose visibility, overspend unnecessarily, and struggle with maintenance planning. The Office Furniture Inventory Dashboard in Google Sheets solves these challenges with a centralized, visual, and ready-to-use inventory management solution.
This dashboard brings all furniture-related data into one structured system. It allows facility managers, admin teams, procurement teams, and finance departments to track furniture quantity, condition, cost, vendor details, department allocation, and monthly trends—all from a single Google Sheets file. Because the dashboard updates automatically and works in the cloud, teams always work with accurate, real-time information.
✨ Key Features of the Office Furniture Inventory Dashboard in Google Sheets
📊 Centralized Furniture Inventory Overview
The dashboard consolidates all furniture data into one place, eliminating duplicate records and manual reconciliation.
💰 Cost & Asset Visibility
Track total furniture cost, department-wise spending, vendor-wise investment, and location-wise allocation instantly.
🛠 Condition & Repair Monitoring
Identify furniture in good condition, items requiring repair, and disposed assets to plan maintenance proactively.
📈 Trend Analysis for Better Planning
Monthly trend charts highlight new purchases, repair frequency, and spending patterns over time.
🔍 Smart Search Panel
Find any furniture item instantly using keyword-based search and field selection.
🤝 Real-Time Collaboration
Multiple users can update and review data simultaneously using Google Sheets.
📦 What’s Inside the Office Furniture Inventory Dashboard
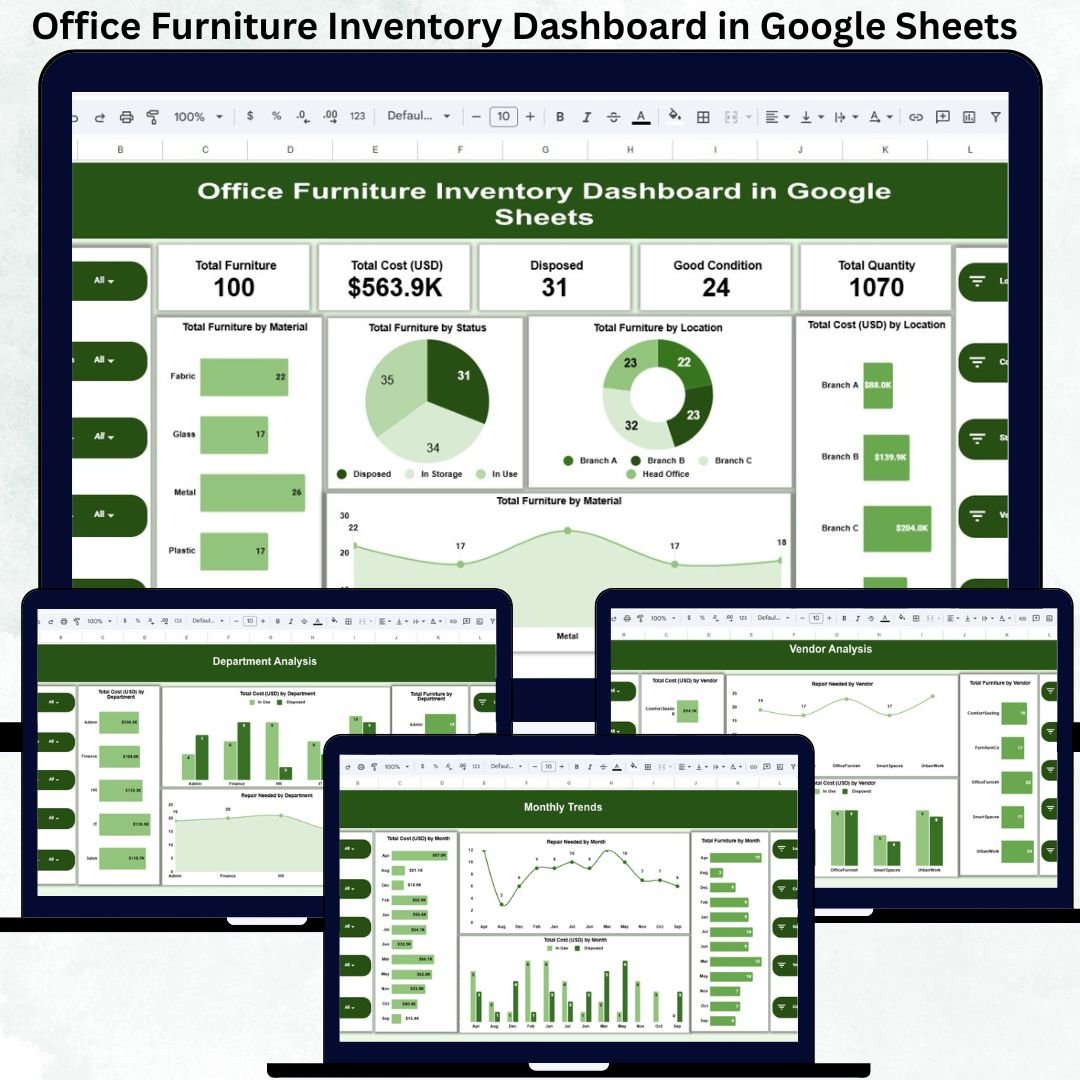
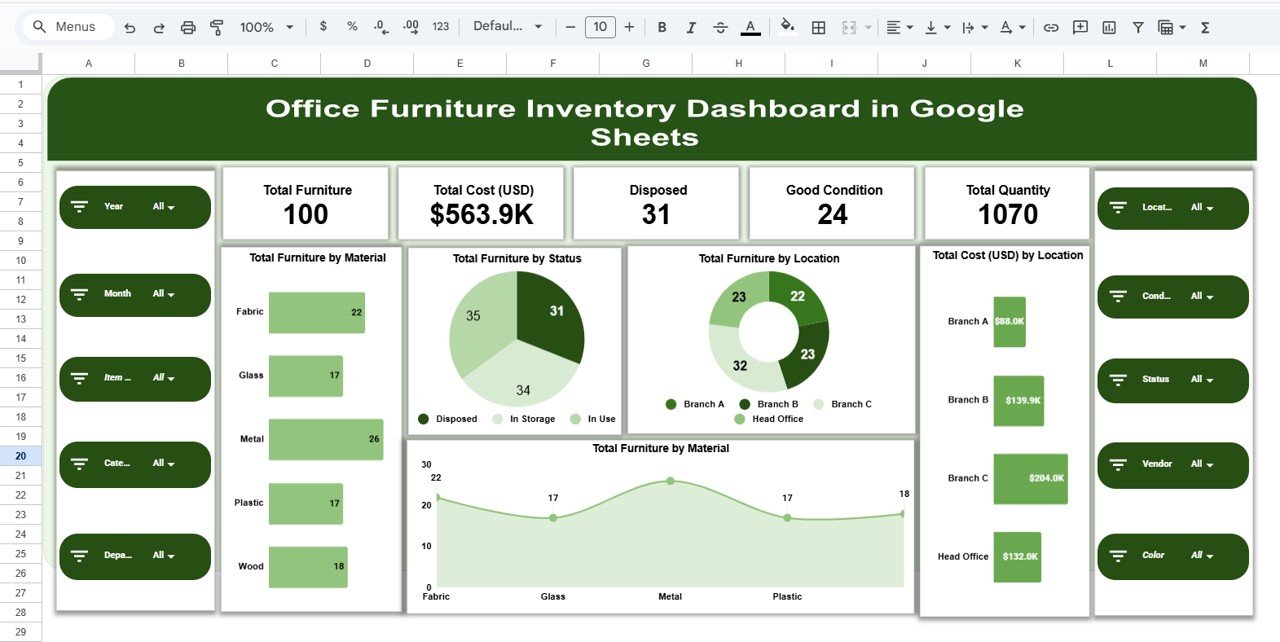
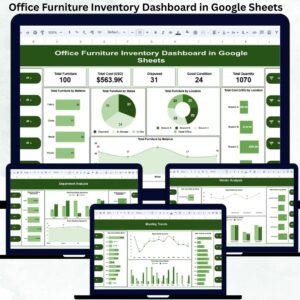
🖥 Overview Sheet – Instant Inventory Health Check
This sheet provides a high-level snapshot of your furniture inventory using KPI cards and charts.
KPI Cards Display:
-
Total Furniture
-
Total Cost (USD)
-
Total Quantity
-
Good Condition Items
-
Disposed Items
Overview Charts Include:
-
Total Furniture by Material
-
Total Furniture by Status
-
Total Furniture by Location
-
Total Cost (USD) by Location
These visuals help management assess inventory health in seconds.
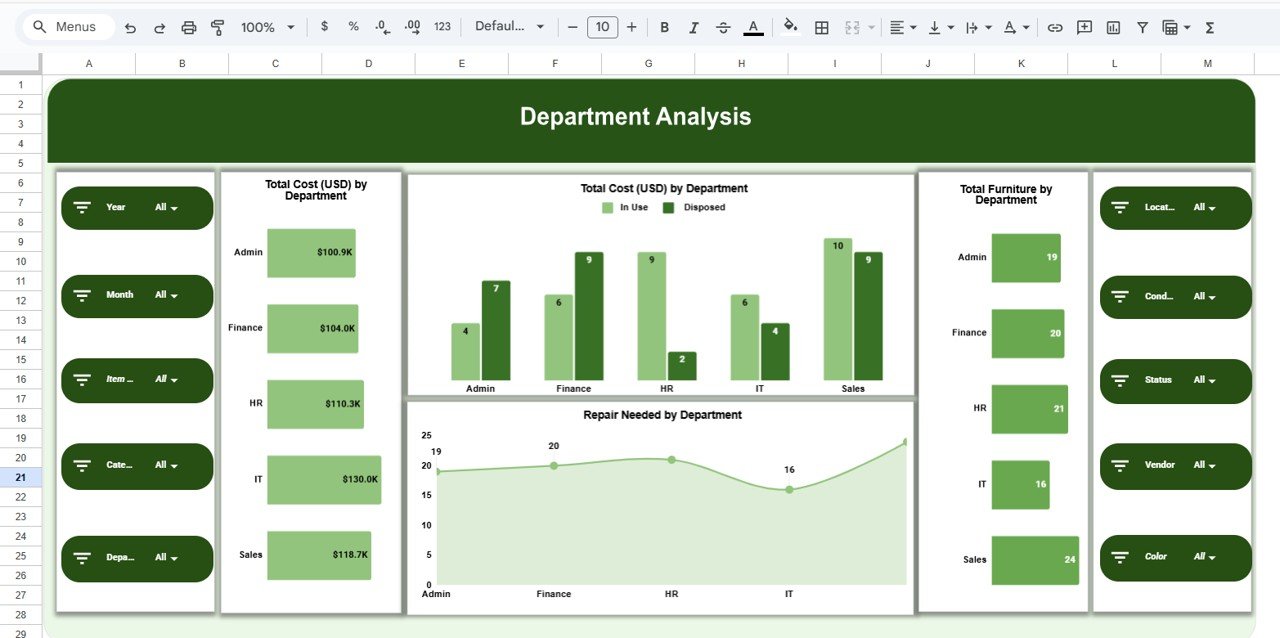
🏢 Department Analysis – Usage & Cost Breakdown
This section shows how furniture is distributed and maintained across departments.
Key Charts:
-
Total Furniture by Department
-
Total Cost (USD) by Department
-
Repair Needed by Department
This analysis helps identify departments with higher usage, frequent repairs, or excessive costs—supporting smarter budgeting decisions.
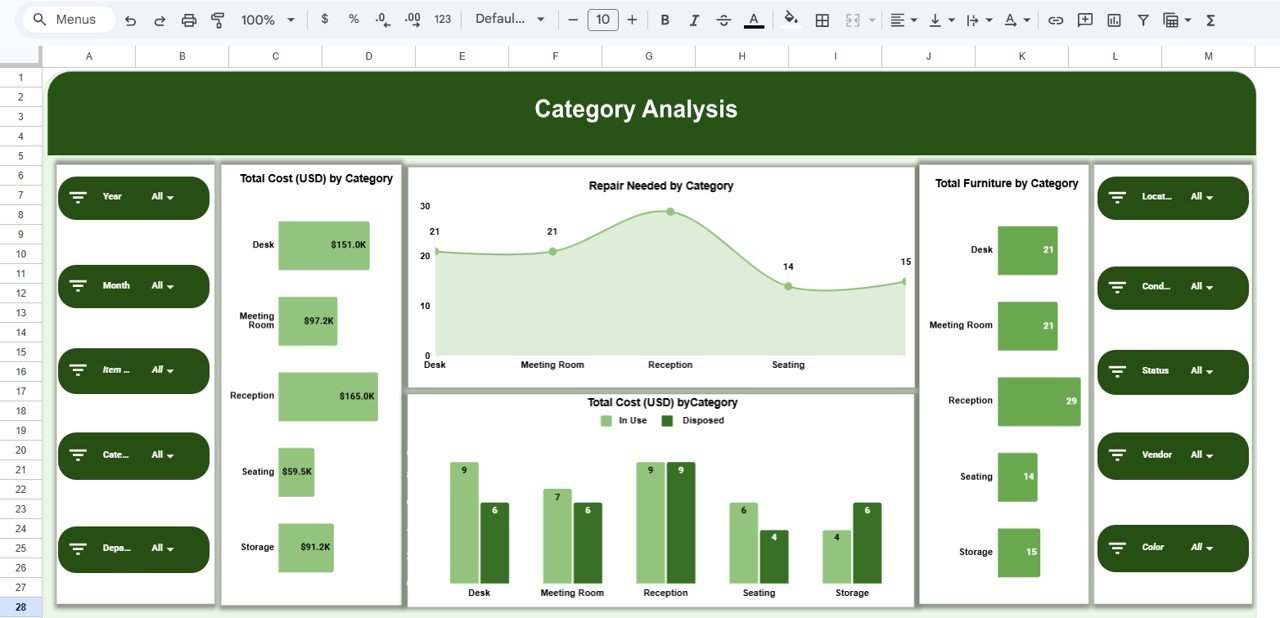
🪑 Category Analysis – Furniture Type Insights
Furniture categories such as chairs, desks, cabinets, tables, and workstations are analyzed here.
Category Charts:
-
Total Furniture by Category
-
Total Cost (USD) by Category
-
Repair Needed by Category
These insights help standardize purchases, reduce maintenance costs, and improve asset planning.
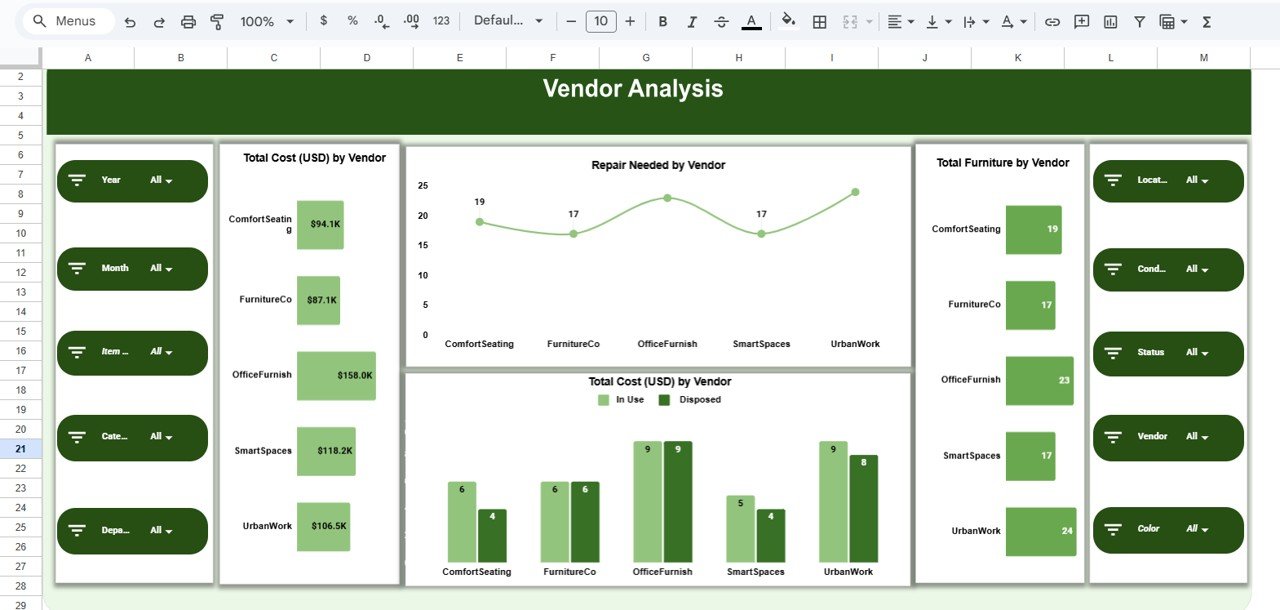
🏭 Vendor Analysis – Supplier Performance Tracking
This section evaluates furniture suppliers based on cost, quantity, and quality.
Vendor Charts Include:
-
Total Furniture by Vendor
-
Total Cost (USD) by Vendor
-
Repair Needed by Vendor
It helps procurement teams identify reliable vendors and negotiate better contracts.
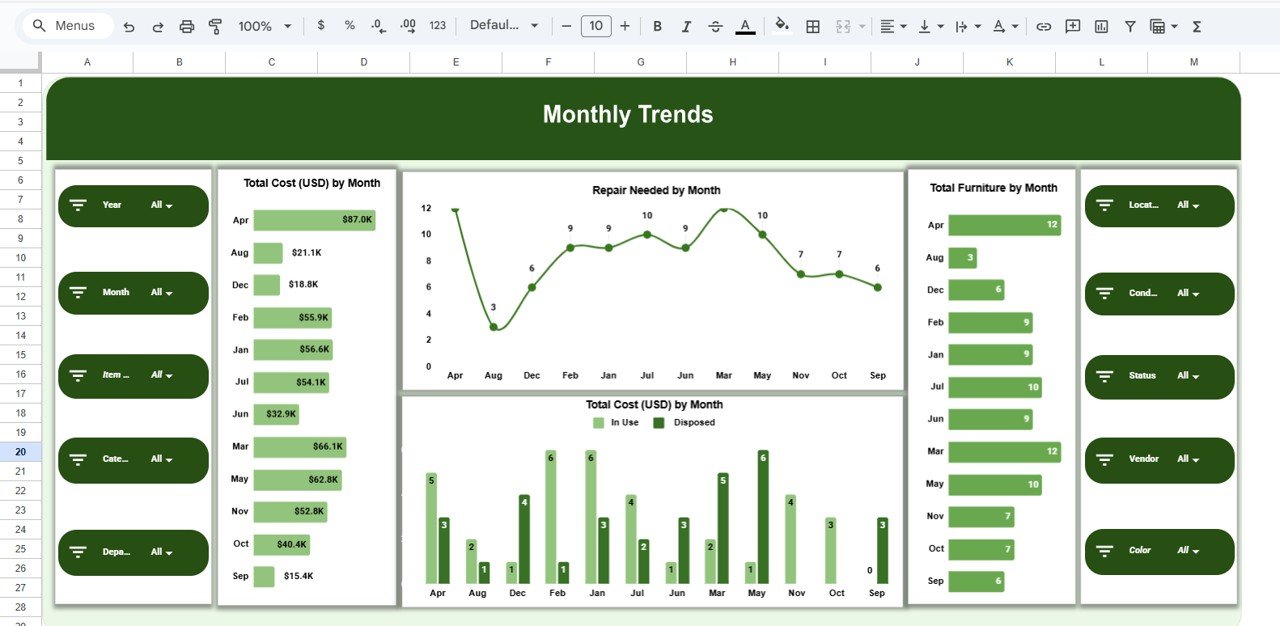
📅 Monthly Trends – Track Changes Over Time
Monitor inventory movement and maintenance patterns with month-wise visuals.
Trend Charts:
-
Total Furniture by Month
-
Total Cost (USD) by Month
-
Repair Needed by Month
These trends support forecasting, budgeting, and procurement planning.
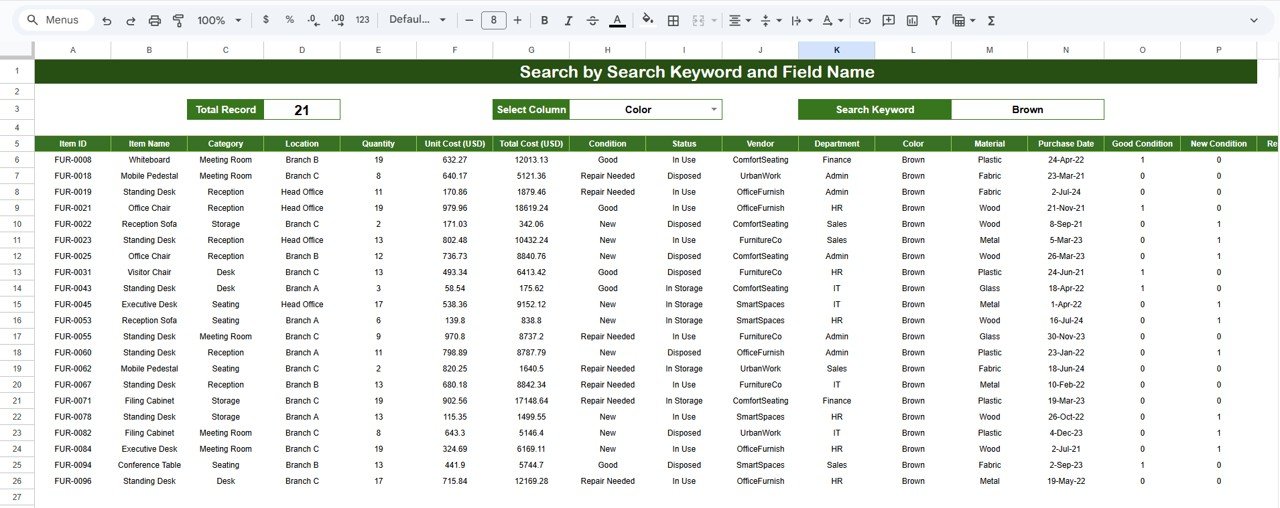
🔍 Search Functionality – Find Anything in Seconds
The dashboard includes a powerful Search Panel where users can search by:
-
Department
-
Location
-
Vendor
-
Category
-
Condition
-
Status
This feature saves time during audits, inspections, and management reviews.
🛠 How to Use the Office Furniture Inventory Dashboard
1️⃣ Enter all furniture details in the Data Sheet
2️⃣ Update condition and repair status regularly
3️⃣ Review department and vendor charts monthly
4️⃣ Use search for audits and quick checks
5️⃣ Restrict editing access to maintain data integrity
🎯 Who Can Benefit from This Dashboard
-
🏢 Facility & Admin Teams
-
📦 Procurement Departments
-
💼 Finance & Asset Management Teams
-
🧩 Operations & Compliance Teams
-
🚀 Growing Organizations with Multiple Offices
### Click here to read the Detailed blog post
Watch the step-by-step video tutorial:


Reviews
There are no reviews yet.