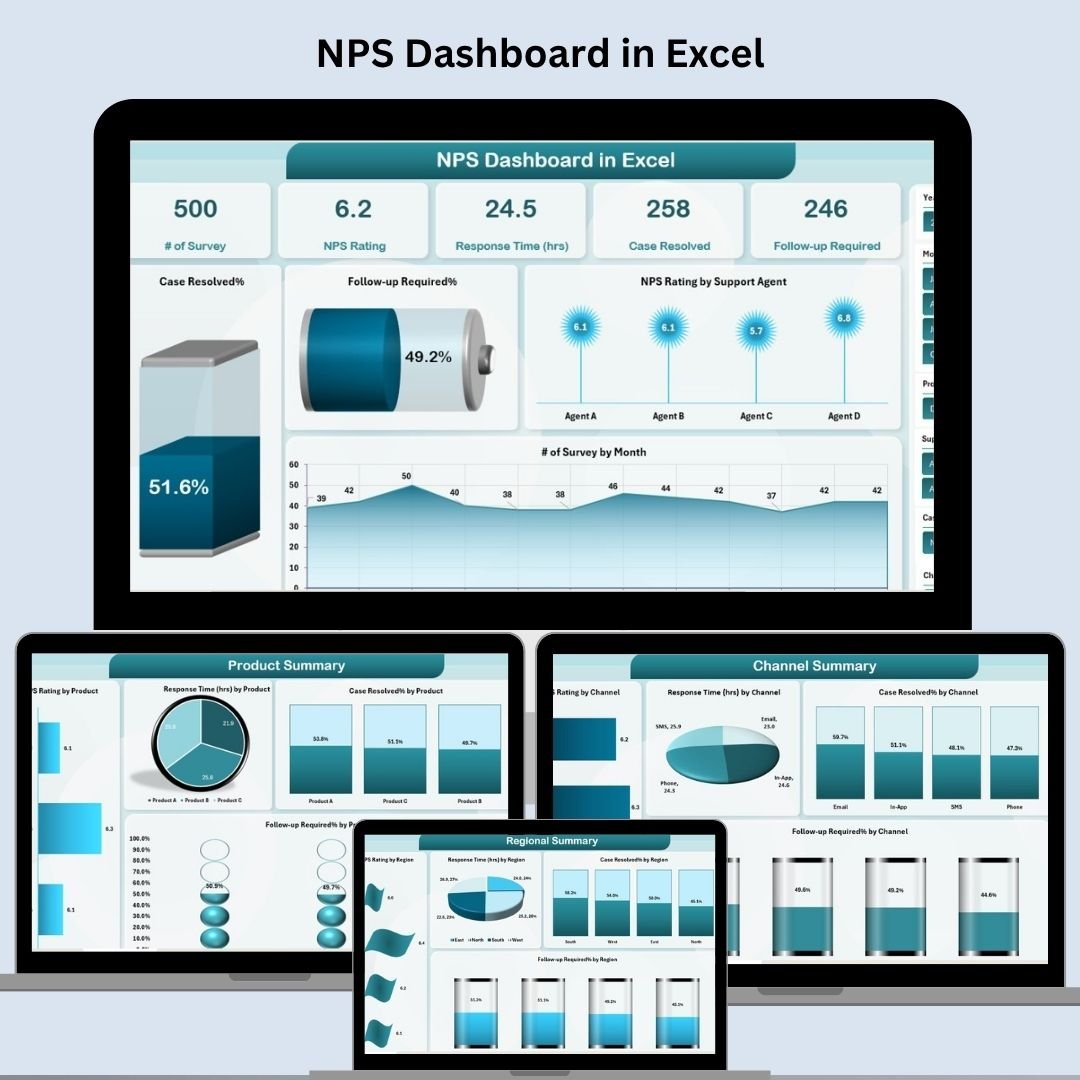
Want to understand what your customers really think? The NPS Dashboard in Excel is a ready-to-use, interactive solution that helps you track, analyze, and visualize Net Promoter Score (NPS) data effortlessly. Whether you manage customer support, service quality, or product experience—this Excel dashboard empowers your team to make smarter, data-driven decisions.
💡 Key Features of the NPS Dashboard in Excel
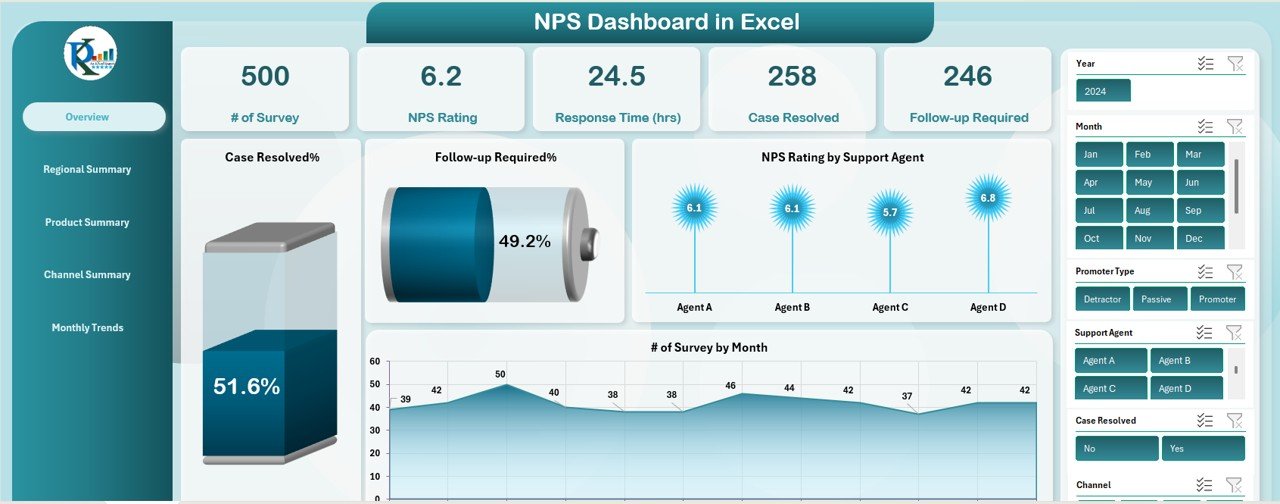
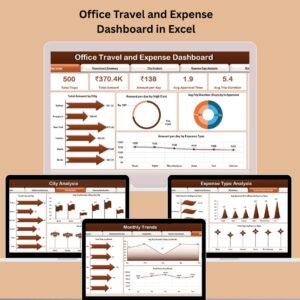
📋 Overview Sheet Tab
The main control panel of your NPS data. Instantly view:
-
🔢 # of Surveys
-
⭐ Overall NPS Rating
-
⏱️ Average Response Time (hrs)
-
✅ Case Resolved %
-
🔁 Follow-up Required %
📊 Visual Charts:
-
NPS Rating by Support Agent
-
Surveys by Month
-
Case Resolved %
-
Follow-up Required %
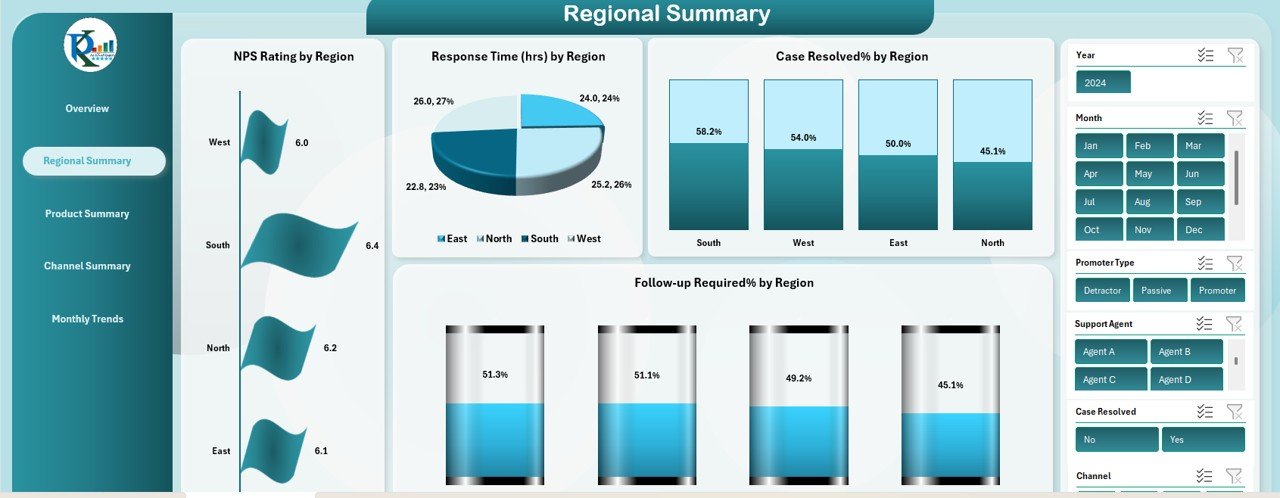
🗺️ Regional Summary Sheet Tab
Analyze how different locations perform:
-
NPS by Region
-
Response Time by Region
-
Case Resolved % by Region
-
Follow-up Required % by Region
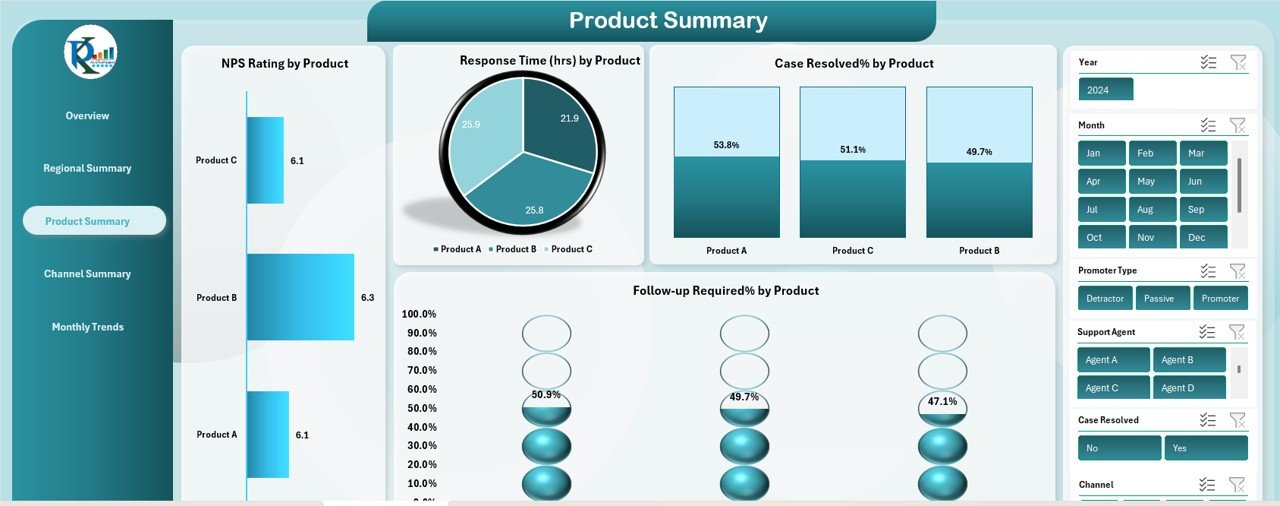
📦 Product Summary Sheet Tab
Track feedback for each product:
-
NPS Rating by Product
-
Response Time
-
Resolution Rate
-
Follow-up Percentage
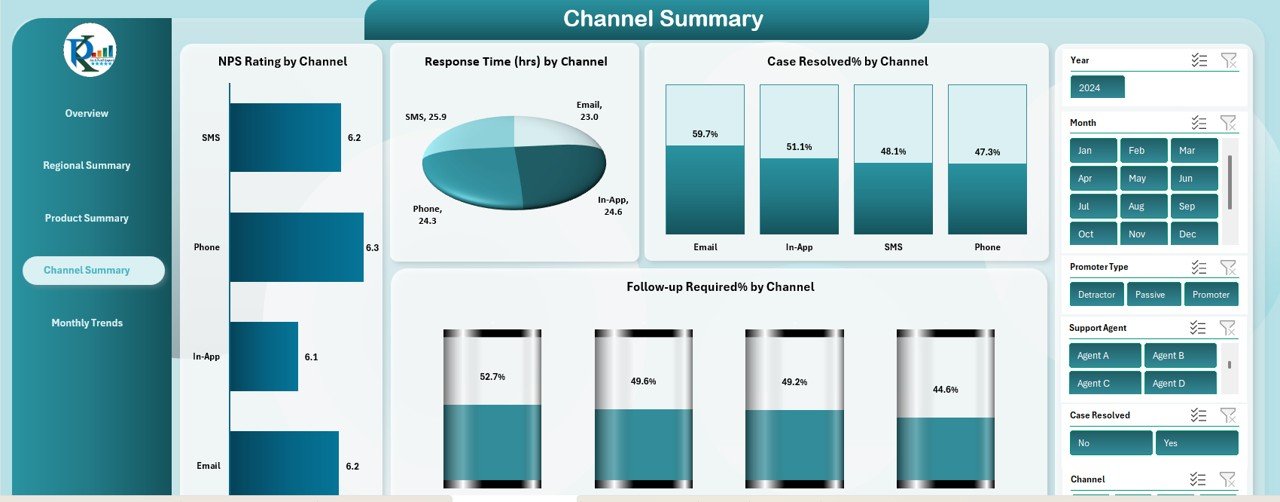
📞 Channel Summary Sheet Tab
See which communication channels perform best:
-
NPS by Channel (Phone, Email, Chat)
-
Response Time by Channel
-
Case Resolution %
-
Follow-up Cases by Channel
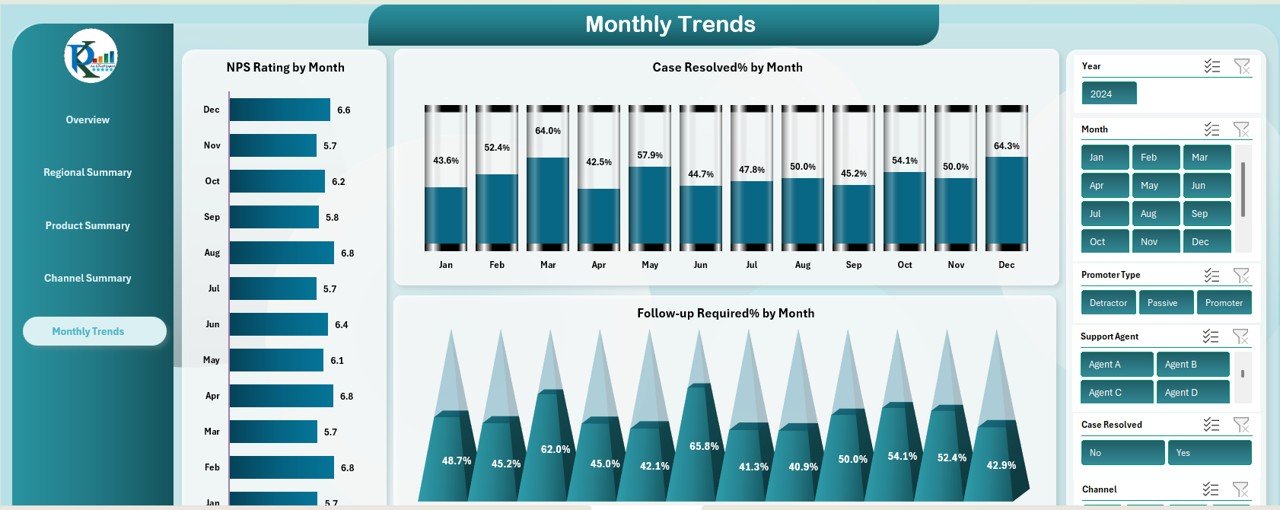
📅 Monthly Trends Sheet Tab
View your NPS journey over time:
-
NPS Rating by Month
-
Case Resolved % by Month
-
Follow-up % Trends
🧾 Data Sheet Tab
All raw data is entered here—NPS score, response times, agent info, product details, and more. Everything auto-updates across the dashboard.
📦 What’s Inside the NPS Dashboard in Excel
You’ll get a 6-tab dynamic Excel file built for insights:
-
✅ Overview – High-level metrics and visuals
-
✅ Regional Summary – Location-wise breakdown
-
✅ Product Summary – Product-specific performance
-
✅ Channel Summary – Feedback by support channels
-
✅ Monthly Trends – Trends over time
-
✅ Data Entry Sheet – Clean, structured input system
No complicated setups. Just plug in your survey data and start analyzing immediately.
🚀 How to Use the NPS Dashboard in Excel
-
Collect NPS Survey Data
From customer feedback or online tools -
Enter Data into the Data Sheet
Include NPS score, product, region, channel, agent, and timestamps -
Select Your Month
Use the slicers in the Overview sheet to drill down by month -
Monitor Visuals & KPIs
Charts and cards update automatically to show trends and performance -
Optimize Action Plans
Use insights to improve service quality, agent training, or follow-up strategy
👥 Who Can Use This Dashboard?
💼 Customer Service Teams – Identify top performers and lagging areas
📊 Marketing Analysts – Correlate loyalty scores with product engagement
🏢 CX Managers & Executives – Monitor performance by region or channel
🛍️ Product Teams – Track feedback trends by product line
📞 Call Center Leaders – Improve SLA adherence and follow-up efficiency
💡 Why You’ll Love This Excel NPS Dashboard
✅ Easy to Use – Designed for immediate implementation
✅ Fully Customizable – Add your own KPIs or visual styles
✅ Interactive & Visual – See trends with arrows, slicers, and color-coded charts
✅ No Coding or Add-ins – Works natively in Excel
✅ Cross-Department Friendly – Share insights with marketing, support, and leadership
✅ Exportable – Print or save as PDF for executive reviews
Stay on top of customer satisfaction—before it becomes a problem.
🔁 Click here to read the Detailed blog post
Click here to read the Detailed blog post


Reviews
There are no reviews yet.