The monthly sales tracker Report and Tracker in Google Sheets is a comprehensive tool designed to help businesses track and report sales performance on a monthly basis. This easy-to-use template allows you to monitor sales data, compare performance against targets, and analyze trends to make data-driven decisions. With real-time data input and automated calculations, you can track individual sales, regional performance, product categories, and overall revenue effortlessly.
Whether you’re a small business owner, sales manager, or team leader, this template simplifies the process of reporting and tracking sales figures, ensuring that your team stays focused on achieving sales targets and optimizing performance.
‘
Key Features of the Monthly Sales Report and Tracker in Google Sheets
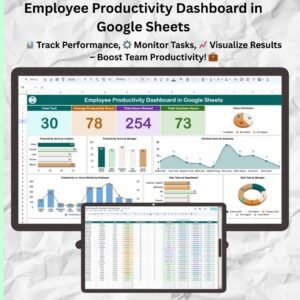
📅 Monthly Sales Overview: Track sales performance for each month, including total sales, individual targets, and sales performance against goals.
⚙️ Sales Performance Tracking: Monitor how well your team is performing relative to set sales targets.
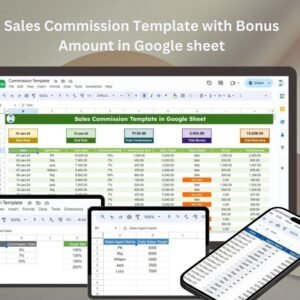
📊 Visual Reports: Automatically generate charts and graphs to visualize sales trends, individual performance, and overall growth.
💼 Customizable Fields: Adjust the template to include specific sales data such as regions, product categories, and sales teams.
📈 Performance Comparison: Compare current sales performance to previous months or set goals for improved results.
🔄 Real-Time Data Updates: Automatically update sales data and performance metrics in real time for accurate tracking.
Why You’ll Love the Monthly Sales Report and Tracker in Google Sheets
✅ Accurate Sales Tracking: Track monthly sales data, performance, and targets with ease.
✅ Visual Performance Insights: View sales data through graphs and charts, making it easier to identify trends and opportunities.
✅ Goal Tracking: Easily compare current sales performance against established targets to ensure you’re on track.
✅ Customizable: Tailor the tracker to fit your specific sales goals, regions, or products.
✅ Easy to Use: The simple layout and automated calculations make it easy for anyone to track and report sales.
What’s Inside the Monthly Sales Report and Tracker in Google Sheets?
📅 Monthly Sales Tracker: A detailed breakdown of sales performance month by month.
⚙️ Sales Target Management: Set targets for individual team members or product categories and monitor progress.
📊 Sales Analysis: Visual charts and graphs to help you analyze monthly sales trends and identify areas for improvement.
💼 Customizable Data Fields: Modify the template to match your business’s sales metrics and categories.
📈 Performance Comparison: Track how each month’s sales performance compares to previous months, enabling strategic adjustments.
How to Use the Monthly Sales Report and Tracker in Google Sheets
1️⃣ Download the Template – Get access to the pre-configured sales report and tracker in Google Sheets.
2️⃣ Enter Sales Data: Input your sales data, including monthly figures, targets, and product categories.
3️⃣ Track Performance: Monitor your sales progress and compare current performance against targets.
4️⃣ Analyze Data: Use visual charts and graphs to gain insights into your sales trends.
5️⃣ Adjust Strategies: Based on your data, make informed decisions to improve sales performance and achieve goals.
Who Can Benefit from the Monthly Sales Report and Tracker in Google Sheets?
🔹 Sales Managers
🔹 Small Business Owners
🔹 Team Leaders
🔹 Sales Teams
🔹 Financial Analysts
🔹 E-commerce Managers
🔹 Project Managers
Track your sales progress and optimize performance with the Monthly Sales Report and Tracker in Google Sheets. Ensure you hit your targets, analyze trends, and visualize growth with this simple yet powerful tool.
Click here to read the detailed blog post
Visit our YouTube channel to learn step-by-step video tutorials


Reviews
There are no reviews yet.