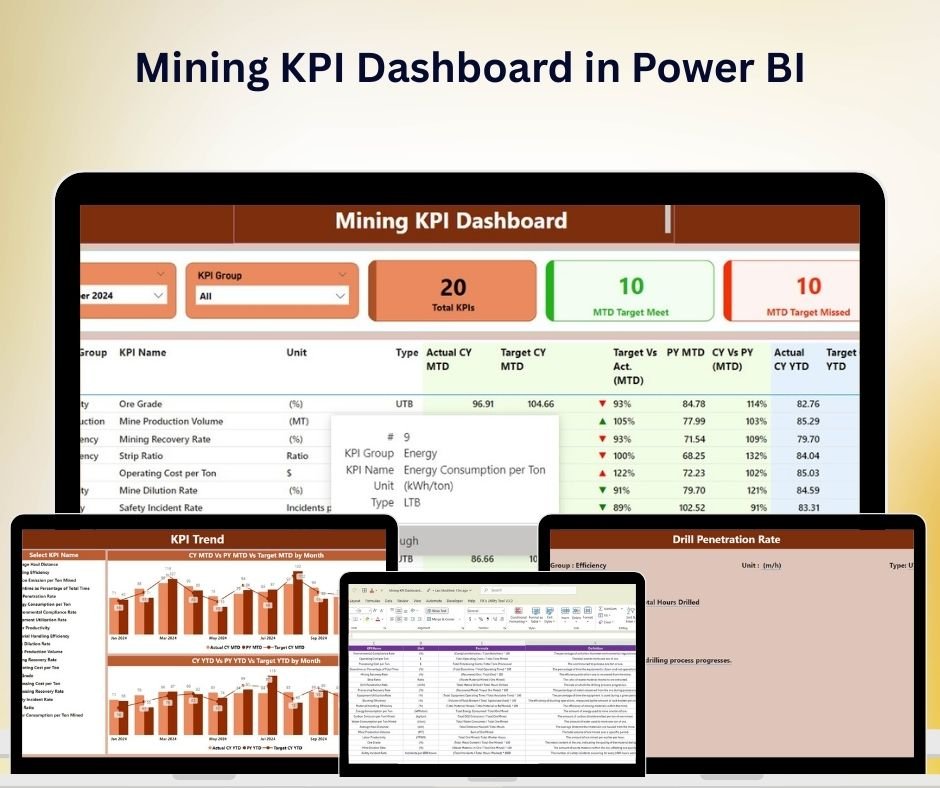


The Mining KPI Dashboard in Power BI is a comprehensive tool designed to help mining companies track and analyze key performance indicators (KPIs) related to mining operations. This dashboard provides real-time insights into critical metrics such as production efficiency, equipment performance, safety compliance, environmental impact, and workforce productivity. With this powerful tool, mining managers, analysts, and decision-makers can optimize operations, improve safety standards, and drive better profitability.
By integrating data from multiple sources, the dashboard enables users to monitor every aspect of mining operations from extraction to transportation. Whether you’re managing a single mining site or multiple locations, this tool offers scalable solutions to ensure smooth and efficient operations.

Key Features of the Mining KPI Dashboard in Power BI
📊 Comprehensive KPI Tracking
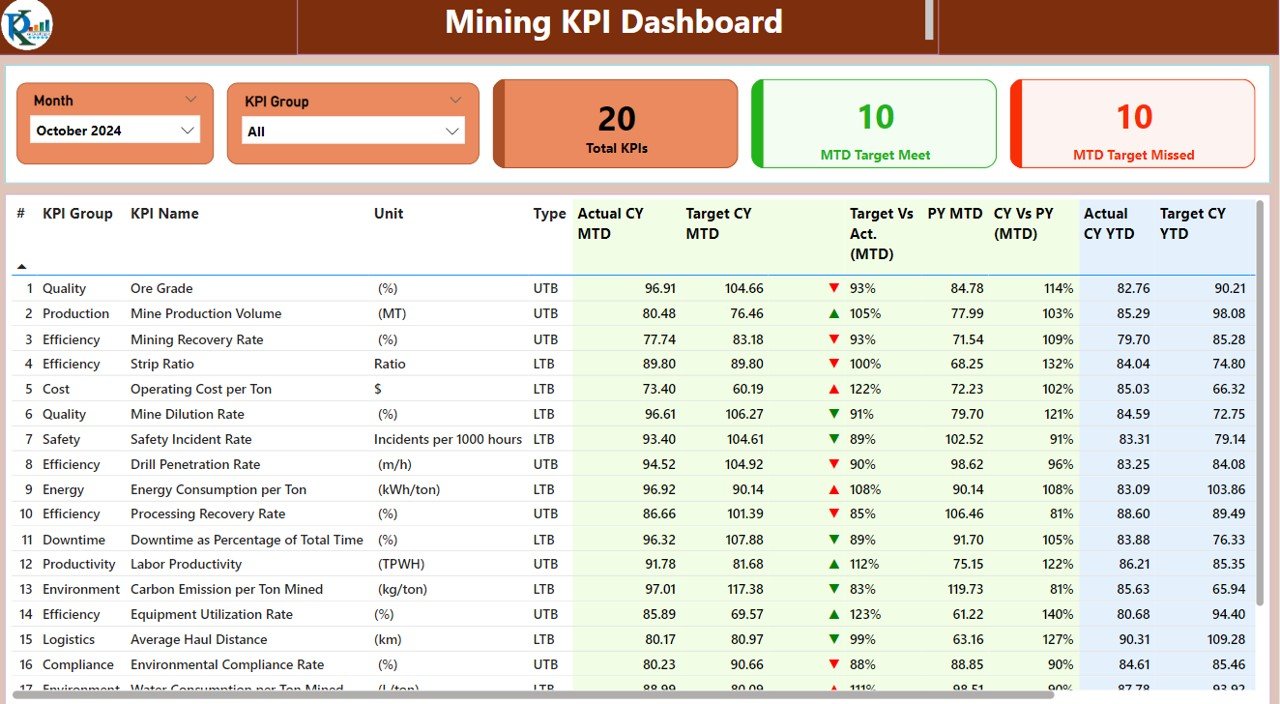
Monitor essential mining KPIs such as production output, machine utilization, downtime, and safety incidents. Track performance at the site, team, and company level for a holistic view of mining operations.
💼 Workforce Productivity Insights
Assess workforce productivity with KPIs like labor efficiency, shift performance, and overtime tracking. Identify trends and improve workforce allocation for optimal results.
⚙️ Equipment & Asset Management
Track the performance of mining equipment, including utilization rates, downtime, and maintenance schedules. Optimize asset performance and reduce costly equipment failures with proactive monitoring.
🌱 Environmental Impact Monitoring
Keep track of environmental metrics such as emissions, waste management, and resource usage. Ensure compliance with environmental regulations and minimize the ecological footprint of mining operations.
⏱ Real-Time Data Integration
Integrate real-time data from various sources, including production logs, equipment sensors, and workforce tracking systems. Make data-driven decisions based on up-to-date performance metrics.
🔑 Customizable Metrics & Reporting
Customize the dashboard to fit your specific mining operations. Add custom KPIs, modify reports, and create new metrics that reflect your business goals and challenges.
Why You’ll Love the Mining KPI Dashboard in Power BI
✅ Optimize Mining Operations
Track production, equipment, and workforce performance to identify inefficiencies and drive improvements across your mining operations.
✅ Improve Safety Standards
Monitor safety-related KPIs such as accidents, injuries, and compliance with safety regulations to reduce risk and improve worker safety.
✅ Enhance Asset Management
Track and analyze the performance of mining equipment to ensure better asset utilization and reduce downtime, leading to cost savings.
✅ Environmental Compliance
Ensure compliance with environmental regulations by monitoring key environmental metrics and mitigating the ecological impact of mining activities.
✅ Data-Driven Decision Making
Leverage real-time data and performance insights to make informed decisions that enhance operational efficiency, safety, and profitability.
What’s Inside the Mining KPI Dashboard in Power BI?
-
Comprehensive KPI Tracking: Monitor production, equipment, safety, and workforce performance.
-
Workforce Productivity Insights: Track labor efficiency, shift performance, and overtime.
-
Equipment Management: Analyze equipment performance, downtime, and maintenance.
-
Environmental Impact Monitoring: Keep tabs on emissions, waste, and resource usage.
-
Real-Time Data Integration: Integrate data from multiple sources for accurate, real-time insights.
-
Customizable Metrics: Tailor the dashboard to meet the unique needs of your mining operations.
How to Use the Mining KPI Dashboard in Power BI
1️⃣ Download the Template: Access the Mining KPI Dashboard in Power BI instantly.
2️⃣ Integrate Your Data Sources: Link your mining production, workforce, and equipment data sources to the dashboard.
3️⃣ Monitor KPIs & Performance: Track key performance metrics such as production output, equipment utilization, and safety compliance.
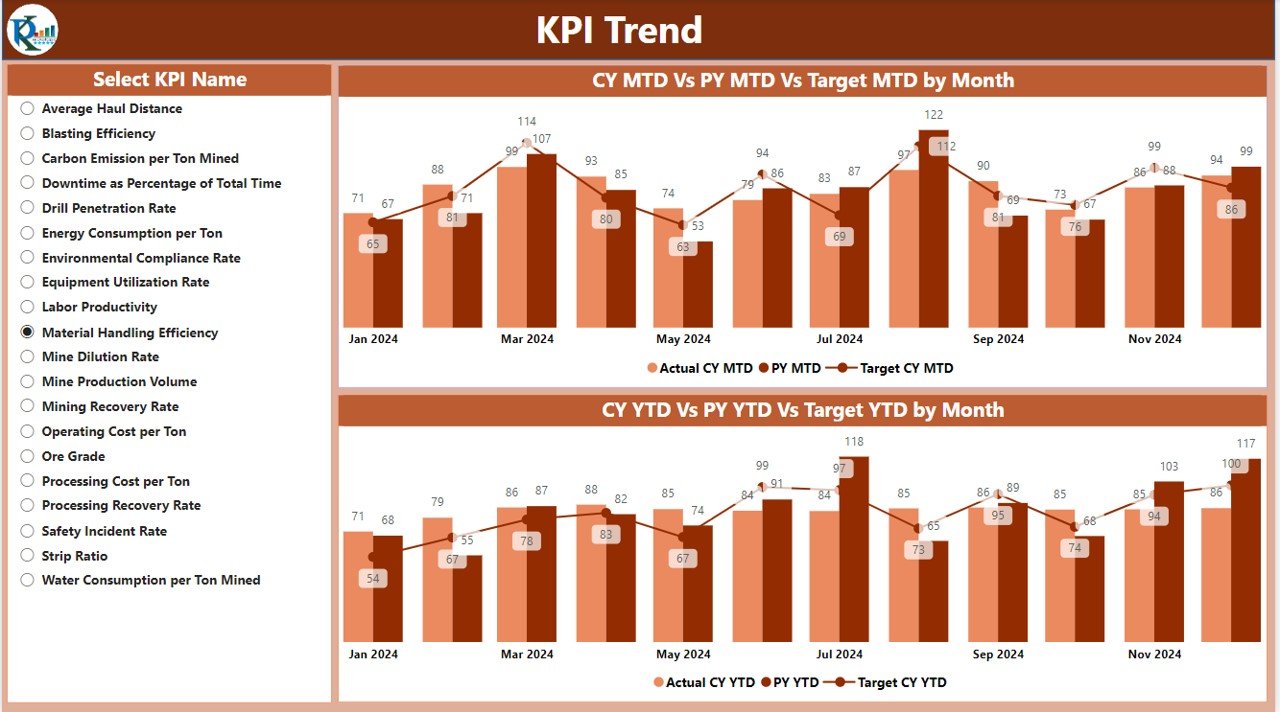
4️⃣ Analyze Trends & Data: Use time-based analysis to identify trends in performance and improve mining operations.
5️⃣ Make Data-Driven Decisions: Use insights from the dashboard to optimize processes, reduce downtime, and enhance profitability.
Who Can Benefit from the Mining KPI Dashboard in Power BI?
🔹 Mining Company Managers & Executives
🔹 Operations and Production Teams
🔹 Safety and Compliance Officers
🔹 Asset & Equipment Managers
🔹 Environmental Officers
🔹 Workforce and HR Managers
🔹 Mining Industry Analysts & Data Scientists
Improve the performance of your mining operations with the Mining KPI Dashboard in Power BI. Track key metrics, improve safety and environmental standards, and make data-driven decisions that drive success.
Click here to read the Detailed blog post
Visit our YouTube channel to learn step-by-step video tutorials
Youtube.com/@PKAnExcelExpert


Reviews
There are no reviews yet.