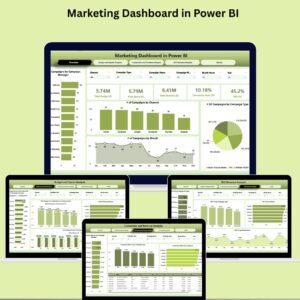
In today’s data-driven marketing world, success depends on how quickly you can analyze and respond to campaign performance. The Marketing Campaign Dashboard in Power BI empowers marketers to do exactly that—track, visualize, and optimize marketing campaigns across every channel, region, and time period from one intelligent and interactive dashboard. 📊🚀
Built using Power BI and Excel integration, this plug-and-play tool lets you ditch spreadsheets and manual reports forever. Whether you’re managing social media ads, email campaigns, or influencer promotions, this dashboard helps you measure what matters most—cost, conversions, impressions, and revenue.
🔑 Key Features of Marketing Campaign Dashboard in Power BI
🧭 Overview Page – High-Level Campaign Insights
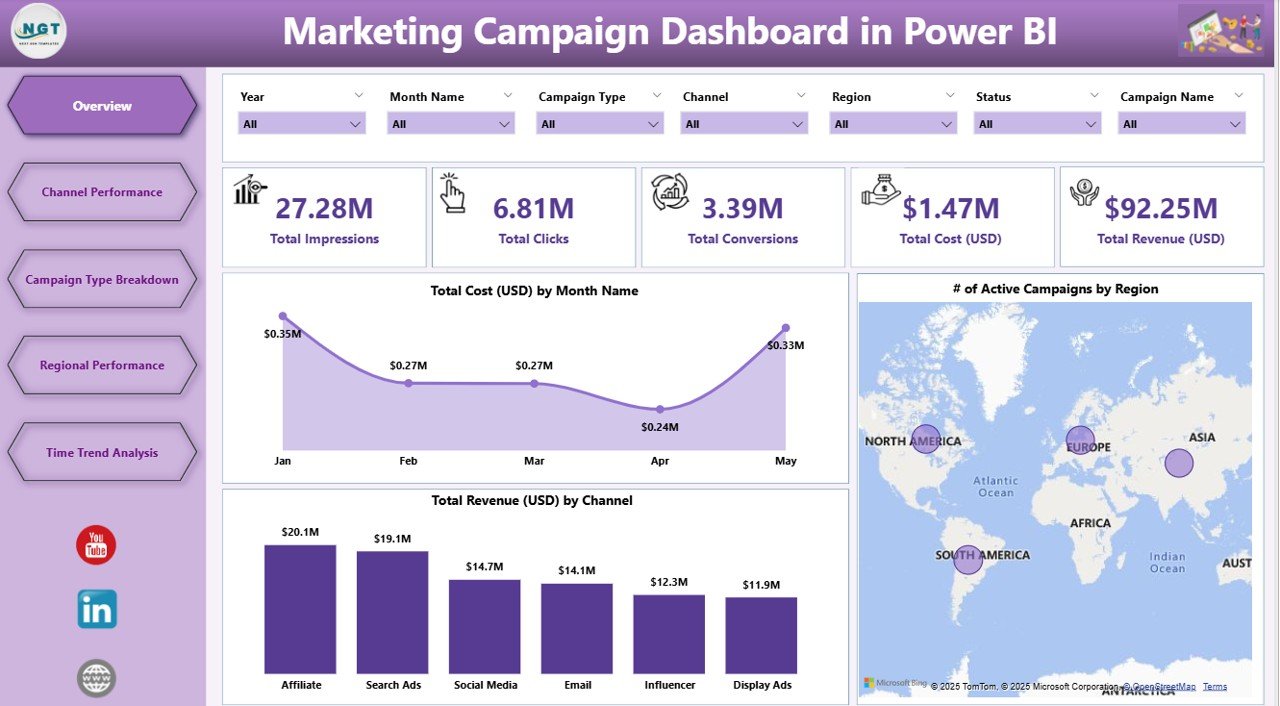
This is your mission control—see:
-
📌 Total Campaigns
-
💸 Total Cost
-
💰 Total Revenue
Plus, explore 3 key charts:
-
Total Cost (USD) by Month
-
# of Active Campaigns by Region
-
Total Revenue (USD) by Channel
Use 7 slicers to filter by month, region, campaign type, and more.
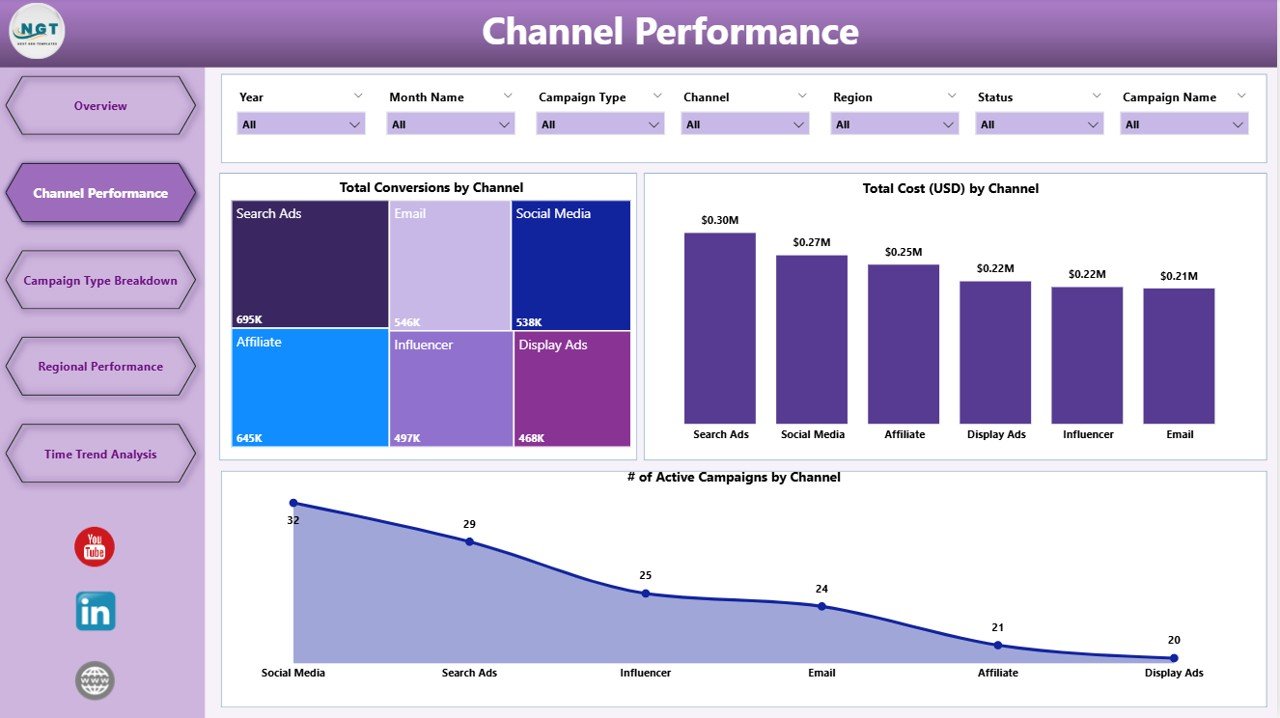
📣 Channel Performance Page
Get a deep-dive into each channel’s ROI:
-
Total Conversions by Channel
-
Total Cost by Channel
-
Active Campaign Count per Channel
Compare and shift your budget wisely.
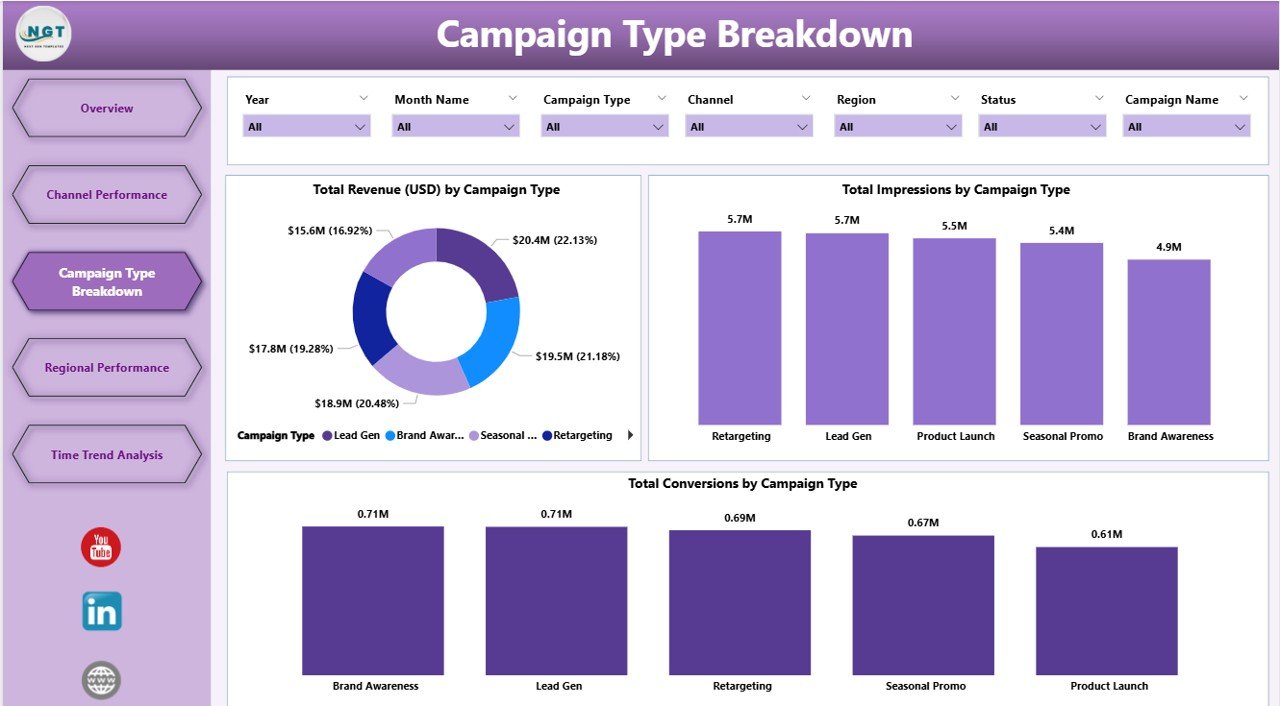
🧠 Campaign Type Breakdown Page
Compare effectiveness by campaign creative type:
-
Video vs Email vs Banner vs Influencer
Charts include: -
Revenue
-
Impressions
-
Conversions
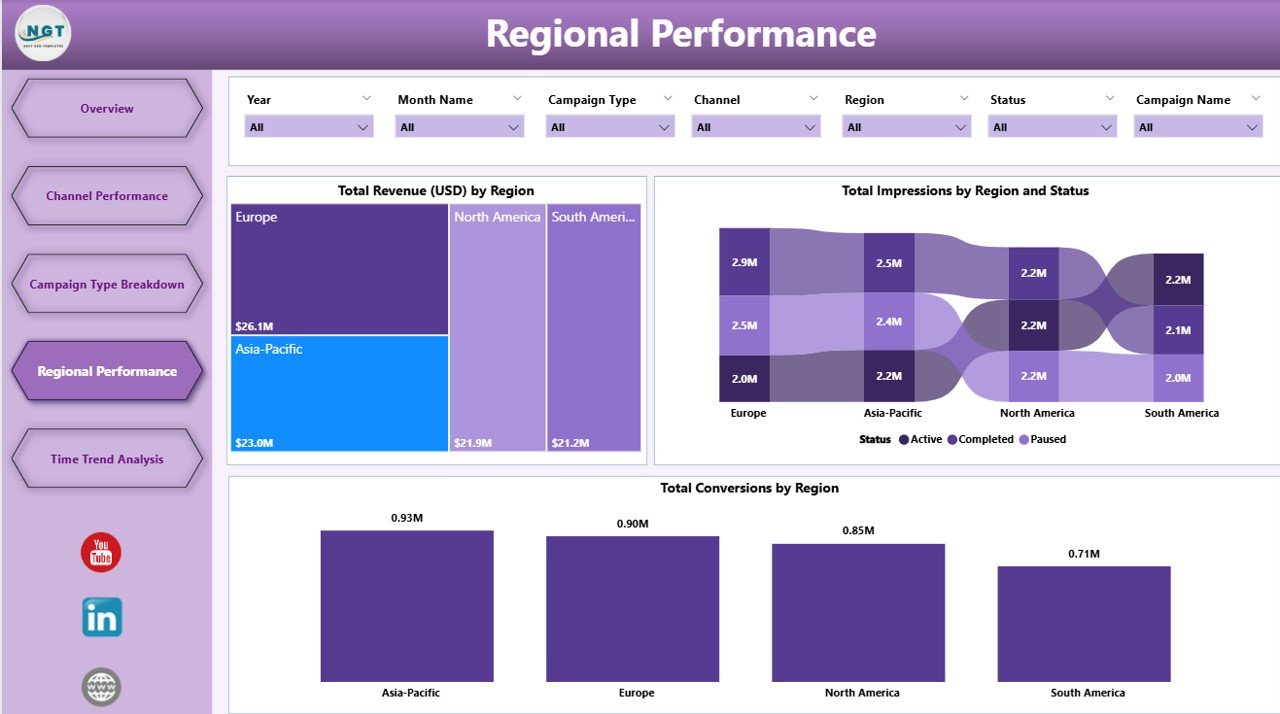
🌍 Regional Performance Page
Track KPIs across geographies:
-
Total Revenue by Region
-
Total Impressions by Region
-
Total Conversions by Region
Perfect for localizing your marketing strategy.
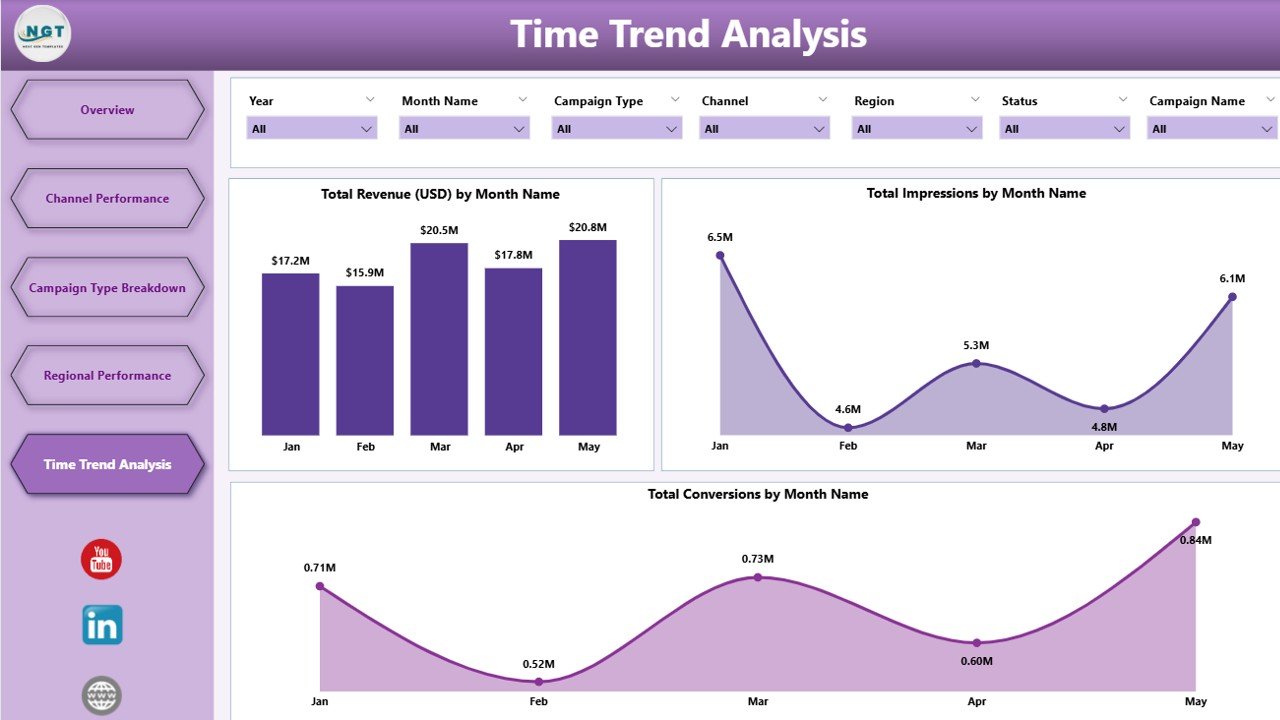
📆 Time Trend Analysis Page
Visualize performance across months:
-
Revenue, Impressions, Conversions
Easily spot seasonal spikes, dips, and fatigue trends.
📦 What’s Inside the Marketing Campaign Dashboard
📁 Power BI Dashboard File (.pbix)
📘 Excel Data Source File with structured tables:
-
Actual Performance
-
Campaign Definitions
-
Targets (Optional)
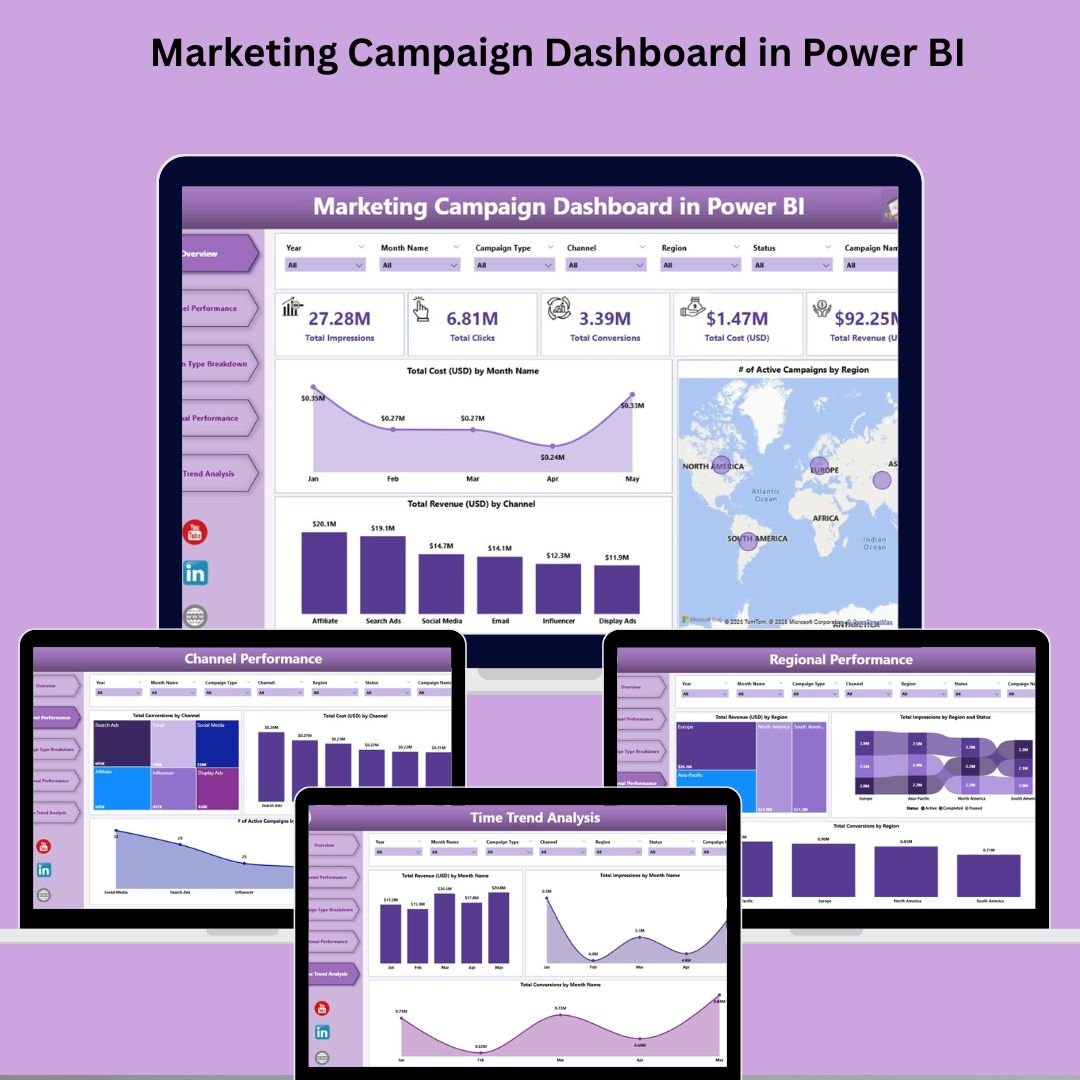
🎯 5 Interactive Pages:
-
Overview
-
Channel Performance
-
Campaign Type Breakdown
-
Regional Performance
-
Time Trend Analysis
🎛️ 7 Slicers for advanced filtering
📊 Combo Charts & KPI Cards
🔄 Auto-Refresh with Excel Updates
💡 No coding required—just plug in your data!
🛠️ How to Use the Marketing Campaign Dashboard
1️⃣ Download the Excel + Power BI files
2️⃣ Input your campaign data into the Excel sheet
3️⃣ Open Power BI Desktop and click “Refresh”
4️⃣ Filter by Month, Region, Channel, Type
5️⃣ Share via Power BI Service or Pro workspace
🔧 Want to go further? Customize visuals, add KPIs like ROI or CTR, and set metric-based alerts!
🎯 Who Can Benefit from This Dashboard?
-
📊 Marketing Managers – Track KPIs across all initiatives
-
💸 Paid Media Teams – Optimize ad spend ROI
-
📍 Regional Campaign Leads – Localize strategies
-
💬 Email Teams – Compare newsletter vs promo blast performance
-
🎯 CMOs / VP Marketing – Make executive-level campaign decisions
-
📈 Agencies – Share performance dashboards with clients
-
🛍️ E-commerce Teams – Track ad revenue by product or funnel stage
🔗 Click here to read the Detailed blog post
🎥 Visit our YouTube channel to learn step-by-step video tutorials
(YouTube.com/@PKAnExcelExpert)









Reviews
There are no reviews yet.