The luxury handbag market is dynamic, competitive, and trend-driven. From fashion weeks to celebrity endorsements and festive campaigns, sales can spike or drop quickly. If you are still managing performance through scattered Excel sheets, you are leaving critical insights behind.
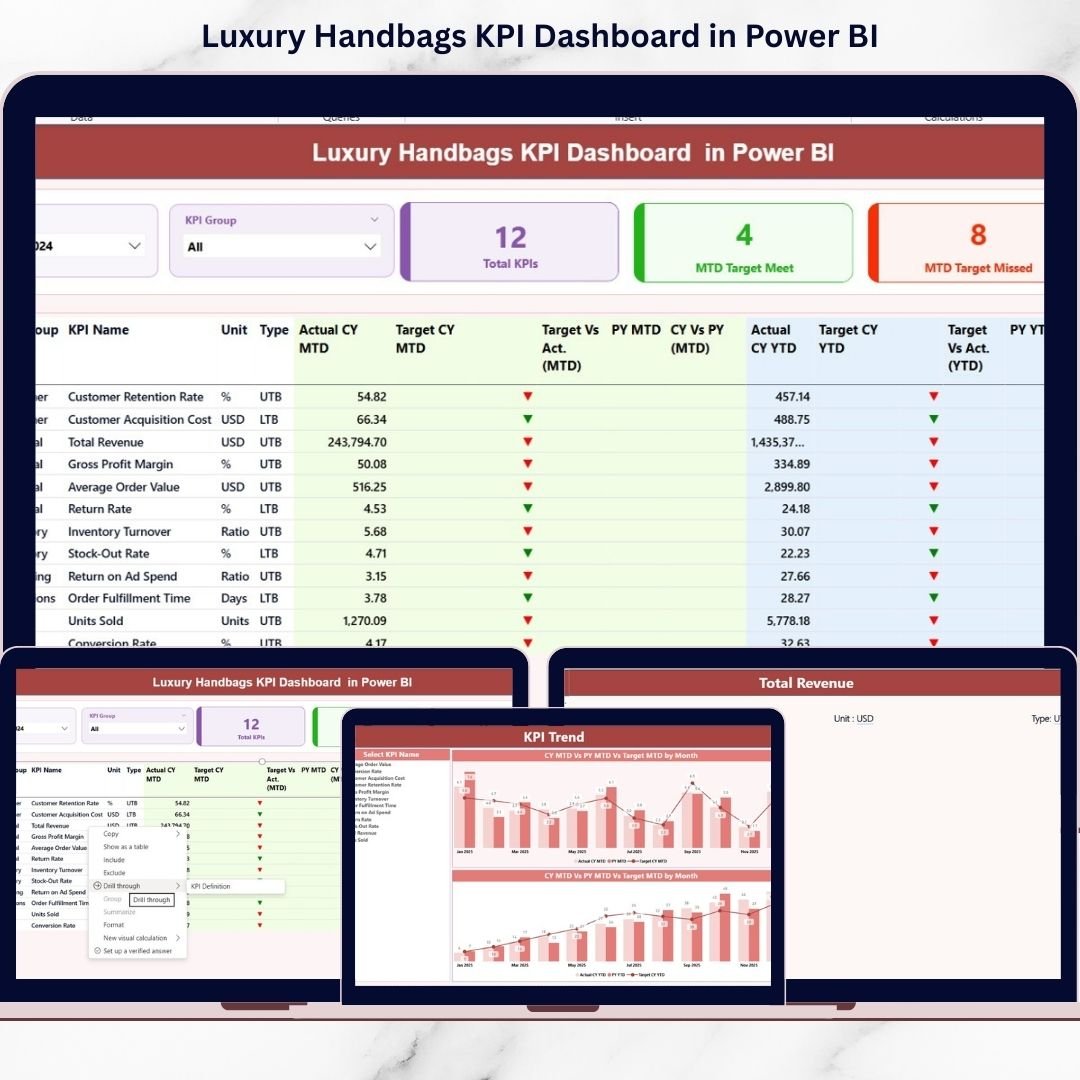
The Luxury Handbags KPI Dashboard in Power BI is a professionally designed, ready-to-use solution built specifically for premium handbag brands, retailers, and distributors. It transforms raw Excel data into powerful, interactive insights that help you monitor sales, profitability, inventory, and customer performance — all in one executive-level dashboard.
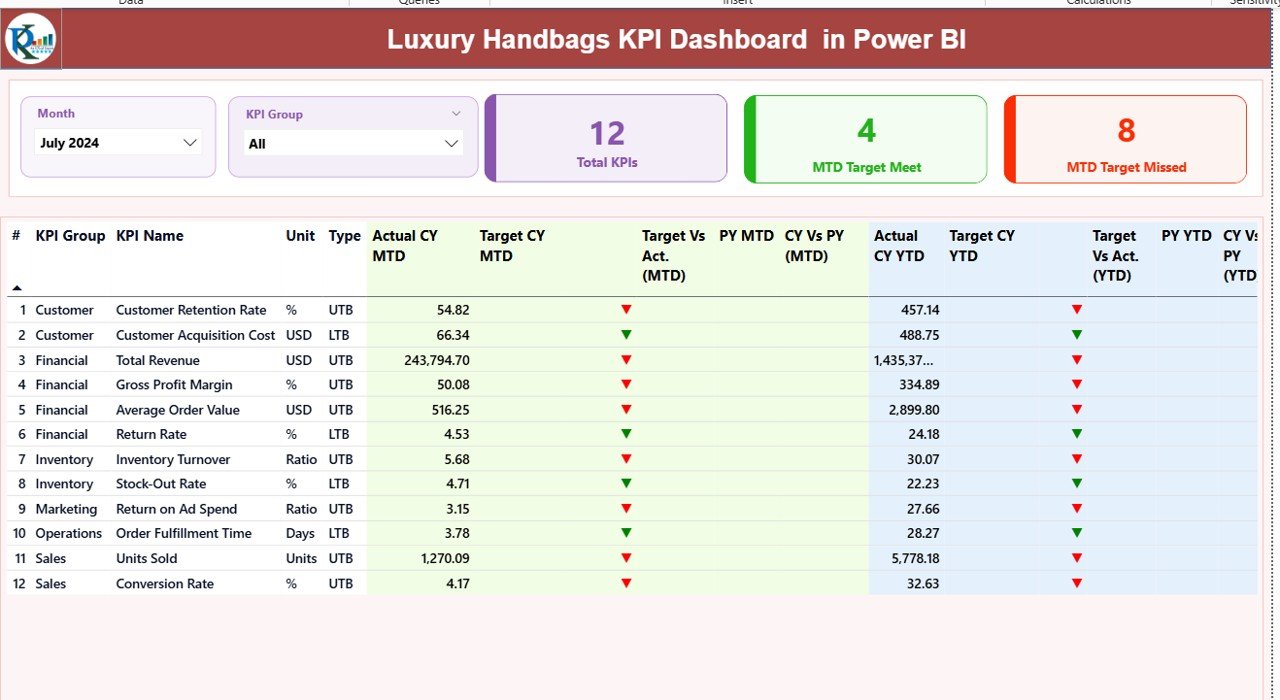
This dashboard tracks MTD (Month-to-Date) and YTD (Year-to-Date) performance, compares Actual vs Target, and analyzes Current Year vs Previous Year growth. Instead of spending hours preparing reports, you get instant clarity with smart visuals and performance indicators.
Whether you manage a boutique chain or a global luxury brand, this dashboard gives you complete performance control.
✨ Key Features of Luxury Handbags KPI Dashboard in Power BI
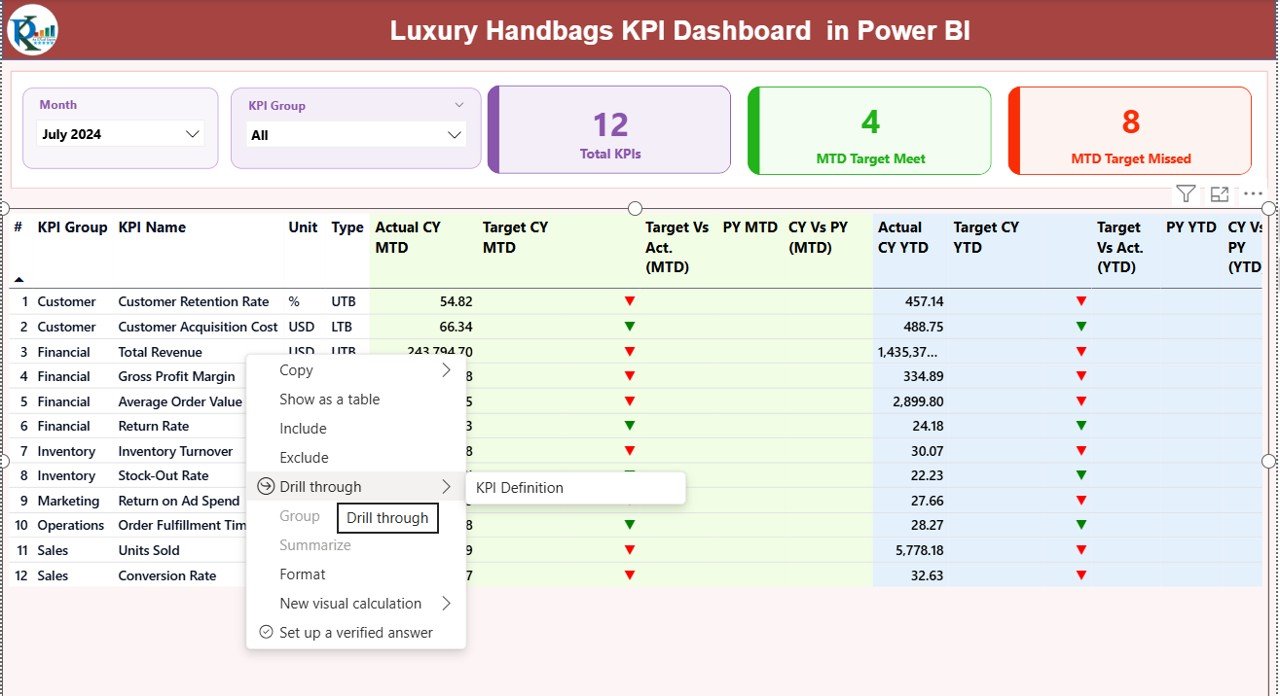
📊 Interactive Summary Page – View all KPIs in one place with dynamic slicers for Month and KPI Group.
📈 MTD & YTD Tracking – Monitor monthly and cumulative performance with clear visual comparisons.
🎯 Target vs Actual Indicators – Green and red arrows instantly show whether targets are achieved.
📅 Year-over-Year Comparison – Compare Current Year vs Previous Year performance automatically.
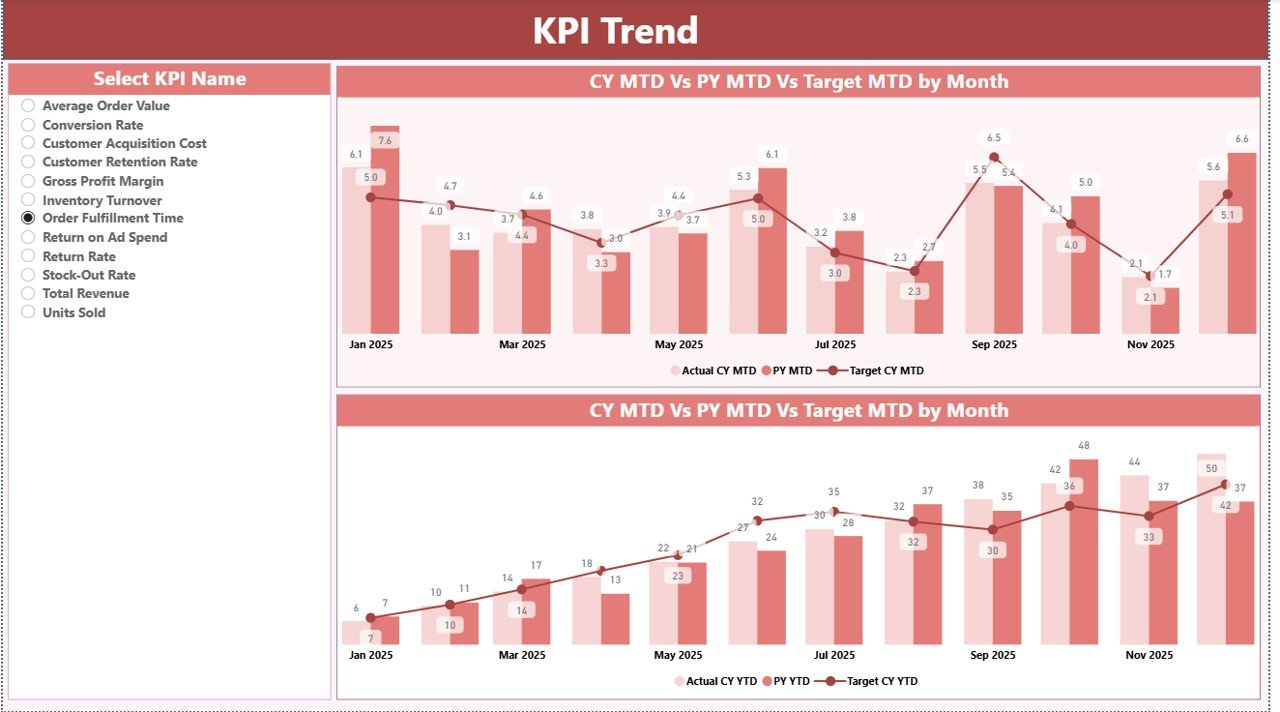
📉 KPI Trend Analysis Page – Deep-dive into individual KPIs with combo charts for MTD and YTD trends.
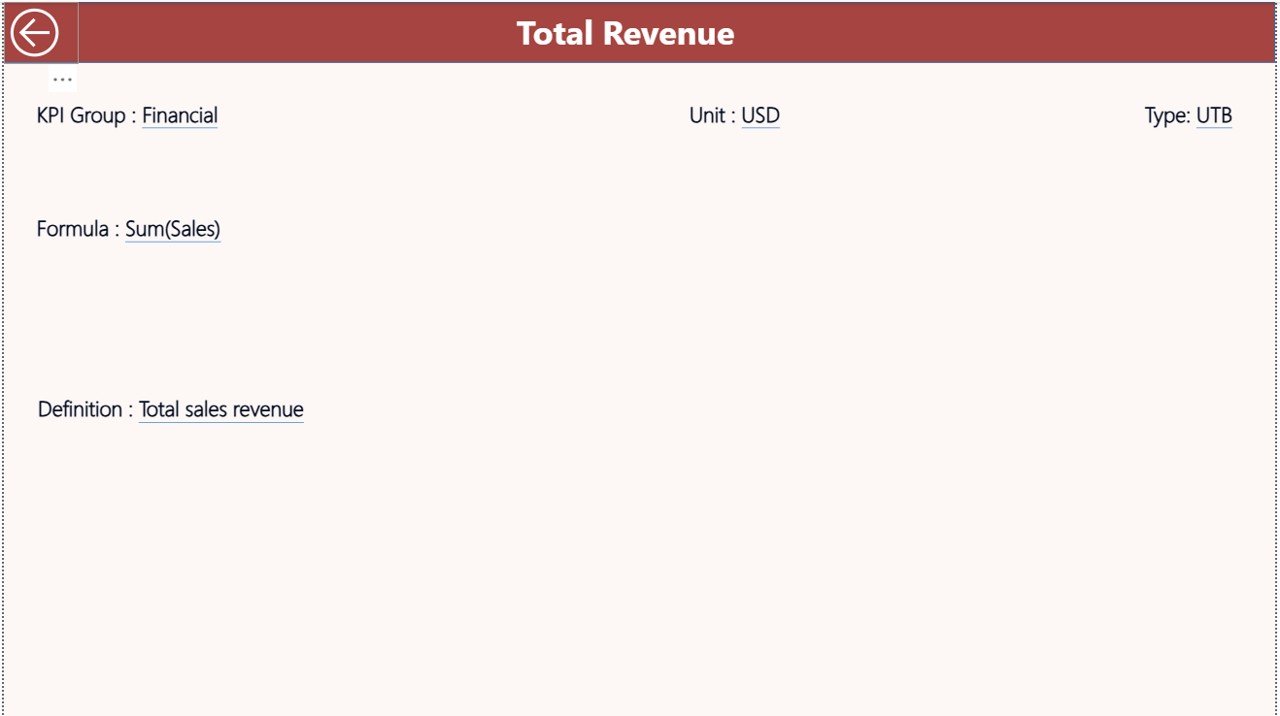
📘 Drill-Through KPI Definition Page – Instantly view KPI formula, definition, type (UTB/LTB), and group.
⚡ Automatic Data Refresh – Update the Excel file and refresh Power BI — visuals update instantly.
💼 Executive-Level Reporting – Clean, professional visuals perfect for management presentations.
📦 What’s Inside the Luxury Handbags KPI Dashboard?
When you purchase this product, you receive:
✔ Power BI Desktop (.pbix) file
✔ Structured Excel data source template
✔ Three ready-to-use dashboard pages:
-
Summary Page
-
KPI Trend Page
-
KPI Definition (Drill-Through) Page
✔ Pre-configured KPI structure with UTB and LTB logic
✔ Performance comparison logic for:
-
Actual vs Target
-
Current Year vs Previous Year
✔ Professional visual indicators and slicers
Everything is already connected and structured — you simply update the Excel sheets and refresh.
🚀 How to Use the Luxury Handbags KPI Dashboard
Using this dashboard is simple and does not require advanced Power BI expertise.
Step 1: Fill the Excel data sheets
-
Input_Actual (MTD & YTD values)
-
Input_Target (Target values)
-
KPI Definition (Formula, Type, Group, Unit)
Step 2: Open the Power BI file
Step 3: Click Refresh
That’s it! All visuals update automatically.
You can filter by Month or KPI Group, drill through to see KPI definitions, and analyze performance trends instantly.
🎯 Who Can Benefit from This Luxury Handbags KPI Dashboard?
👗 Luxury fashion brands
🛍 Premium handbag retailers
🌍 International distributors
🛒 E-commerce fashion stores
🏬 Multi-store boutique chains
📈 Fashion business analysts
💼 Senior management & decision-makers
Even emerging luxury brands can use this dashboard to build a strong performance monitoring system.
Why This Dashboard Is a Game-Changer
Luxury brands operate with high product value and premium margins. A small dip in performance can impact profitability significantly. This dashboard reduces reporting time by more than 60%, improves margin tracking, and supports data-driven decisions.
Instead of guessing performance trends, you gain clarity. Instead of manual reporting, you get automation. Instead of confusion, you get control.
If you want to increase profitability, optimize inventory, track campaign ROI, and compare store performance effectively — this dashboard is your smart business companion.
Click here to read the Detailed blog post
Watch the step-by-step video tutorial:


