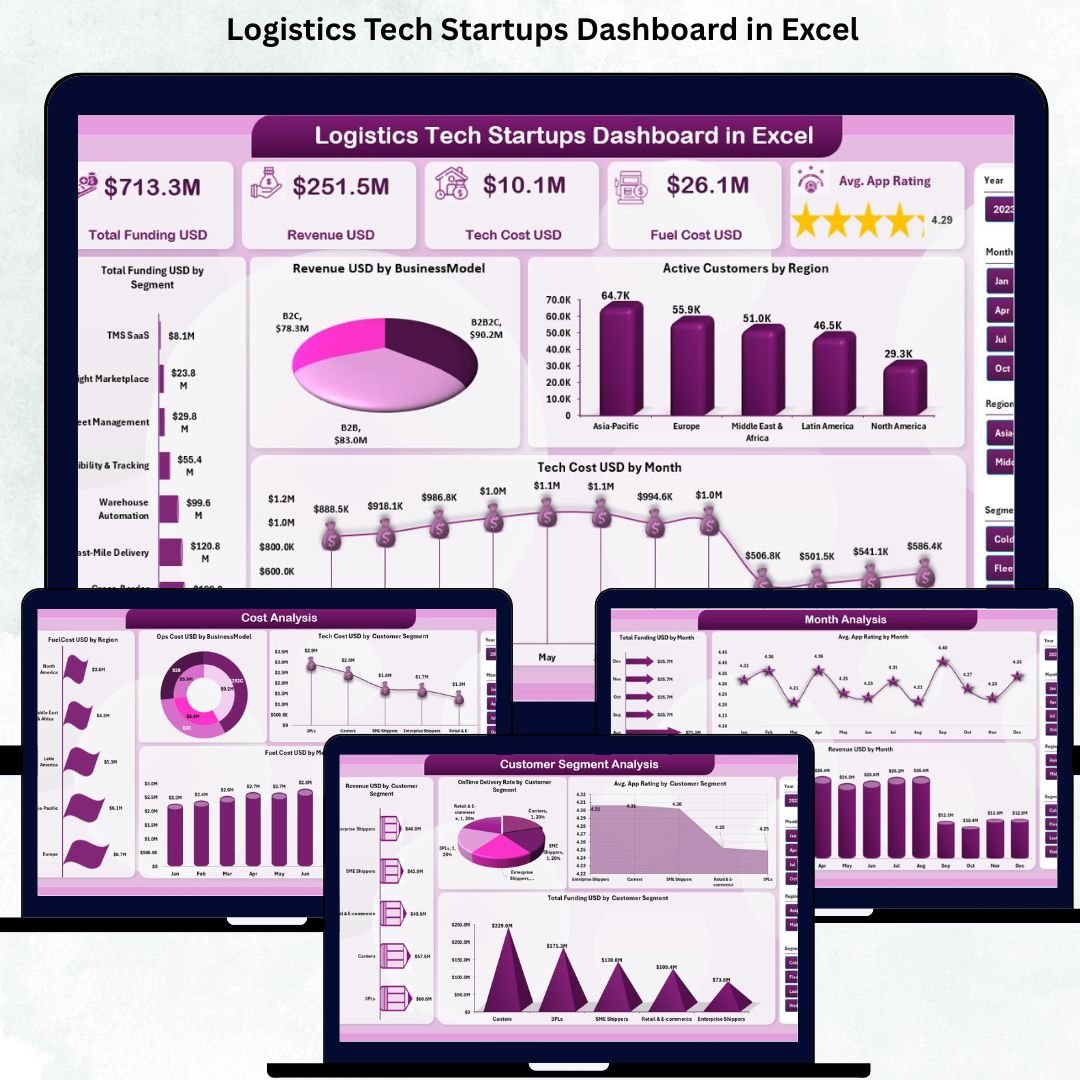
Logistics tech startups work in a fast-paced and highly competitive environment. Logistics Tech Startups Dashboard in Excel They manage funding, revenue, customer satisfaction, delivery performance, app ratings, fuel expenses, and regional operations simultaneously. As the business grows, managing these KPIs through traditional spreadsheets becomes slow, complicated, and risky. Manual reporting delays decisions and makes it hard to understand what’s really happening inside the business.
This is where the Logistics Tech Startups Dashboard in Excel becomes a breakthrough tool. Designed specifically for modern logistics and delivery businesses, this dashboard converts raw operational data into meaningful insights. Logistics Tech Startups Dashboard in Excel It gives founders, operations teams, and investors a clear picture of funding status, customer behavior, delivery speed, cost distribution, and growth trends—all inside Excel without any technical setup.
Logistics Tech Startups Dashboard in Excel with simple sheet navigation, right-side slicers, dynamic KPI cards, and clean charts, this dashboard helps you stay ahead of your competitors and scale your business confidently.
Let’s explore everything included in this powerful analytics tool 👇
✨ Key Features of the Logistics Tech Startups Dashboard in Excel
🚚 Track All Logistics Startup KPIs in One Dashboard
Monitor Total Funding, Revenue, Tech Cost, Fuel Cost, App Rating, Delivery Speed, Customer Segments, and Regional Metrics instantly.
🧭 Smart Page Navigator for Fast Access
Switch between all dashboard pages using the left-side Page Navigator—no need to scroll through sheet tabs.
📅 Right-Side Slicers for Real-Time Filtering
Filter data by month, region, segment, business model, or customer group to explore insights in detail.
💰 Powerful KPI Cards on the Overview Page
See the most important metrics within seconds:
-
Total Funding
-
Revenue
-
Tech Cost
-
Fuel Cost
-
Average Satisfaction Rating
📊 Rich Visual Analytics
Each page includes high-impact charts that help you detect trends, compare performance, and identify opportunities.
📝 Beginner-Friendly Excel Workflow
Update the Data Sheet → Dashboard auto-adjusts → Review insights instantly.
🔧 Fully Customizable Layout
Add new segments, regions, KPIs, or charts as your startup grows.
📦 What’s Inside the Logistics Tech Startups Dashboard in Excel
Your Excel dashboard includes five fully structured analytical pages, each designed to give you a complete understanding of your business.
✔ Overview Page – Your Startup’s Performance Snapshot
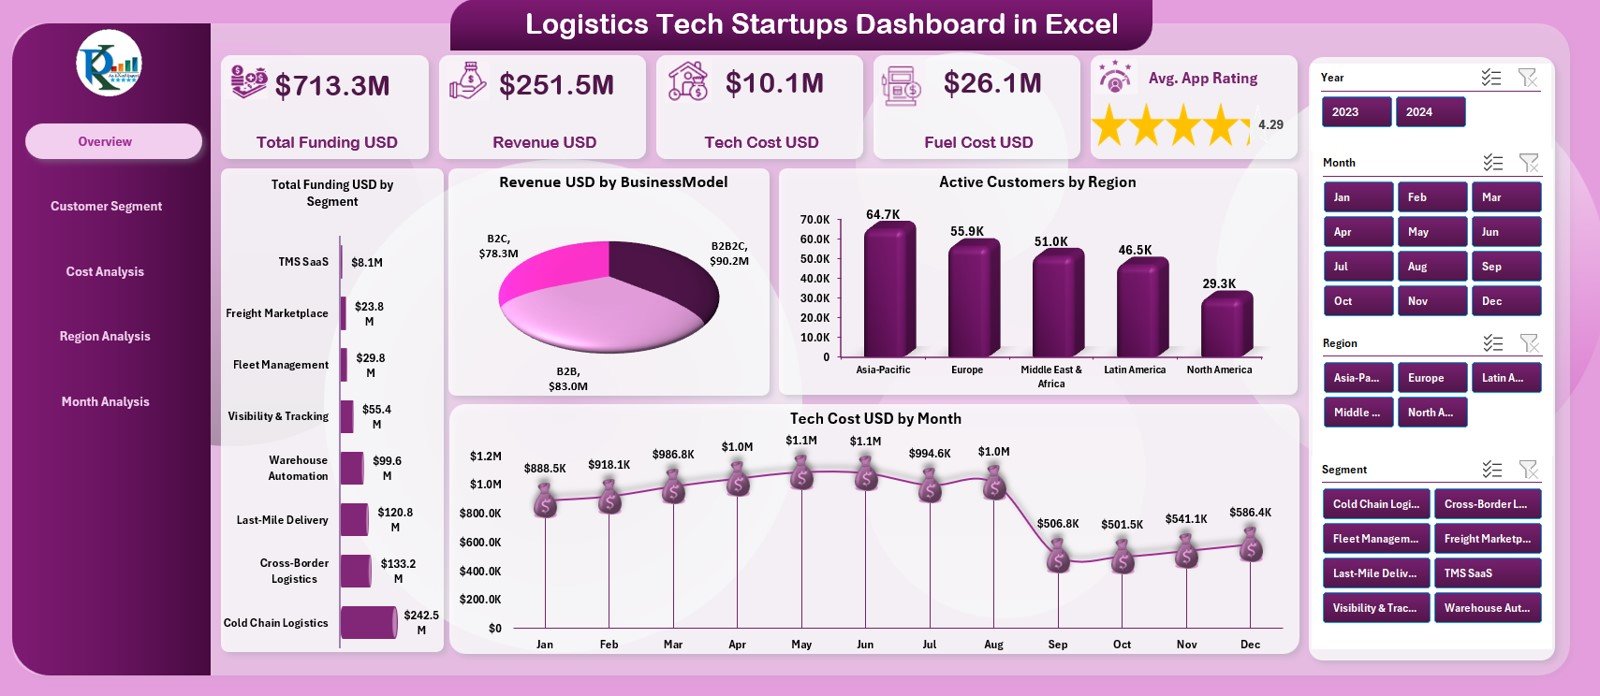
This is the main dashboard for viewing business health. It includes slicers and five KPI cards showing funding, revenue, tech cost, fuel cost, and satisfaction.
Charts on this page include:
-
Total Funding by Segment
-
Revenue by Business Model
-
Active Customers by Region
-
Tech Cost by Month
This page is ideal for quick performance review meetings and investor discussions.
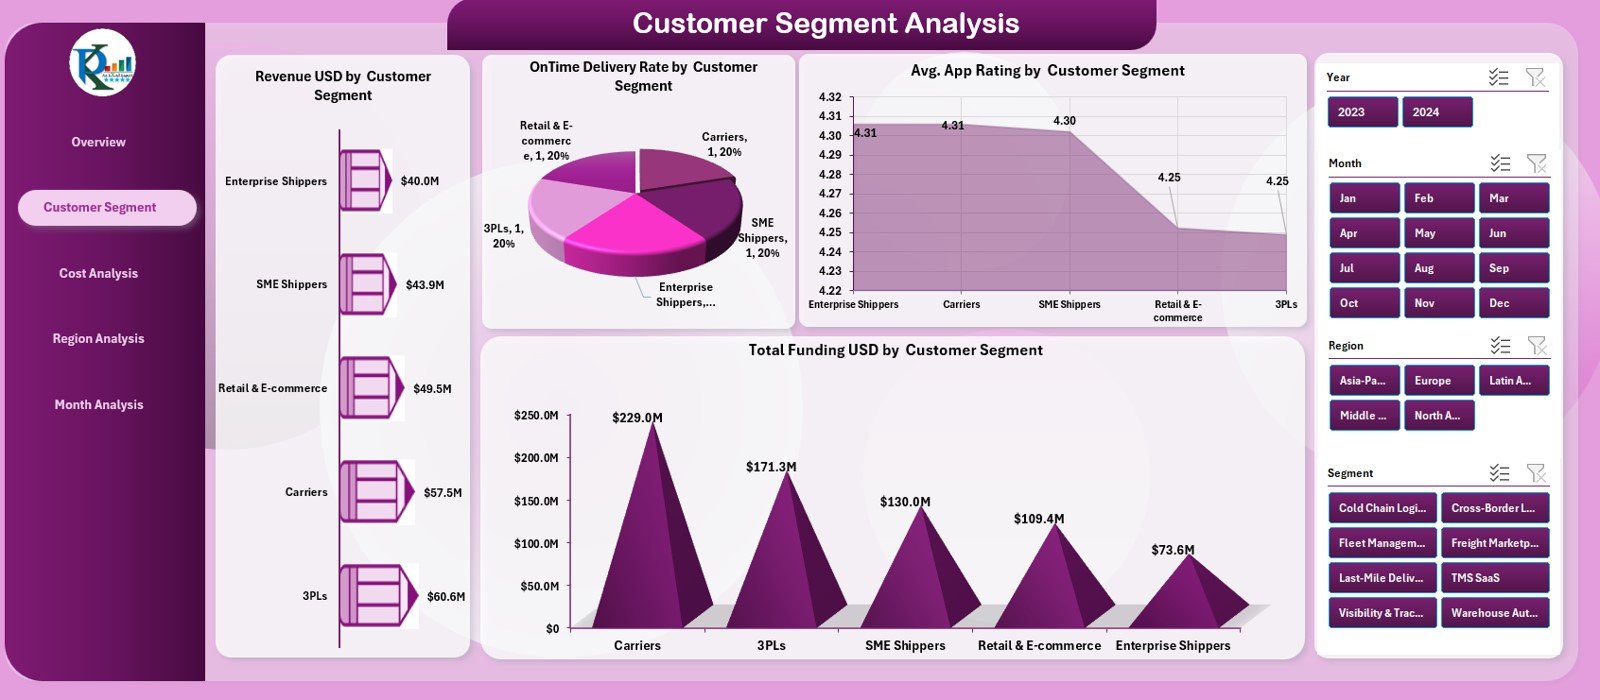
✔ Customer Segment Analysis Page
Understand customer behavior with four powerful charts:
-
Revenue by Customer Segment
-
On-Time Delivery Rate (%)
-
Average App Rating
-
Total Funding by Segment
This helps improve satisfaction, delivery quality, and personalized offerings.
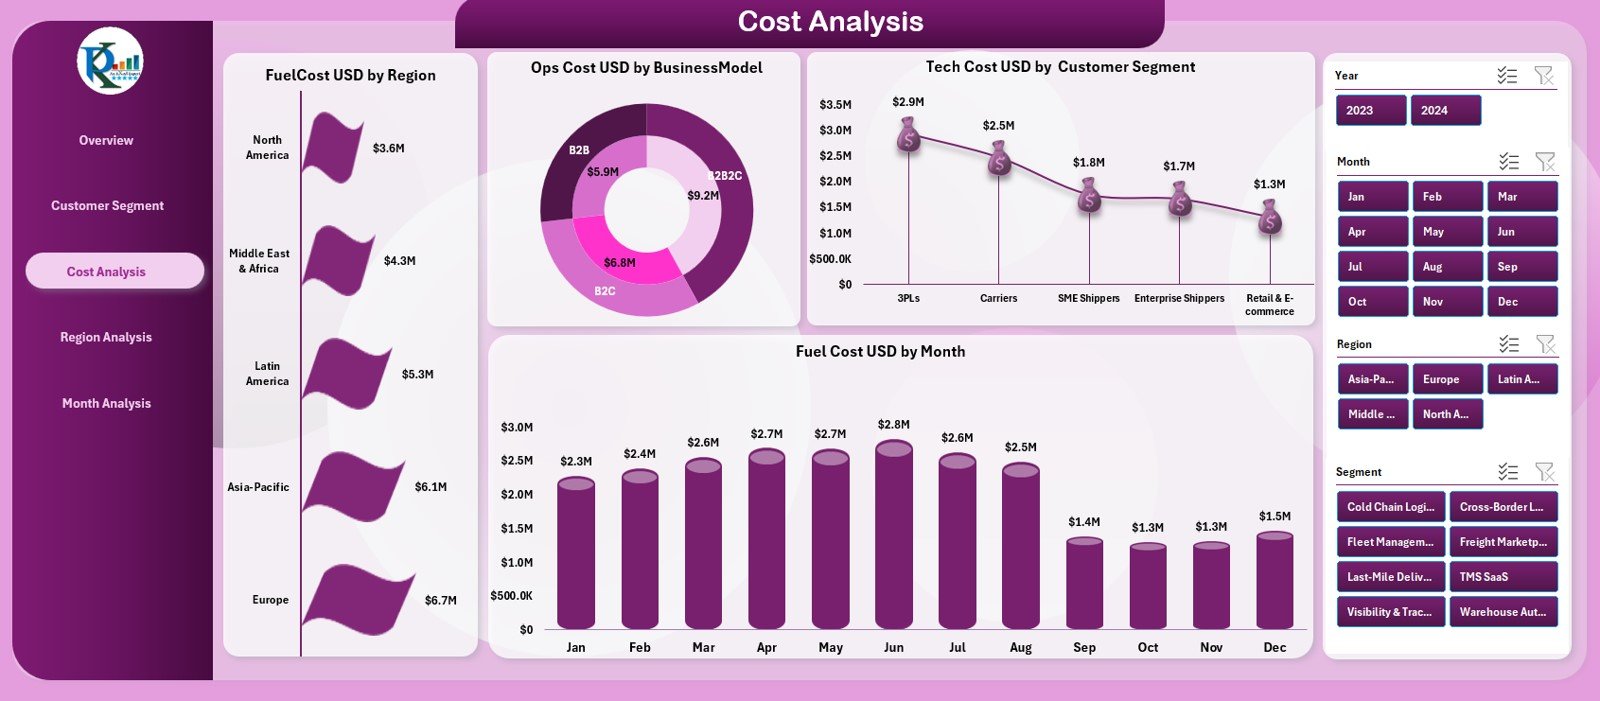
✔ Cost Analysis Page
Analyze cost structure across business models, regions, and months.
Charts include:
-
Fuel Cost by Region
-
Ops Cost by Business Model
-
Tech Cost by Segment
-
Fuel Cost by Month
Use this page to control costs, optimize efficiency, and improve profitability.
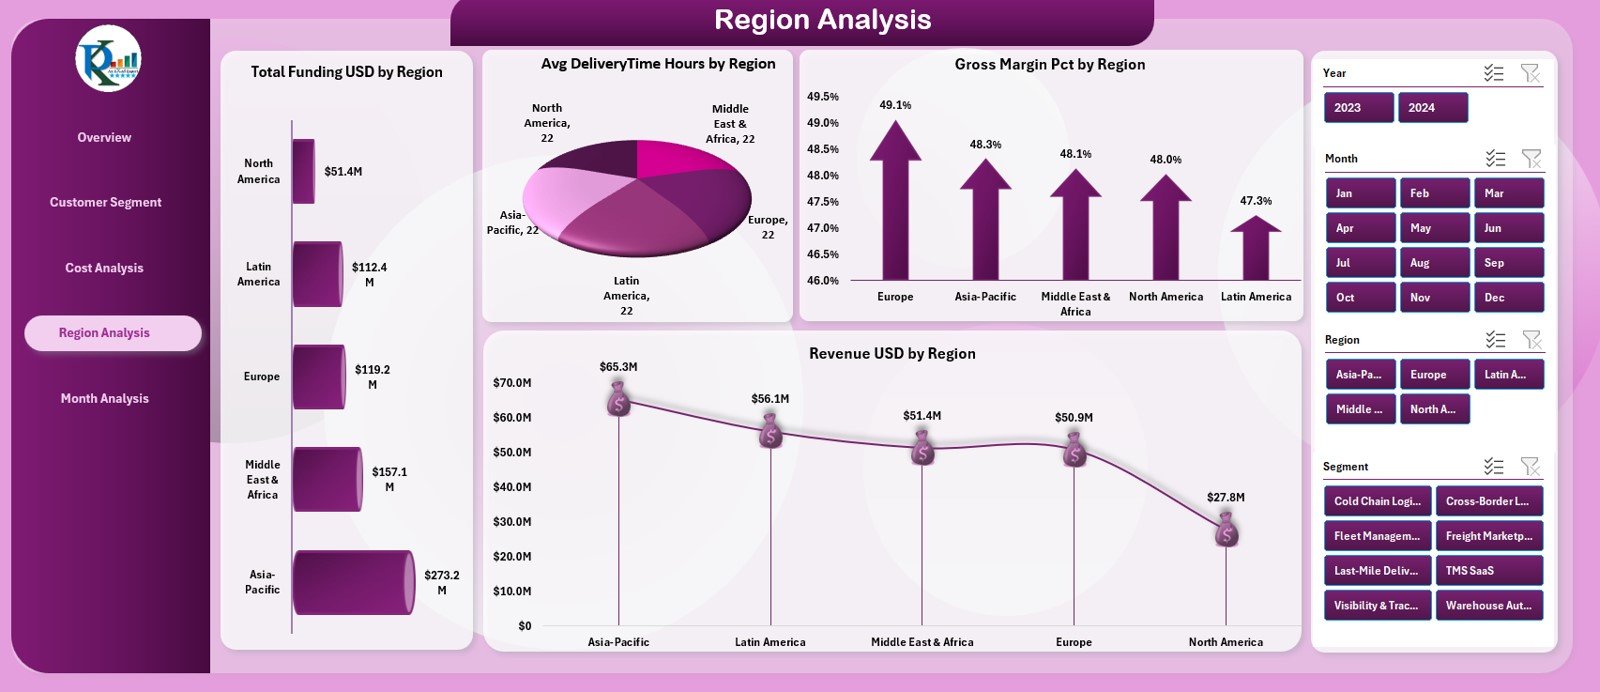
✔ Region Analysis Page
Compare performance across different geographical areas using:
-
Funding by Region
-
Average Delivery Time
-
Gross Margin %
-
Revenue by Region
This helps startups identify high-performing regions and improve weak-performing areas.
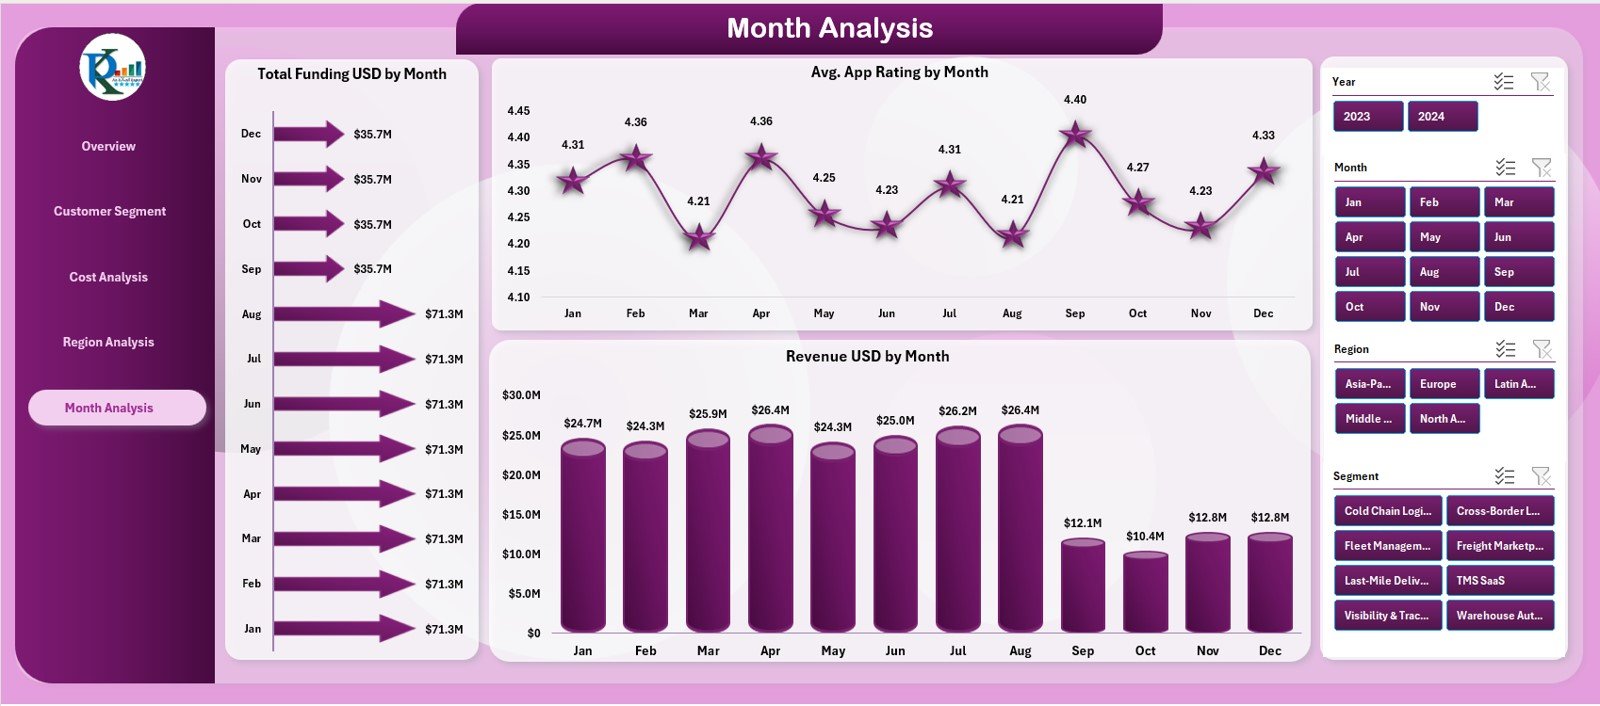
✔ Monthly Trends Page
Track the growth journey of your startup with three trend charts:
-
Total Funding by Month
-
Average App Rating by Month
-
Revenue by Month
This page is perfect for investor updates, strategic planning, and quarterly reviews.
Additionally, the dashboard includes Data Sheet and Support Sheet for backend calculations, mapping tables, and data storage—ensuring accuracy and clean reporting.
🛠 How to Use the Logistics Tech Startups Dashboard in Excel
Using this dashboard is simple and intuitive:
➤ Step 1: Update the Data Sheet
Enter monthly funding, revenue, cost, delivery, and rating values.
➤ Step 2: Open the Dashboard Sheets
Use slicers to switch between segments, models, regions, and months.
➤ Step 3: Review KPI Cards
Get instant insights into financial and operational health.
➤ Step 4: Use Analytical Pages
Explore customer behavior, regional performance, cost patterns, and month-wise trends.
➤ Step 5: Present Insights in Meetings
Use slicers and charts during presentations for a clean, interactive experience.
With this workflow, you get a complete business monitoring system inside Excel.
👥 Who Can Benefit from This Dashboard
This dashboard is perfect for:
🚚 Logistics tech startups
📦 Last-mile delivery companies
📱 On-demand delivery platforms
🛵 Hyperlocal delivery services
🏢 E-commerce logistics partners
🚗 Fleet management startups
📊 Tech-enabled mobility businesses
💼 Investors & analysts
If your business depends on delivery speed, customer satisfaction, funding, revenue, or operational efficiency—this dashboard is your essential tool.


Reviews
There are no reviews yet.