



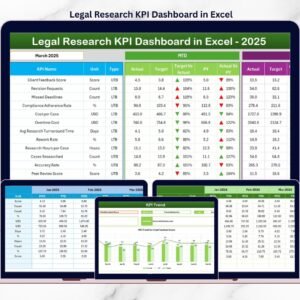
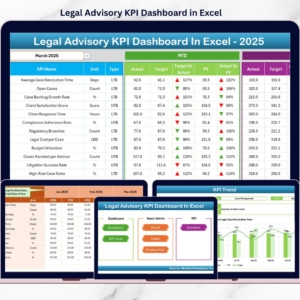
The Legal KPI Dashboard in Excel is a ready-made KPI Dashboard in Excel for law firms, corporate legal departments and legal consultants. It tracks litigation, case management, financial, compliance, client relations and risk management KPIs in one place. You get clear MTD and YTD views of actual vs. target and previous-year results, so decisions rest on data rather than guesswork.
The template is customizable, automated and easy to use. Enter your monthly numbers and the dashboard updates for you. It supports law firm performance tracking without building complex formulas yourself.

Key Features of the Legal KPI Dashboard in Excel
- MTD and YTD performance views: See Month-to-Date and Year-to-Date results for every legal KPI.
- Actual vs. target comparison: Color-coded indicators show at a glance where performance is on track and where it is falling short.
- Year-over-year comparison: Previous-year numbers help you measure performance growth over time.
- KPI trend analysis: Pick any KPI from a dropdown list to see its historical trend in charts and visual indicators.
- Broad legal metrics coverage: Tracks litigation, case management KPIs, financial performance, compliance, client relations and risk management.
- Fully automated and dynamic: Enter data once and the dashboard refreshes. No complex formulas needed.
- Customizable KPIs: Change KPI categories, targets, inputs and visualizations to match how your team works.
- User-friendly navigation: A Home sheet with navigation buttons takes you to every section quickly.
What’s Inside: Sheet-by-Sheet Breakdown
This Excel-based dashboard is organised into seven sections, each giving a different view of your legal operations.
1. Home Sheet: Easy Navigation
- Acts as the main menu, with quick access to all sections.
- Navigation buttons let you move between sheets easily.
2. Legal KPI Dashboard: The Heart of Your Data
- Displays Month-to-Date (MTD) and Year-to-Date (YTD) performance.
- Highlights actual vs. target performance with color-coded indicators.
- Tracks legal KPIs across Litigation, Case Management, Financial Performance, Compliance, Client Relations and Risk Management.
3. KPI Trend Sheet: Track Historical Performance
- Select a KPI from the dropdown list to view its trend.
- Shows the KPI name and group, the formula used for calculation and the unit of measurement.
- Displays the performance trend using charts and visual indicators.
4. Actual Numbers Sheet: Data Entry
- Enter monthly performance data for each legal KPI.
- The dashboard updates automatically for instant performance tracking.
5. Target Sheet: Set and Compare Goals
- Define monthly and yearly targets for each KPI.
- Compare actual vs. expected results.
- Gives you a benchmark for evaluating success rates.
6. Previous Year Numbers Sheet: Year-over-Year Comparison
- Enter last year’s data to track performance growth.
- Helps you spot trends and improvements over time.
7. KPI Definition Sheet: Clarity in Performance Metrics
- A detailed breakdown of each KPI, covering its definition, its calculation formula and how to read it (Lower is better / Higher is better).
- Keeps calculations consistent across all data points.
What’s Included
- Excel file: fully editable and automated
- Predefined legal KPIs: easy to customize
- Interactive dashboard with charts and tables
- Instruction guide for easy setup
One-time purchase, lifetime access: there is no subscription. You buy once and can use the Legal KPI Dashboard for as long as you need it.
Who Is This Dashboard For?
- Law firms and legal teams that want structured law firm performance tracking
- Corporate legal departments reporting to management
- Legal consultants and advisors who monitor client or engagement metrics
- Compliance and risk management teams
- Legal analysts and operations managers who need reliable legal metrics
Why Choose This Legal KPI Dashboard?
- Saves time: you spend less time compiling reports and more time on strategy.
- Supports data-driven decisions: clear performance insights help improve efficiency across legal operations.
- Easy to update: the simple input sheets keep monthly maintenance quick.
How to Use It
- Open the Excel file and start on the Home sheet to see every section.
- Review the KPI Definition sheet and adjust the KPIs, formulas or units to suit your firm.
- Set your goals on the Target sheet, with monthly and yearly targets for each KPI.
- Add last year’s results on the Previous Year Numbers sheet so you can compare year over year.
- Enter monthly actuals on the Actual Numbers sheet.
- Analyse the results on the Dashboard (MTD and YTD) and the KPI Trend sheet.
Click here to read the detailed blog post.
Visit our YouTube channel for step-by-step video tutorials: Youtube.com/@PKAnExcelExpert
Frequently Asked Questions
What KPIs does the Legal KPI Dashboard in Excel track?
It comes with predefined legal KPIs covering litigation, case management, financial performance, compliance, client relations and risk management. You can customize all of them.
Does it show MTD and YTD results?
Yes. The main dashboard shows MTD and YTD performance with actual vs. target comparison and color-coded indicators.
Can I change the KPIs and targets?
Yes. The file is fully editable. You can modify KPI categories, set your own monthly and yearly targets, and adjust inputs and visualizations.
Do I need advanced Excel skills or complex formulas?
No. The dashboard is fully automated. You enter monthly data in the Actual Numbers sheet and the dashboard updates itself. An instruction guide is included to help with setup.
Can I compare this year’s performance with last year’s?
Yes. The Previous Year Numbers sheet stores last year’s data so you can track year-over-year growth and trends.
Is this a subscription?
No. It is a one-time purchase with lifetime access to the template.
Last updated: October 2026
Compatibility and Requirements
- Works in Microsoft Excel desktop (Excel 2016 or later, or Microsoft 365).
- Microsoft’s guide Create a drop-down list explains the Excel feature this file is built on.
Related Legal Templates
- Legal KPI Dashboard in Google Sheets: the same KPI dashboard in Google Sheets
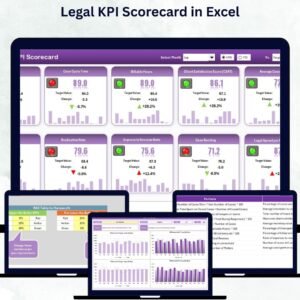
- Legal KPI Scorecard in Excel: a scorecard view of legal KPIs
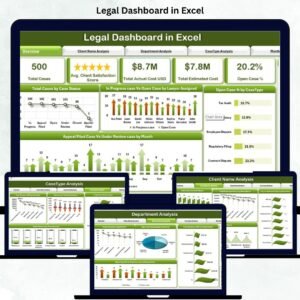
- Legal Dashboard in Excel: a multi-page legal dashboard in Excel
- Legal Compliance KPI Dashboard in Excel: KPIs for legal compliance
- KPI Dashboard Library (Excel): 15 Excel KPI dashboards in one bundle
Browse all Excel KPI dashboards or the Excel dashboards.








Reviews
There are no reviews yet.