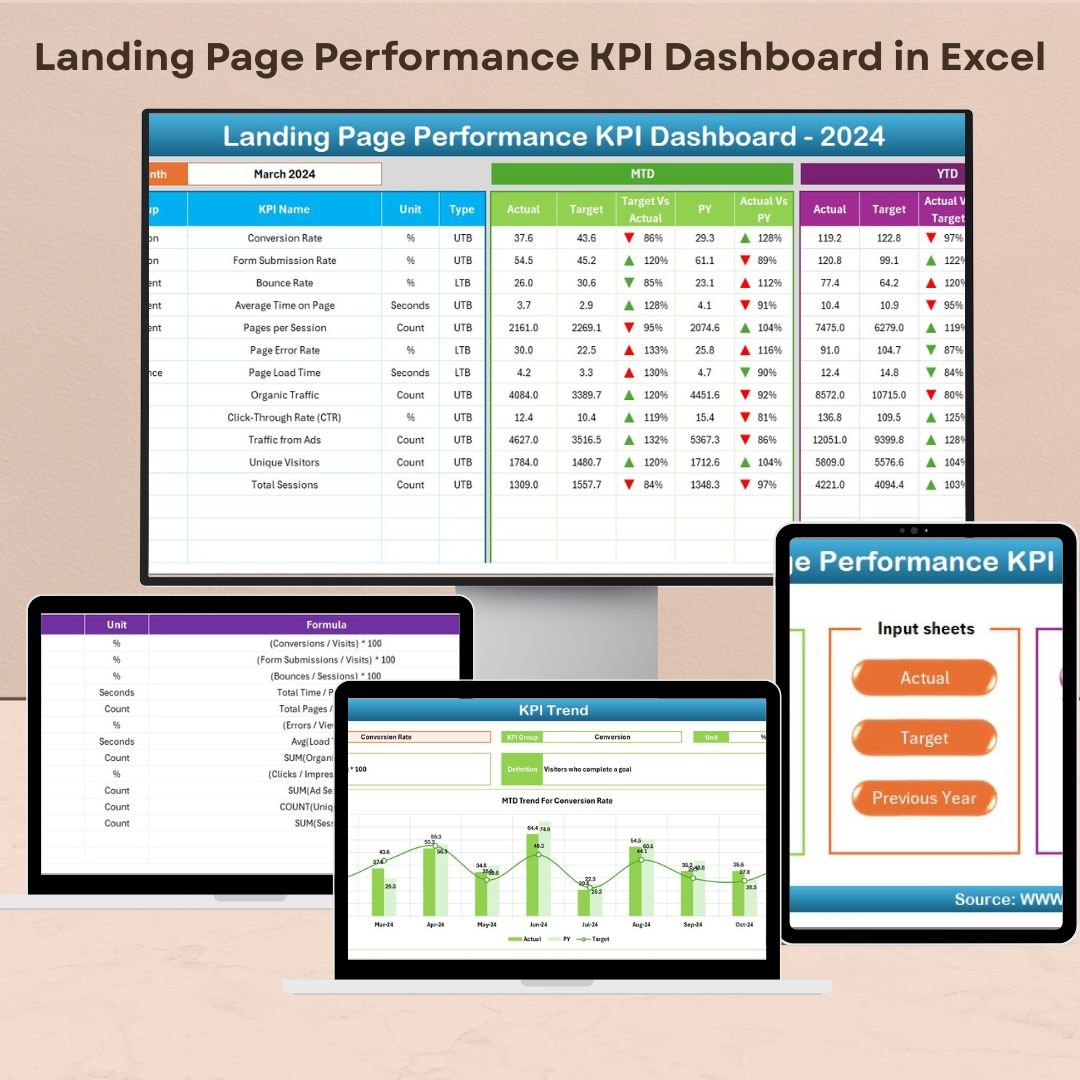
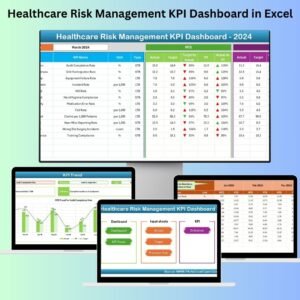
The Landing Page Performance KPI Dashboard in Excel is a powerful tool designed to help digital marketers and web analysts track, monitor, and optimize the performance of landing pages. This comprehensive dashboard provides insights into key performance indicators (KPIs) such as conversion rates, bounce rates, average time on page, and click-through rates, allowing teams to assess how well landing pages are performing and make data-driven decisions to enhance user experience and increase conversions.
By using this Excel-based dashboard, you can track real-time data, analyze performance trends, and optimize landing pages to improve conversion rates and overall campaign success.
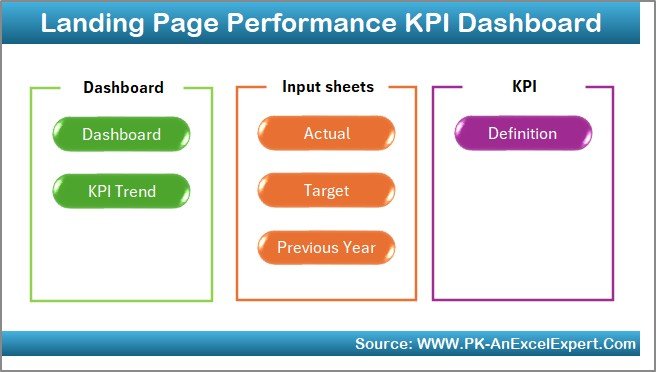
Key Features of the Landing Page Performance KPI Dashboard in Excel
📊 Comprehensive KPI Tracking
-
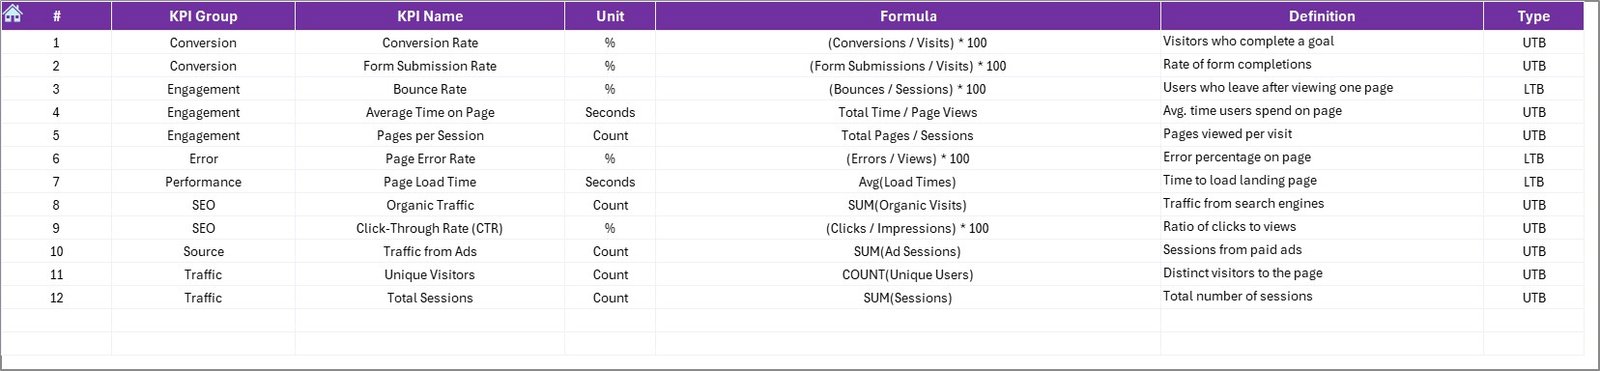
Monitor Essential Metrics: Track vital landing page KPIs like conversion rates, bounce rates, average time on page, and click-through rates.
-
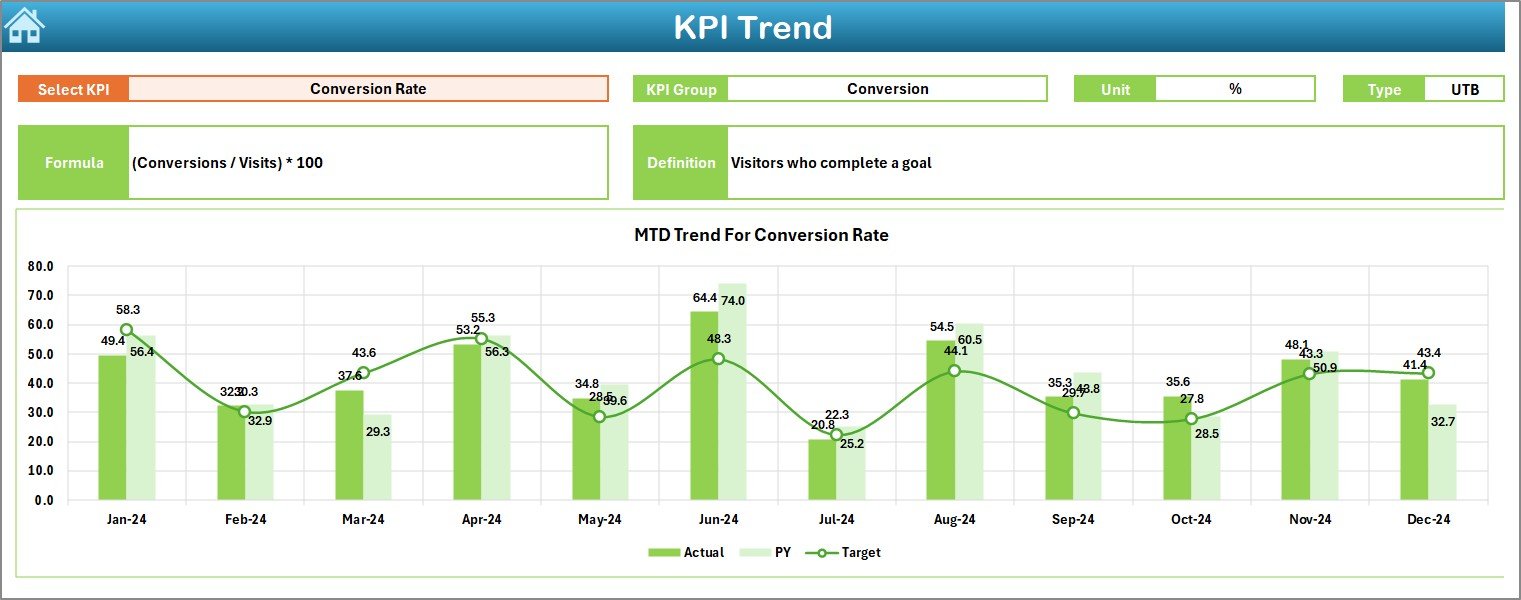
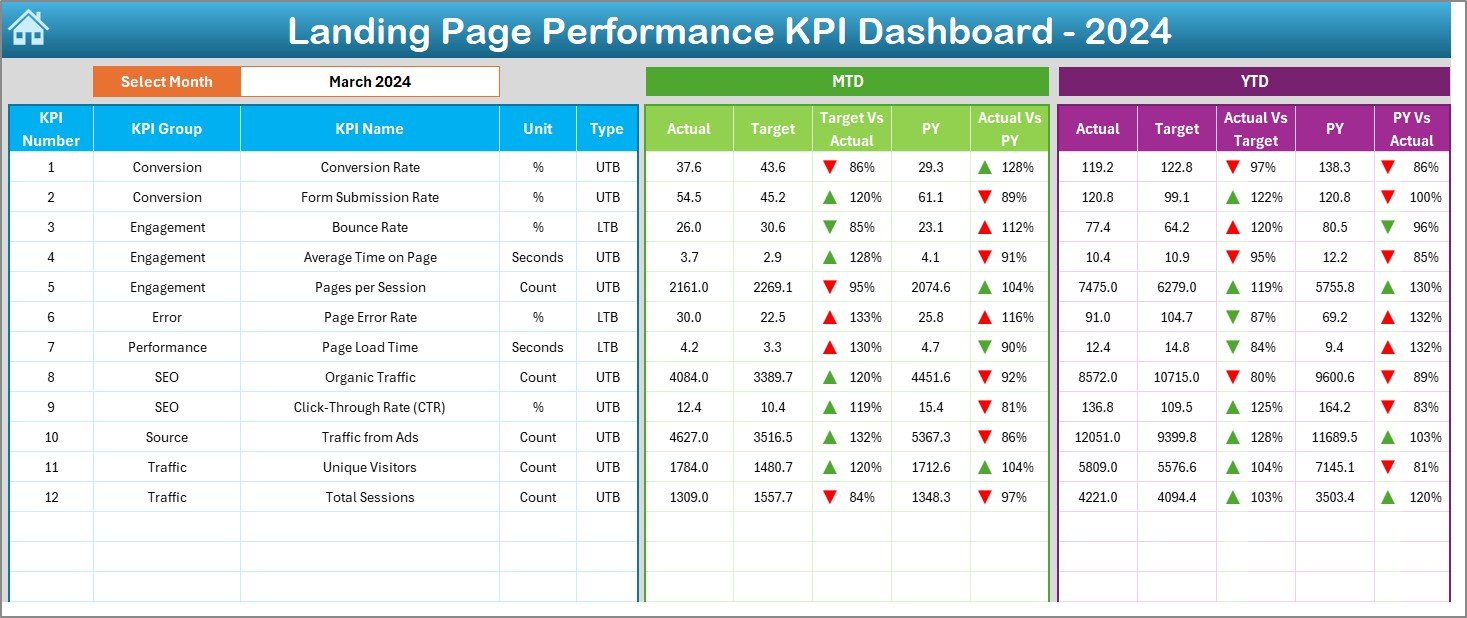
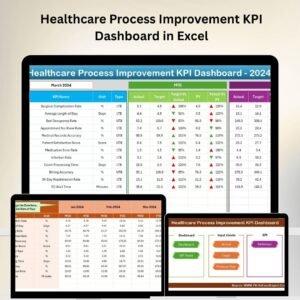
Real-Time Data Visualization: Visualize trends using dynamic charts, graphs, and tables, providing easy-to-understand insights into landing page performance.
📈 Customizable Metrics
-
Tailor to Your Needs: Customize the dashboard to track metrics that align with your campaign objectives, allowing you to focus on what matters most for your business.
-
Data Integration: Easily integrate data from various analytics tools and platforms to ensure your dashboard reflects real-time performance.
🔧 User-Friendly Interface
-
Easy to Use: Designed with user experience in mind, this Excel dashboard is intuitive, even for users with minimal technical expertise.
-
Flexible Layout: Modify the dashboard layout to match your specific business and campaign needs.
📅 Performance Tracking & Comparison
-
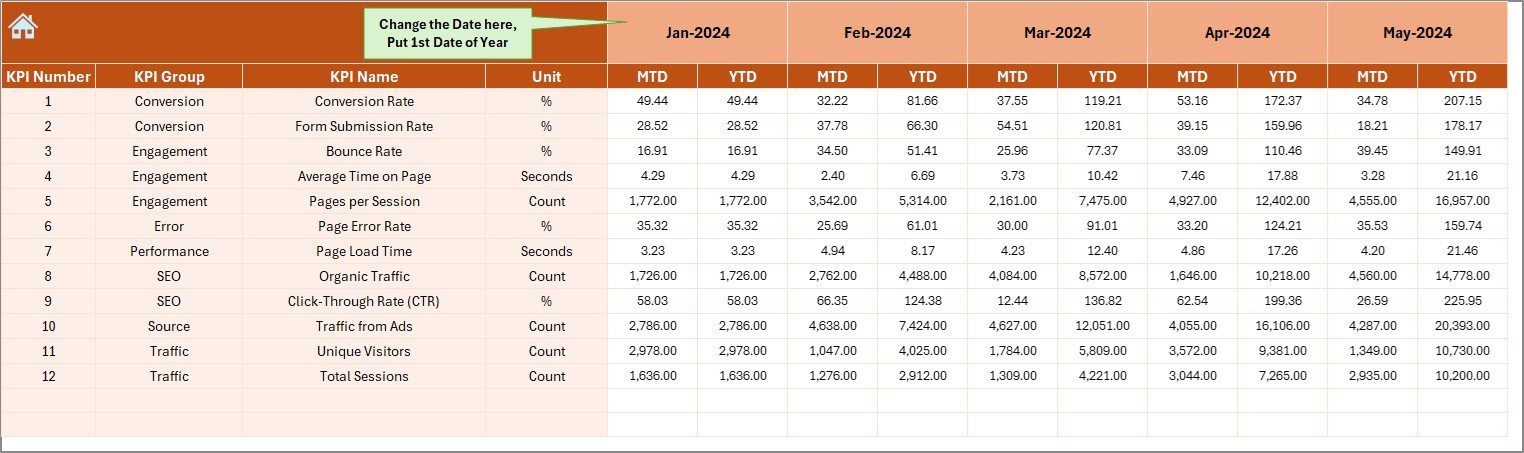
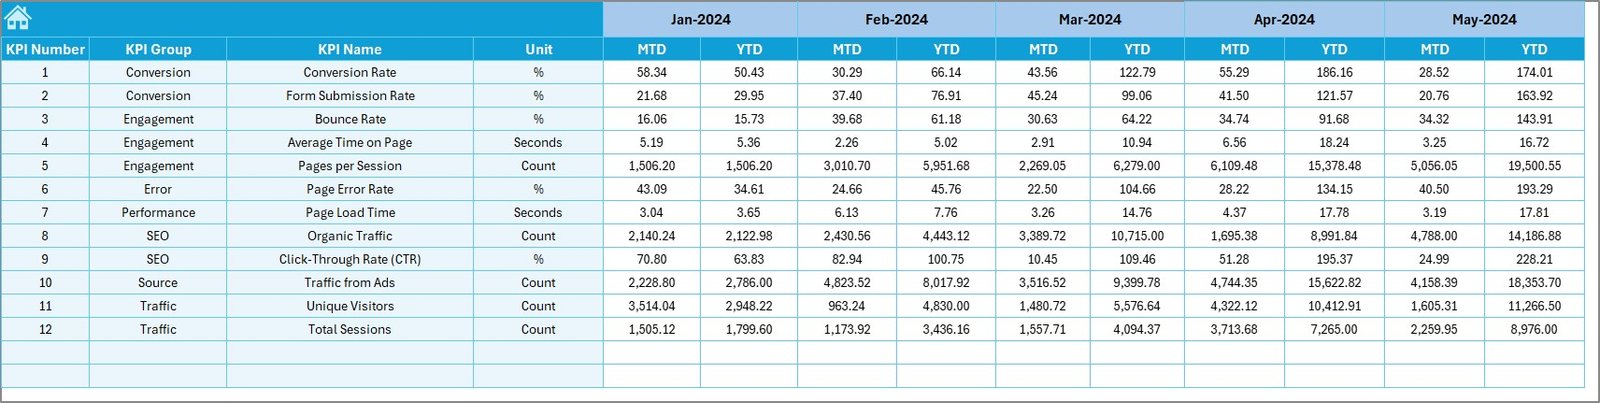
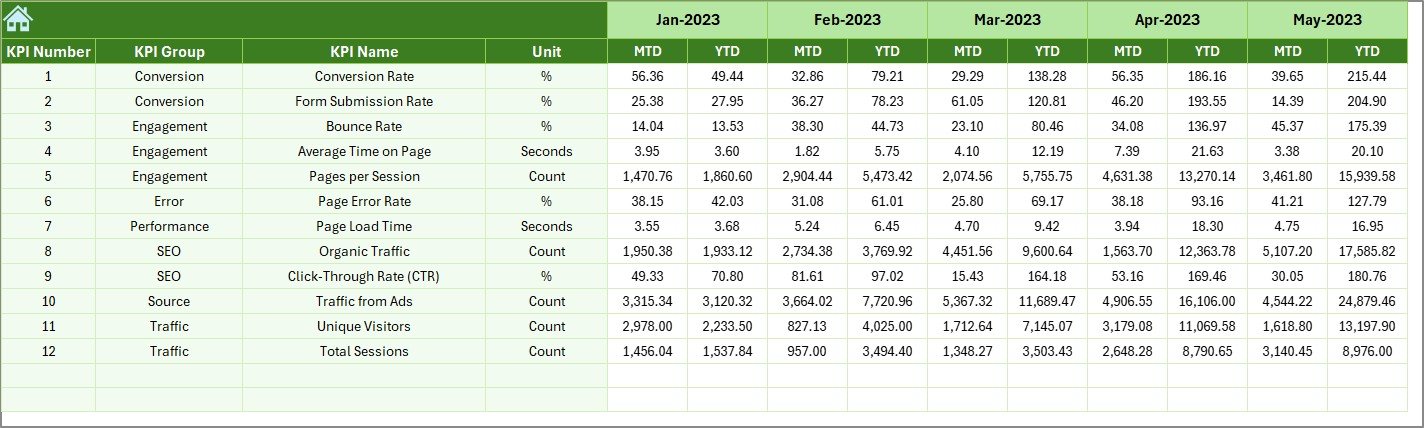
MTD & YTD Performance: Track month-to-date (MTD) and year-to-date (YTD) data to compare current performance against targets and previous periods.
-
Target vs. Actual: Analyze how your actual performance compares with set targets and identify areas for improvement.
Benefits of Using the Landing Page Performance KPI Dashboard in Excel
✅ Informed Decision-Making
With real-time access to landing page performance data, you can make better, faster decisions to optimize your campaigns and improve user experience.
✅ Increased Conversion Rates
Track key metrics like conversion rates and bounce rates to identify underperforming areas of your landing pages and make the necessary adjustments.
✅ Improved User Experience
Optimize landing pages by analyzing user behavior, engagement, and interaction data, enhancing user experience and satisfaction.
✅ Time-Saving
Automate data collection and reporting with the Excel template, saving you time and effort while ensuring accuracy.
Getting Started with Your Landing Page Performance KPI Dashboard in Excel
-
Download the Template: Get started by downloading the Landing Page Performance KPI Dashboard template.
-
Set Up Your KPIs: Define the key performance indicators that align with your landing page goals.
-
Integrate Data: Import real-time data from your analytics tools to keep the dashboard updated and accurate.
-
Monitor Performance: Use the dashboard to track and analyze the performance of your landing pages over time.
-
Make Data-Driven Decisions: Leverage the insights provided by the dashboard to improve landing page optimization and boost conversion rates.
By using the Landing Page Performance KPI Dashboard in Excel, your team can enhance landing page performance, make data-driven decisions, and drive higher conversion rates.
Click here to read the Detailed blog post
Landing Page Performance KPI Dashboard in Excel
Visit our YouTube channel to learn step-by-step video tutorials
YouTube.com/@PKAnExcelExpert


Reviews
There are no reviews yet.