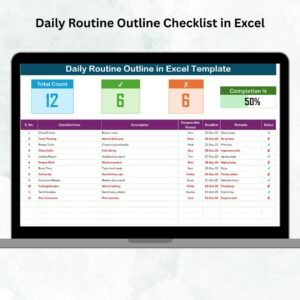
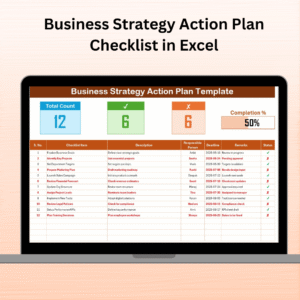
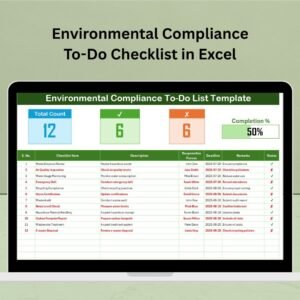
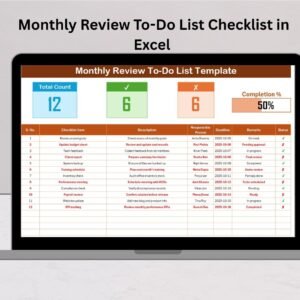
The KPI Tracking Schedule in Excel is a streamlined tool designed to help businesses and teams effectively monitor and track key performance indicators (KPIs) over time. This Excel-based schedule provides an easy-to-use framework for tracking daily, weekly, monthly, or quarterly KPIs, making it an essential tool for businesses looking to measure progress, optimize performance, and achieve set objectives.
Whether you’re tracking sales performance, customer satisfaction, production efficiency, or marketing campaign results, this KPI tracking schedule ensures that your team stays focused on critical goals and achieves targets efficiently. By visualizing and documenting KPIs in a centralized location, you can easily measure success, identify potential problems, and make data-driven decisions to propel your business forward.
Key Features of the KPI Tracking Schedule in Excel
📊 Comprehensive KPI Tracking
Track a wide variety of KPIs, such as revenue growth, customer retention, operational efficiency, and more. The customizable schedule allows you to measure any performance metric relevant to your organization.
📅 Time-Based KPI Monitoring
Monitor KPIs over different time periods, such as daily, weekly, monthly, or quarterly. This helps you keep track of short-term performance while evaluating long-term trends and progress.
📈 Customizable KPI Categories
Create and categorize KPIs according to your business’s goals and objectives. You can add custom fields and modify the schedule to fit your specific needs.
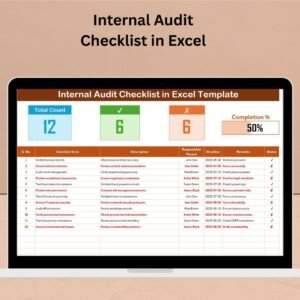
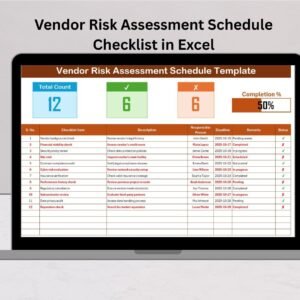
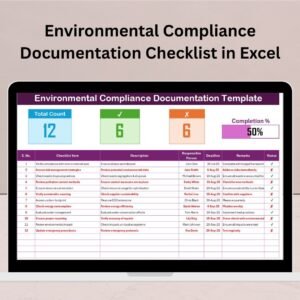
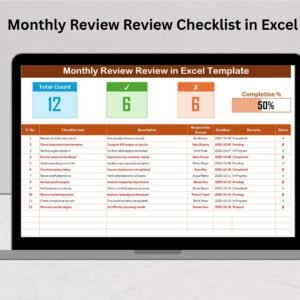
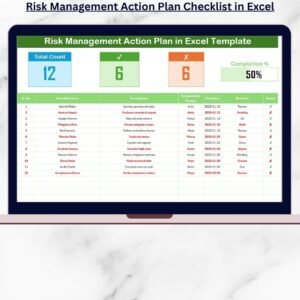
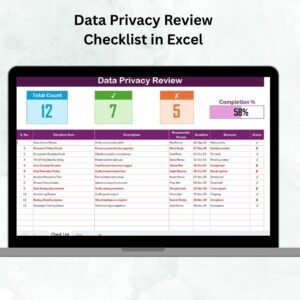
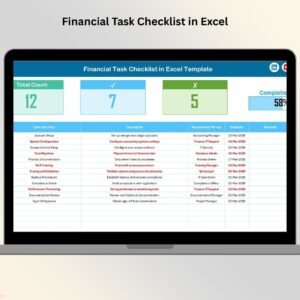
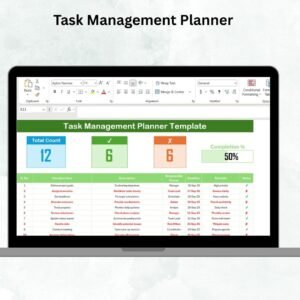
🔄 Progress Tracking & Reporting
Track the progress of each KPI and measure it against targets. Easily identify areas where performance is lagging and take corrective actions to ensure goals are met.
📝 Automated Data Entry & Updates
Effortlessly input data into the tracker with automatic updates for easy and accurate reporting. Track your KPIs in real time to make informed decisions as the data evolves.
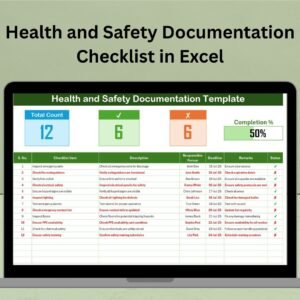
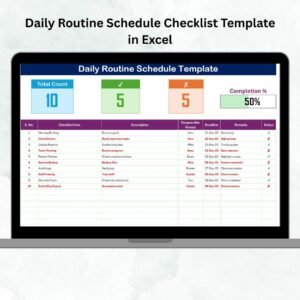
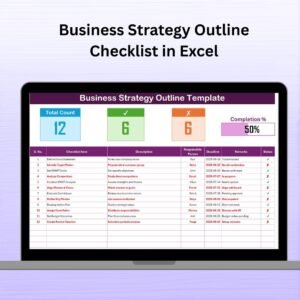
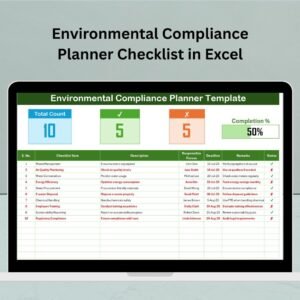
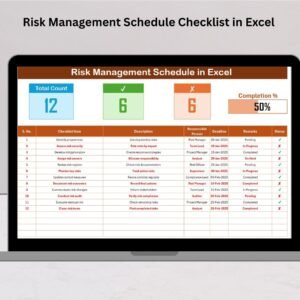
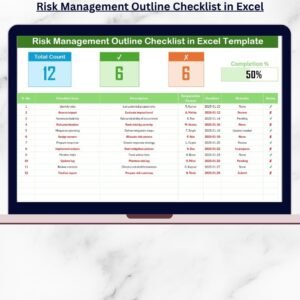
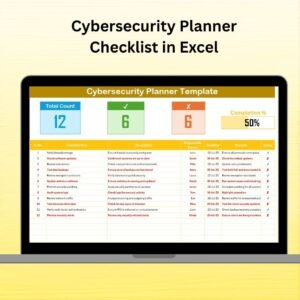
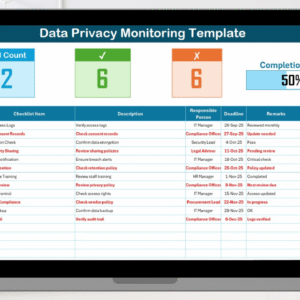
📑 Data Visualization
Visualize your KPIs with clear charts and graphs that represent your performance data in an intuitive, easy-to-understand format. Make data insights more accessible to your team and stakeholders.
Why You’ll Love the KPI Tracking Schedule in Excel
✅ Easy-to-Use Template
The Excel-based template is designed to be intuitive and easy to use. You can get started right away without needing advanced Excel skills, and it’s customizable to fit your needs.
✅ Track KPIs Over Time
Monitor performance over any given time period—daily, weekly, monthly, or quarterly. This allows you to identify trends and make strategic adjustments to stay on track.
✅ Optimize Business Performance
Measure the effectiveness of your strategies by keeping track of performance metrics. Use insights gained from KPI tracking to optimize operations, marketing, sales, and more.
✅ Increase Accountability
By assigning KPIs to specific team members, you can ensure that everyone is accountable for meeting their targets. Clear visibility into performance helps teams stay focused on their goals.
✅ Generate Reports & Visuals
With automated data entry and built-in data visualization, you can generate insightful reports and share them with stakeholders to keep everyone aligned on progress.
What’s Inside the KPI Tracking Schedule in Excel?
-
KPI Tracking: Track a variety of KPIs over different time periods.
-
Time-Based Performance Monitoring: Monitor KPIs on a daily, weekly, monthly, or quarterly basis.
-
Customizable Categories: Tailor the KPI categories and fields to suit your business needs.
-
Progress Monitoring: Track each KPI’s progress against set targets.
-
Data Visualization: Visualize performance trends with charts and graphs.
-
Automated Data Entry & Updates: Easily input data with automated tracking.
How to Use the KPI Tracking Schedule in Excel
1️⃣ Download the Template: Get instant access to the KPI Tracking Schedule in Excel.
2️⃣ Set Up Your KPIs: Define your KPIs and categories based on your business goals.
3️⃣ Track Performance: Input data and track the performance of each KPI over your chosen time period.
4️⃣ Analyze Trends: Use data visualization to track trends, identify issues, and assess performance.
5️⃣ Optimize Operations: Use insights from the tracker to make data-driven decisions and optimize your business strategies.
Who Can Benefit from the KPI Tracking Schedule in Excel?
🔹 Business Owners & Executives
🔹 Sales & Marketing Teams
🔹 Operations & Production Managers
🔹 Data Analysts & Performance Managers
🔹 HR & Employee Engagement Teams
🔹 Small & Medium Enterprises (SMBs)
🔹 Large Corporations with Multiple Departments
Ensure that you’re meeting your business goals and improving performance with the KPI Tracking Schedule in Excel. Monitor, track, and optimize KPIs to drive success and achieve your objectives.
Click here to read the Detailed blog post
Visit our YouTube channel to learn step-by-step video tutorials
Youtube.com/@PKAnExcelExpert


Reviews
There are no reviews yet.