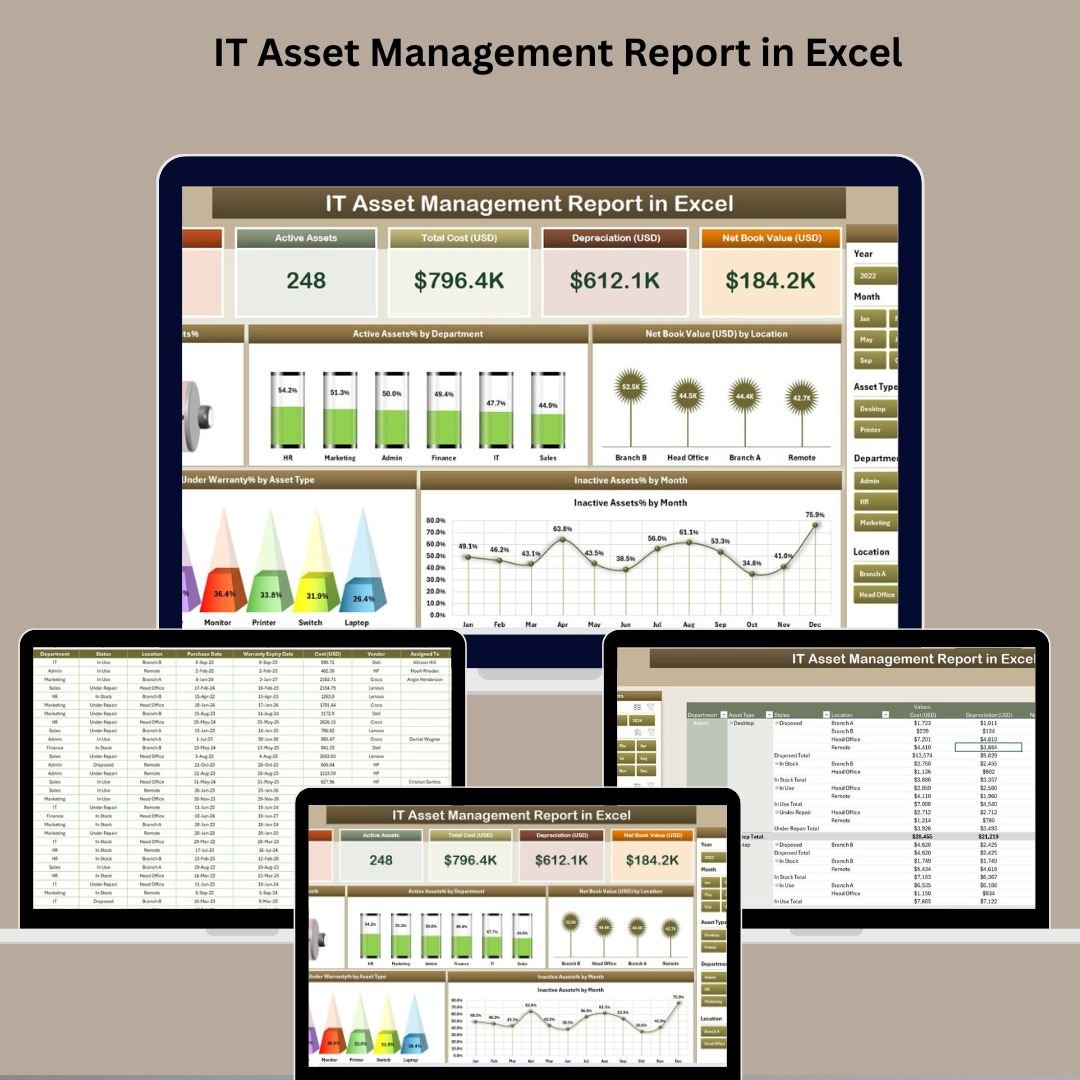
💻 Key Features of IT Asset Management Report in Excel
📊 All-in-One IT Asset Tracking System
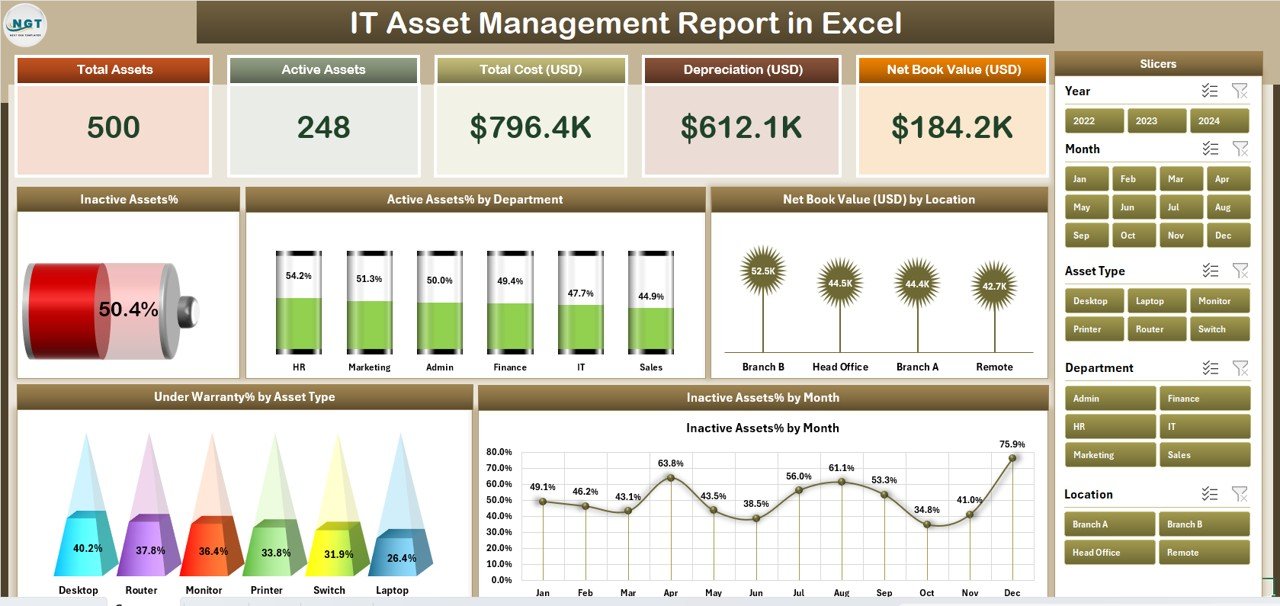
From laptops and servers to software licenses and peripherals—track all your IT infrastructure in one dynamic Excel report. Gain clarity on asset lifecycle, department-wise allocation, warranty status, and book value.
📋 3 Powerful Pages + Support Sheet
This dashboard includes a Summary Page, Detailed Report Page, and Data Sheet, all supported by a Support Sheet with dropdowns for error-free data entry.
🎯 KPI Cards for Instant Insight
-
🖥️ Total Assets
-
✅ Active Assets %
-
❌ Inactive Assets %
-
🛡️ Under Warranty Assets
-
💰 Net Book Value (USD)
These cards keep decision-makers informed at a glance.
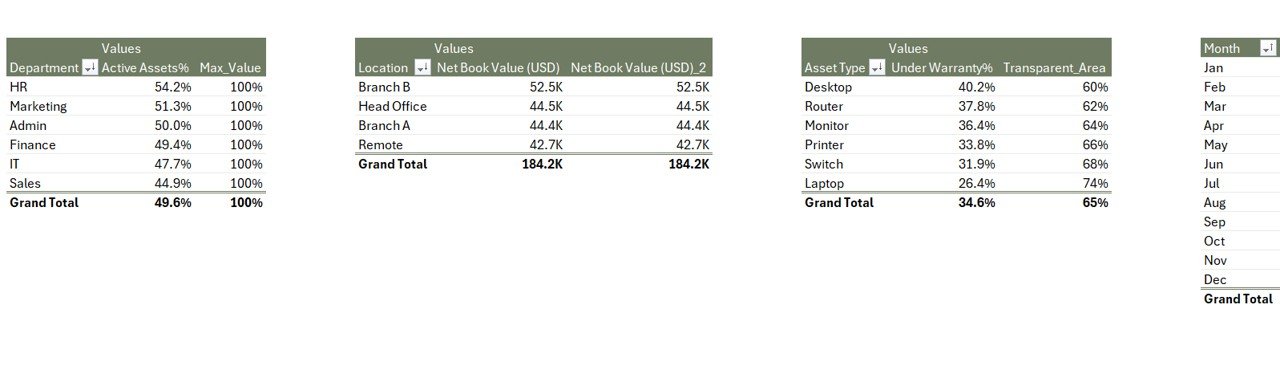
📈 Pivot-Based Charts with Smart Filters
Visuals that tell stories:
-
Active/Inactive Asset %
-
Net Book Value by Location
-
Under Warranty % by Asset Type
-
Inactive Assets by Month
Use right-side slicers to filter by Department, Location, Status, etc.
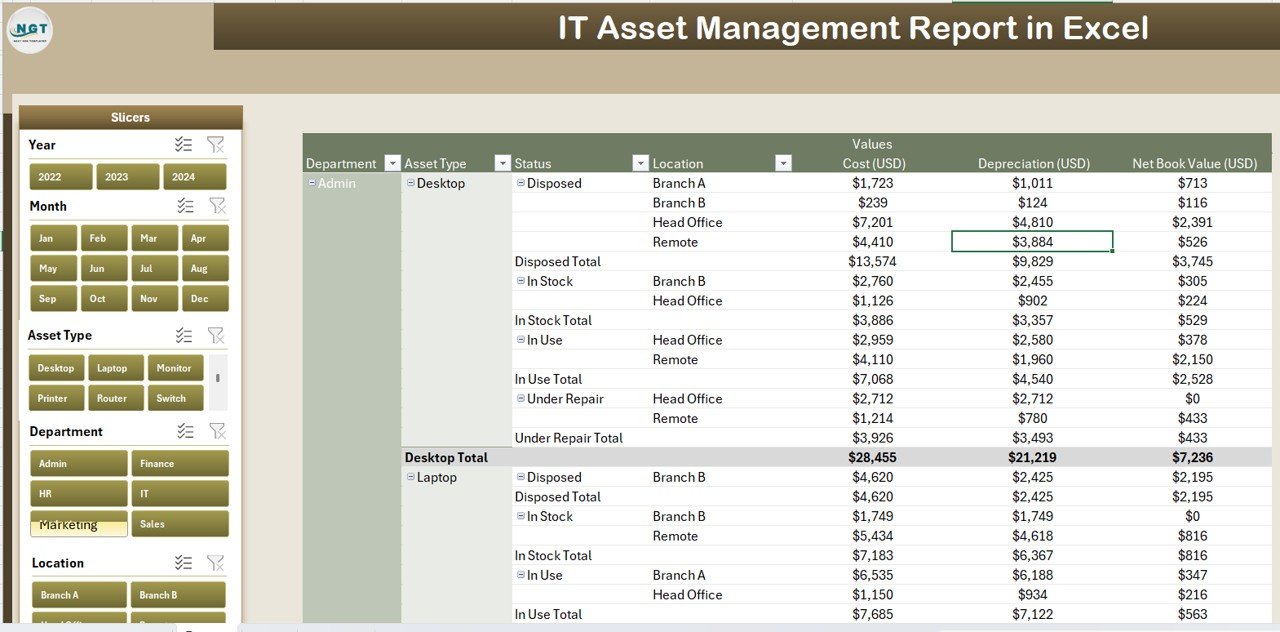
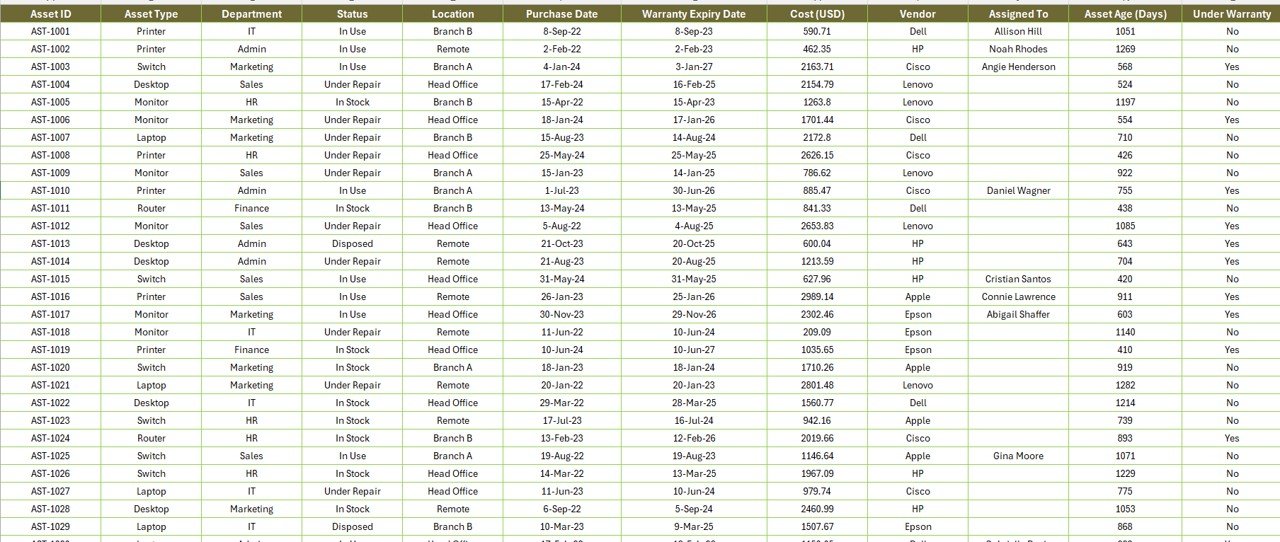
📑 Detailed Report Page for Operational Audits
Search, sort, and filter through a slicer-enabled table showing every detail from acquisition to warranty status—perfect for IT audits, compliance, and procurement.
📂 Data Sheet with Dropdown Validations
Input fields include:
-
Asset Name
-
Asset Type
-
Department
-
Status
-
Warranty Flag
-
Location
-
Purchase Date
-
Cost & Book Value
-
Additional custom fields
🎯 Support Sheet with Reference Lists
Maintain consistent dropdowns for fields like departments, asset types, statuses, warranty flags, and more. This ensures clean data across your workbook.
📂 What’s Inside the IT Asset Management Report in Excel
✅ Excel File (.xlsx) – Fully formatted and ready to use
✅ 4 Tabs:
-
Summary Page – KPI cards + charts + slicers
-
Report Page – Searchable, sortable asset table
-
Data Sheet – Main entry sheet for all IT assets
-
Support Sheet – Dropdown references and calculation logic
✅ Interactive Slicers – Filter by department, location, asset type, or status
✅ No Coding Required – Built completely with Excel’s native functions
✅ Fully Customizable – Add fields like Serial Number, Last Service Date, Assigned User, etc.
✅ Visual Reporting – Perfect for operational reviews or board-level presentations
⚙️ How to Use the IT Asset Management Report
📝 Step 1: Enter Asset Data
Use the Data Sheet to enter or import all your IT assets. Fields include basic specs, costs, warranty status, and more.
📊 Step 2: Review KPIs on Summary Page
Check asset health, warranty coverage, and value distributions at a glance. Use slicers to drill down by department or asset type.
🧾 Step 3: Perform Audits with the Report Page
Access a full asset register that supports filtering, searching, and slicing. Ideal for audits and compliance reports.
🔧 Step 4: Customize for Your Needs
Add fields or dropdown options in the Support Sheet and extend the dashboard easily using Excel’s pivot capabilities.
📤 Step 5: Export or Present
Use Excel’s export feature to save reports as PDFs or send dashboards to stakeholders via email or shared drives.
👥 Who Can Benefit from This IT Tracking Tool
💼 IT Managers – Monitor asset lifecycle and avoid downtime
🧾 Procurement Officers – Track vendor reliability and refresh cycles
📊 Finance Teams – Measure depreciation and net book value
✅ Compliance Officers – Ensure asset visibility for audits and ISO/SOC2 standards
📎 Operations & Admin Teams – Track laptops, licenses, routers, and peripherals easily
This dashboard works for startups, mid-size firms, and enterprises alike.


Reviews
There are no reviews yet.